Abstract
Focal adhesion kinase (FAK) relays integrin signaling from outside to inside cells, and contributes to cell adhesion and motility. However, spatiotemporal dynamics of FAK activity in single FAs is unclear due to lack of a robust FAK reporter, which limits our understanding of these essential biological processes. Here we have engineered a genetically encoded FAK activity sensor, dubbed FAK-SPARK, which visualizes endogenous FAK activity in living cells and vertebrates. Our work reveals temporal dynamics of FAK activity during FA turnover. Most importantly, our study unveils polarized FAK activity at the distal tip of newly formed single FAs in the leading edge of a migrating cell. By combining FAK-SPARK with DNA tension probes, we show that tensions applied to FAs precede FAK activation, and that FAK activity is proportional to the strength of tension. These results suggest tension-induced polarized FAK activity in single FAs, advancing the mechanistic understanding of cell migration.
Introduction
Signal transduction from environment to inside cells plays essential roles in modulating cell adhesion and motility1. Within this signaling pathway, focal adhesion kinase (FAK) is a critical component in sensing and integrating extracellular cues to control cell motility2,3. FAK activity regulates dynamic formation of cell adhesions and membrane protrusions, which controls cell movement2. In particular, FAK influences focal adhesion (FA) turnover, including FA assembly and disassembly 4. FA is a critical structure in connecting extracellular matrix to intracellular structures including actin filament5. During cell movement, including spreading and migration, integrin-matrix interaction triggers FA formation, which anchors cells to the substrate and provides traction force for actin polymerization-induced membrane protrusion. Therefore, spatiotemporal control of FAK activity is essential in regulating FA dynamics. To further understand role of FAK during cell spreading and migration, it is ideal to visualize real-time FAK activation in single FAs with spatial and temporal resolution.
To achieve spatiotemporal resolution, it is preferred to use a genetically encoded fluorescent reporter in imaging FAK activity. Such a reporter should have large dynamic range, i.e. large fluorescence change upon FAK activation, which will enable robust reporting of FAK activation. It should also provide high spatial resolution in single FAs, so that FAK activity can be reported during FA turnover. And it should have good temporal resolution that is within temporal range of FA dynamics. While Förster resonance energy transfer (FRET)-based FAK activity reporters utilizing autofluorescent GFP and its variants have been developed6, these FRET-based reporters suffer from weak signal, with small fluorescence changes upon FAK activation, and they lack spatial resolution in imaging FAK activity in single FAs. Here, we designed a versatile and robust FAK activity reporter by utilizing a new principle-based approach: GFP phase separation via multivalent interactions that are induced by FAK activity-dependent phosphorylation. We named this FAK reporter FAK-SPARK for separation of phases-based activity reporter of kinase. FAK-SPARK forms intensely bright droplets upon FAK activation in living cells and vertebrate animals. FAK-SPARK achieves excellent spatiotemporal resolution and visualizes endogenous FAK activity within single FAs during their assembly and disassembly.
Results
Designing a FAK reporter by GFP phase separation.
To develop FAK-SPARK so that we can induce GFP phase separation by active FAK, we designed a multivalent interaction system. First, we fused a FAK-derived substrate peptide containing tyrosine 397 (Y397) to EGFP (enhanced GFP). This substrate peptide has been widely used in the FRET-based biosensors6, and is well known to be specifically phosphorylated by FAK (and thus we named it FAKsub). Next, we fused the phosphopeptide-binding domain SH2 to a non-fluorescent GFP mutant (denoted as EGFP* that contains Y66F mutation). Third, we fused a multivalent tag named homo-oligomeric tag (HOTag) to each of the above constructs, which introduces multivalency (Fig. 1A) 7,8. Here the hexameric tag HOTag3 is fused to FAKsub-EGFP. And a tetrameric tag HOTag6 is fused to SH2-EGFP*. The two HOTags are de novo designed coiled coils8. Lastly, to express the two parts in one construct, we linked the two parts with the “self-cleaving” 2A sequence (Supplementary Information, Supplementary Table 1). Thus, when FAK is activated, the FAKsub is phosphorylated, resulting in its interaction with SH2 (Fig. 1B). Together with the multivalent HOTags, this drives phase separation of EGFP through multivalent interaction. Specifically, each hexameric FAKsub-EGFP-HOTag3 recruits six SH2-EGFP*-HOTag6, and each tetrameric SH2-EGFP*-HOTag6 recruits four FAKsub-EGFP-HOTag3. This multivalent interaction-driven crosslinking and phase separation lead to phase separation of EGFP, forming intensely bright droplets (Fig. 1B).
Fig. 1. Phosphorylation-induced GFP phase separation-based FAK reporter visualizes endogenous activity of FAK in living cells and vertebrates.
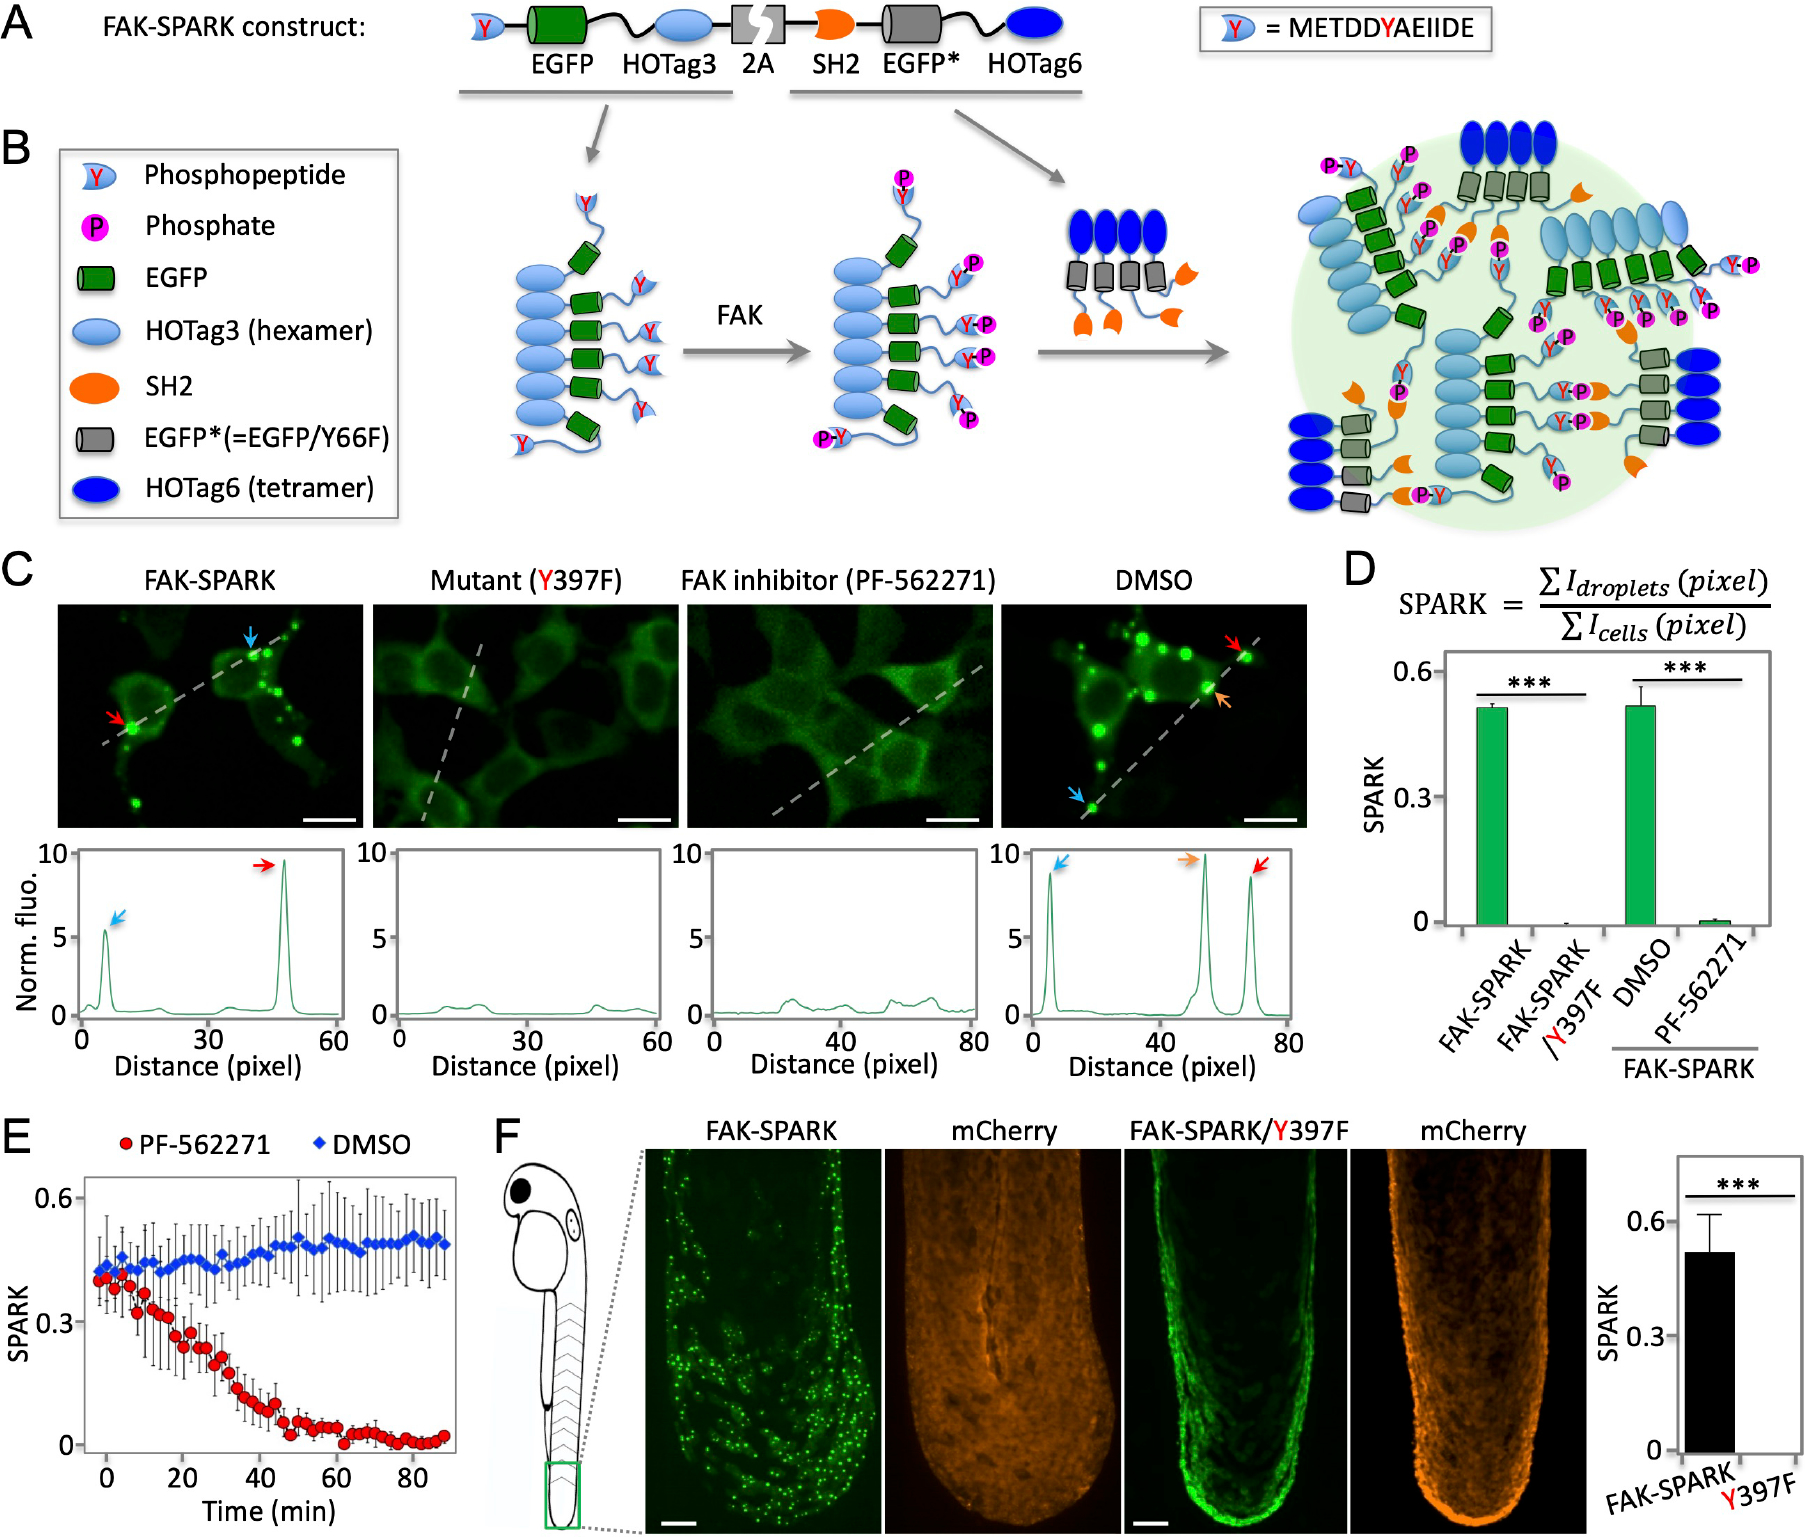
(A) Schematic of construct of FAK reporter FAK-SPARK (separation of phases-based activity reporter of kinase). HOTag: homo-oligomeric tag. (B) Cartoon showing working mechanism of FAK-SPARK. (C) Upper panels: (two left panels) fluorescence images of cells expressing FAK-SPARK, FAK-SPARK mutant Y397F that cannot be phosphorylated by FAK; (two right panels) fluorescence images of cells expressing FAK-SPARK incubated with FAK inhibitor or DMSO. Lower panels: histogram along the dash line. (D) Quantified SPARK signal in cells with various conditions. (E) FAK-SPARK is reversible upon addition of FAK inhibitor. (F) Fluorescence images of transgenic zebrafish expressing FAK-SPARK. Tg (UAS-FAK-SPARK) was crossed with Tg (ΔNp63:GAL4), and Tg (UAS-mCherry). Data are mean ± SEM (n = 3 or 4 biological replicates). ***: p value < 0.001. Scale bar, 20 μm (C, F).
To demonstrate and characterize FAK-SPARK, the reporter was expressed in HEK293 cells, which showed punctate fluorescence in the cytoplasm (Fig. 1C). This is in contrast to the homogeneous fluorescence from a mutant reporter, in which the Y397 was mutated to phenylalanine (F) so that it cannot be phosphorylated by FAK. Because of multivalent interactions in the droplets, this would likely perturb EGFP fluorescence lifetime. Indeed, using fluorescence lifetime imaging microscopy (FLIM), we found that the EGFP fluorescence lifetime in the droplets is shorter than that in the diffuse state (i.e. homogenously distributed GFP) (Supplementary Fig. 1, Methods). These data suggest that the multivalent interactions induced EGFP droplet formation and that FAK-SPARK reports FAK activity in the cells. To further confirm this, we incubated the cells with FAK inhibitor PF-562271, which inhibited punctate fluorescence. In comparison, incubation with DMSO, did not inhibit the punctate structure of FAK-SPARK. To analyze the imaging data in a quantitative way, we defined “SPARK signal”, which is the ratio of summarized fluorescent droplets’ pixel intensity divided by summarized cells’ pixel intensity (Fig. 1D). Thus, “SPARK signal” measures percentage of GFP in the droplet form over total. SPARK signal-based analysis confirmed that FAK inhibitor blocked droplet formation, and the droplet formation was dependent on Y397 phosphorylation (Fig. 1D). Next, we characterized that the reporter droplets were reversible upon addition of the FAK inhibitor. Time-lapse imaging showed that half-to-maximum time (T1/2) was ~30 minutes (Fig. 1E, Supplementary Fig. 2). We further showed recovery of reporter droplets after washing out inhibitor (Extended Data Fig. 1). Thus, FAK-SPARK is reversible in reporting FAK activity. We also confirmed that FAK-SPARK could detect FAK activity in various cancer cells (Extended Data Fig. 2).
Lastly, we demonstrated that FAK-SPARK was able to detect FAK activity in living vertebrate animals. First, we created a transgenic zebrafish that is referred to as Tg(UAS-FAK-SPARK)” in which the FAK-SPARK reporter is under the UAS promoter. Next, we crossed it with the transgenic zebrafish TgBAC (ΔNp63: Gal4FF)la213 so that the reporter is expressed in the basal epithelial cells in which mCherry is also expressed by UAS-mCherry9. Imaging in the tail bud of zebrafish at 48 hours post fertilization (hpf) showed bright green fluorescent droplets, whereas mCherry showed homogenous red fluorescence (Fig. 1F). In contrast, the transgenic zebrafish expressing the Y397F mutant reporter that does not respond to FAK, showed homogeneous green fluorescence in the same region. These data indicate that FAK-SPARK reports FAK activity in the live and intact zebrafish. Therefore, FAK-SPARK will be a useful tool for imaging FAK activity in animals.
FAK activation follows assembly of FAs during cell spreading.
We first demonstrated that FAK-SPARK achieved spatiotemporal resolution in detecting FAK activity using synthetic system (Supplementary Information, Extended Data Fig. 3, Supplementary Movie 1), we next applied it to visualize dynamics of FAK activity during cell spreading. We transfected FAK-SPARK into cells, with co-expression of a red fluorescent protein mApple-fused paxillin that labels focal adhesions10. To induce and visualize cell spreading, we detached and re-seeded cells 24 hours after transfection. ~1–2 hours after re-seeding, the cells re-attach and spread11. We then conducted time-lapse imaging of cell spreading process (Fig. 3A). First, cells increased area outward over time, indicting cell spreading (Fig. 3B). Meanwhile, small FAK-SPARK droplets were generated from the leading edge, and moved inward, likely driven by retrograde flow. Zoom-in images showed that the small droplets were produced in the focal adhesions and moved toward the center of cells (Fig. 3B, inset). Quantitative analysis of the imaging data showed that area of the spreading cell increased over time, and that FAK-SPARK signal also increased. Furthermore, increase of FAK-SPARK signal is well correlated with the increase of cellular area (Fig. 3B, right panel). This suggests that during the cell spreading, FAK is activated, which mainly occurred in the leading edge at early spreading (Supplementary Movie 2).
Fig. 3. FAK is activated before disassembly of FAs, or during sliding and turnover.
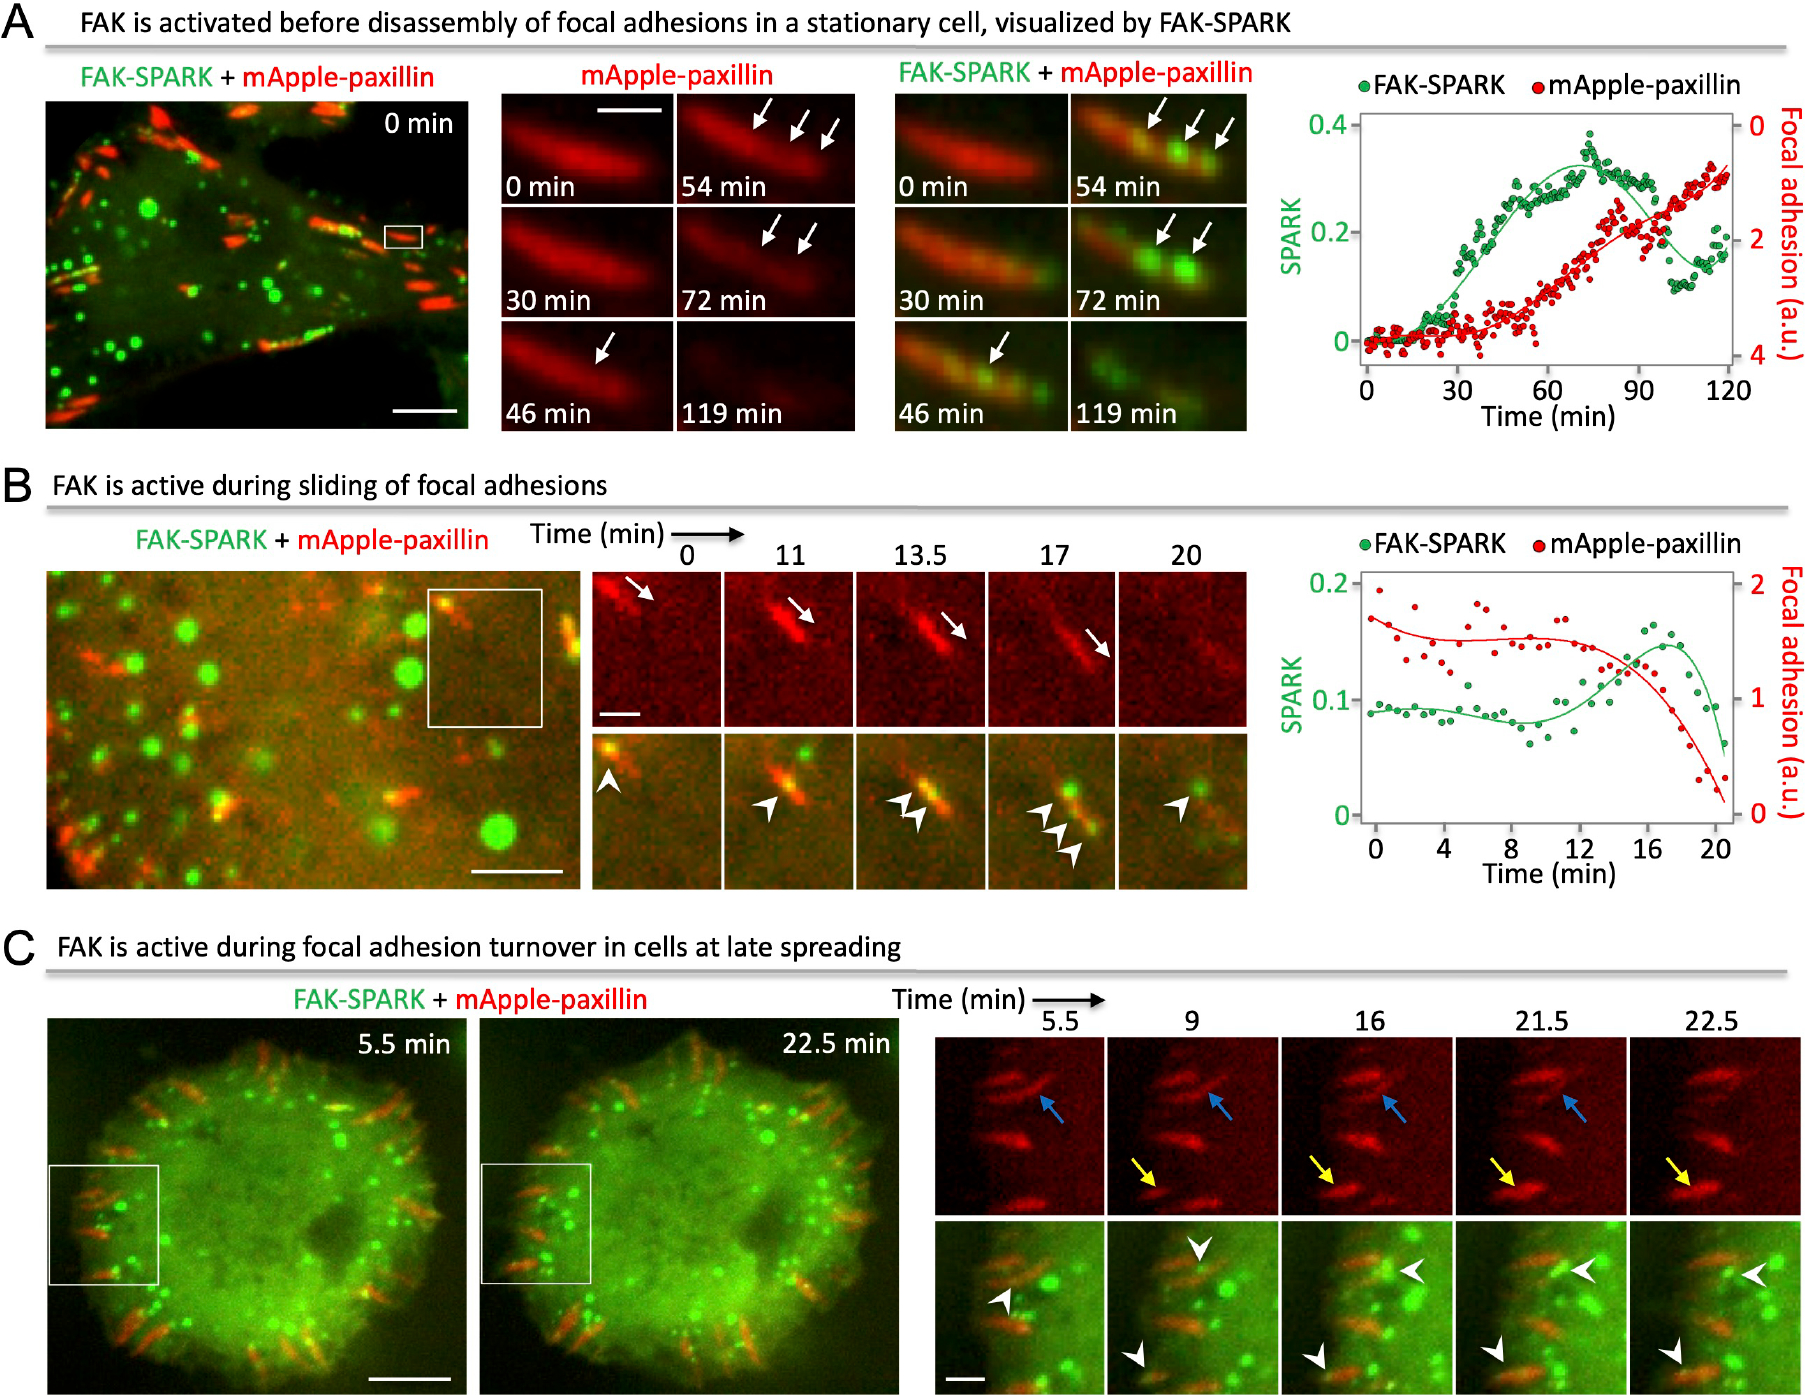
(A) Left: fluorescence images showing FAK activation within single FAs before disassembly in a stationary cell. Right: normalized SPARK signal and focal adhesions over time. (B) Left: fluorescence images showing FAK activation within single FAs during sliding. Right: normalized SPARK signal and focal adhesions over time. (C) Fluorescence images showing FAK activation during assembly and disassembly of FAs in a late spreading cell. Scale bar, (A) Left: 10 μm; right: 2 μm. (B) Left: 5 μm; right: 2 μm. (C) Left: 10 μm; right: 3 μm.
FAK-SPARK droplets were not only produced in the leading edge (Supplementary Movie 3, but also produced during the assembly of focal adhesions in the area away from the leading edge (Supplementary Movie 4). Time-lapse imaging revealed that following assembly of single FAs, which were visualized by mApple-paxillin, FAK-SPARK droplets formed within single FAs (Fig. 3C). Quantitative analysis of the FA growth and FAK-SPARK signal within this single FA region showed that FA growth precedes the FAK-SPARK signal (Fig. 3C, right panel), indicating that FAK activation follows FA assembly. Furthermore, the green droplets were generated in the single FA in a temporal order following the growth direction of the single FA (Fig. 3C, time series insets at 108 and 118.5 min, Supplementary Movie 5).
FAK activity precedes FA disassembly.
Because previous studies showed that FAK activity is required for disassembly of FAs4, we imaged FAs and FAK activity in living cells. Time-lapse imaging revealed that before disassembly of FAs in a stationary cell, FAK-SPARK droplets appeared first in the single FAs (Fig. 4A, Supplementary Movie 6). Quantitative analysis showed that FAK was inactive and became activated before FA disassembly (Fig. 4A, right panel, Supplementary Movie 7). Our data thus indicate that FAK activation precedes disassembly events of FAs, which is consistent with previous studies showing essential roles of FAK in FA disassembly12,13.
Fig. 4. FAK activity is polarized at the distal tip of newly formed focal adhesions in the leading edge.
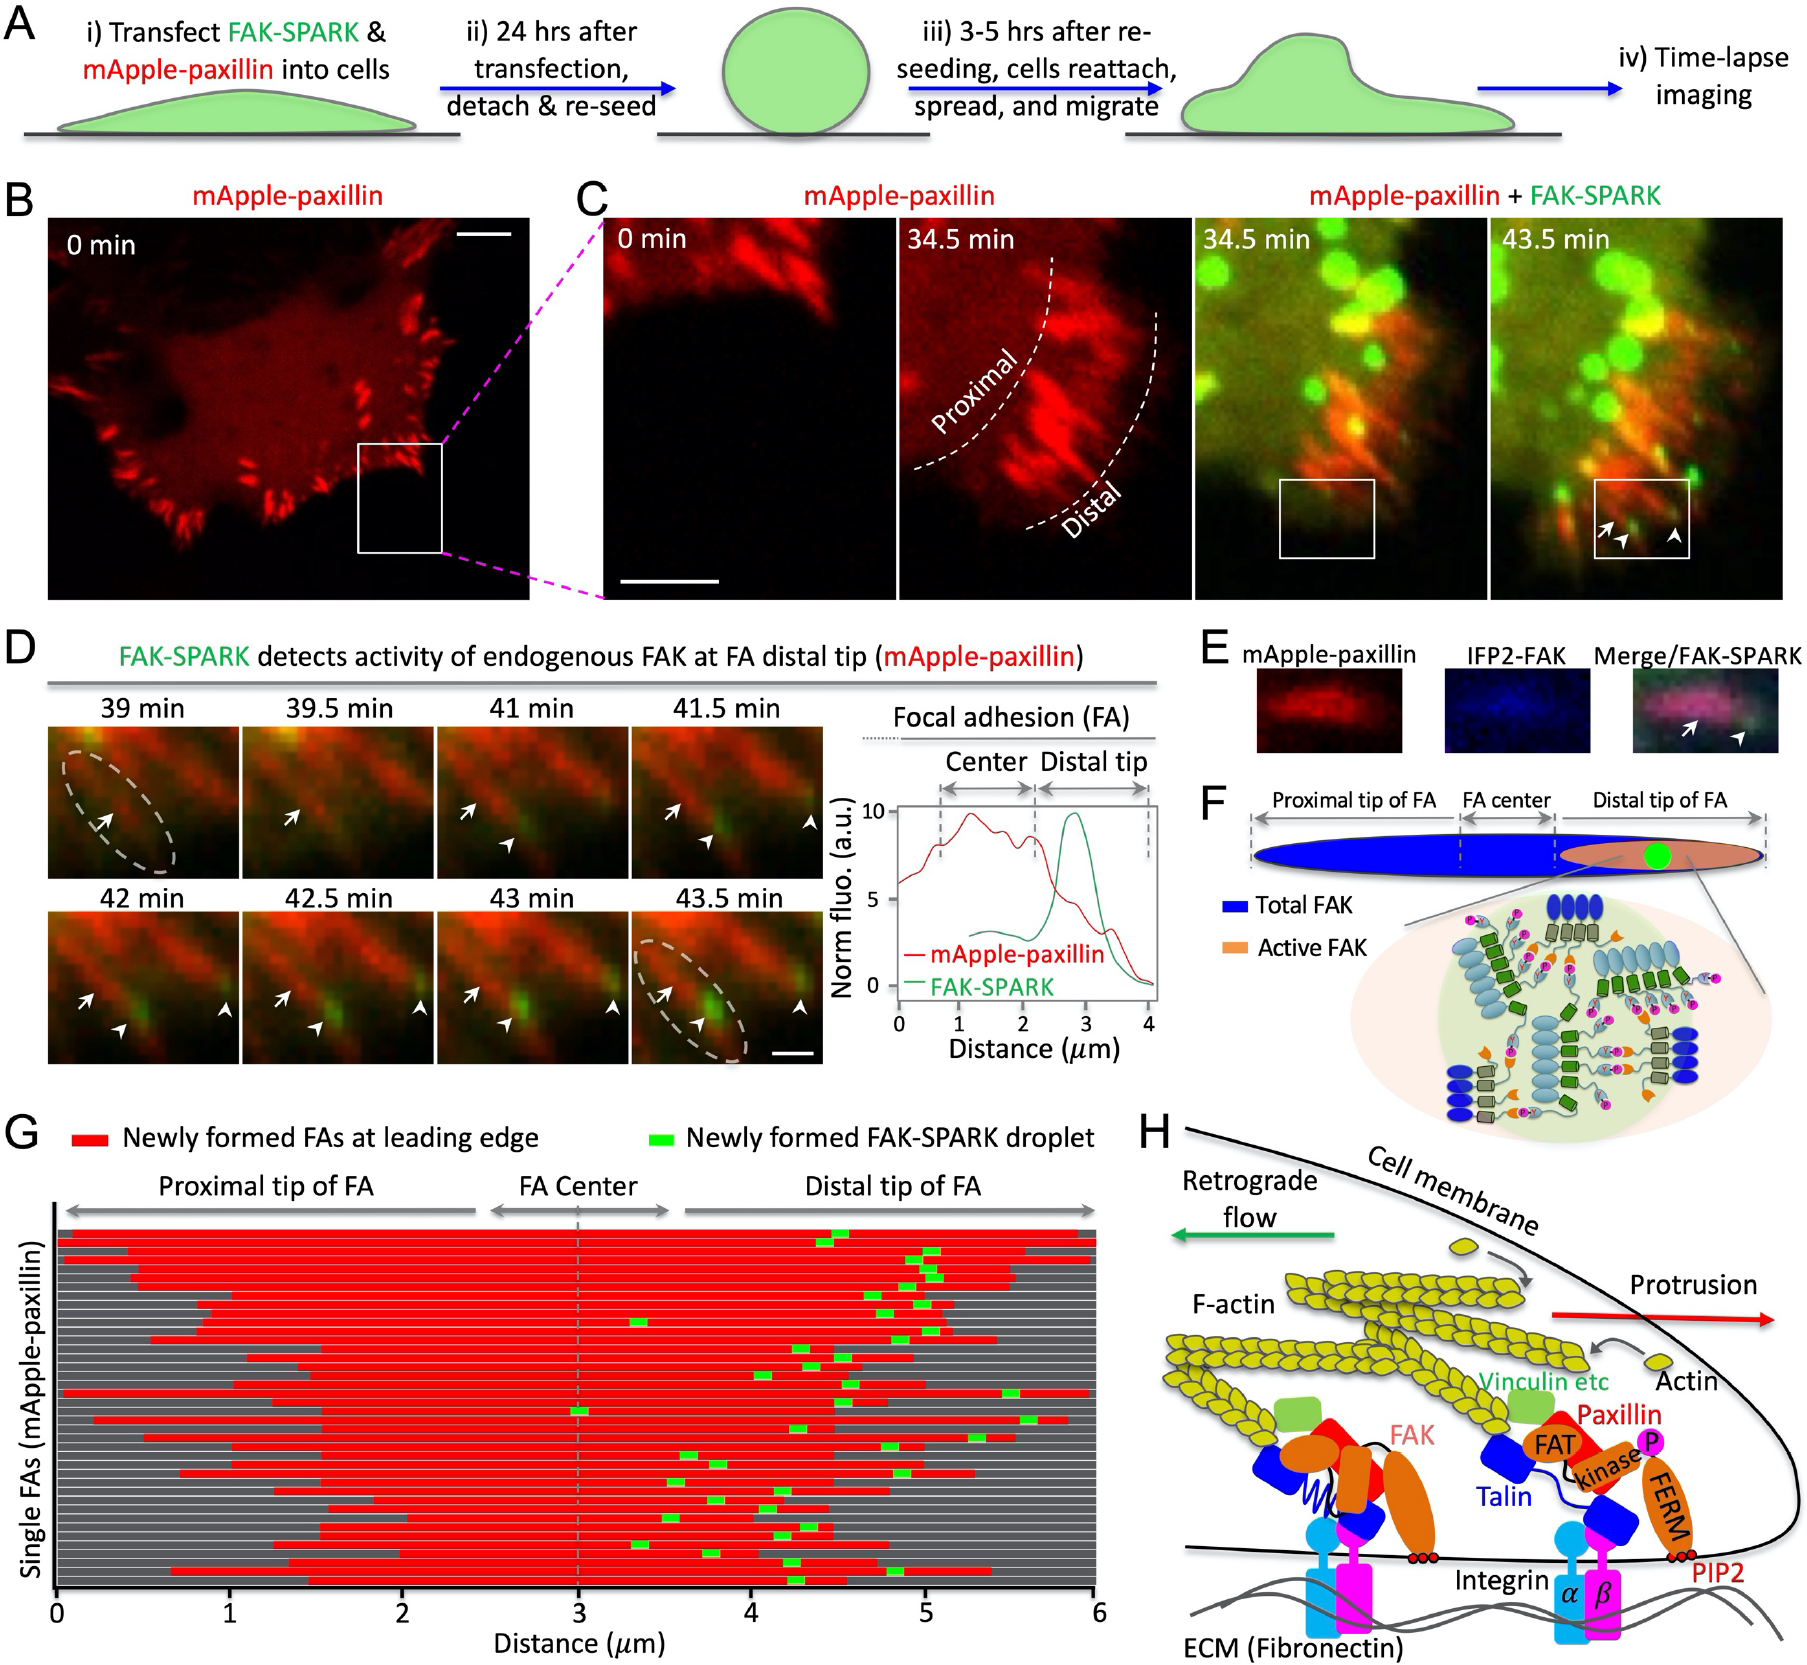
(A) Experimental procedure. (B, C) Time-lapse images of cells expressing mApple-paxillin and FAK-SPARK. (D) Left: fluorescence images of the boxed area in (c). Right: normalized fluorescence intensity over distance along the single FA (dashed box at 43.5 min). (E) Fluorescence images. (F) Cartoon showing distribution of total FAK and activated FAK within single FAs. (G) Distribution of newly formed FAK-SPARK droplets in single FAs at the leading edge. (H) Proposed model showing polarized FAK activation in single FAs at the leading edge of a migrating cell. Scale bar, (B) 10 μm; (C) 5 μm; (D) 1 μm.
FA “sliding” has also been reported previously14,15, and we observed such events in the spreading cells. FAK-SPARK droplets were produced in the sliding FAs (Fig. 4B, Supplementary Movie 8). Quantitative analysis indicated that FAK was active during FA sliding events (Fig. 4B, right panel). At late stage of cell spreading, the cellular area had little change, but FAK-SPARK droplets were still generated in the edge of cells (Supplementary Movie 9). Time-lapse imaging in the periphery of cells showed that FAs assembled (Fig. 4C, yellow arrows) and disassembled (Fig. 4C, blue arrows) over time, and that FAK-SPARK droplets were generated in the FAs undergoing turnover (Fig. 4C, Supplementary Movie 10). Therefore, our imaging data showed that FAK-SPARK visualized FAK activity during FA dynamic turnover in cells.
We also examined whether expression of the additional substrate from FAK-SPARK would perturb focal adhesion dynamics and cell behavior. Here we characterized dynamics of focal adhesions including the FA assembly and disassembly rate in FAK-SPARK sensor-expressing cells and compared them to the control cells expressing GFP. We found that the FA assembly and disassembly rates are similar with no significant difference between the FAK-SPARK-expressing cells and the control (Extended Data Fig. 4). This suggest that FAK-SPARK expression does not perturb FA assembly and disassembly. To examine if FAK-SPARK expression perturbs cell behavior, we characterized cell migration rate using wound-healing assay and found that cells expressing the reporter showed similar migration rate in comparison to the control cells (Extended Data Fig. 5). Taken together, our data thus suggest that expression of the reporter dose not perturb focal adhesion dynamics and cell behavior such as migration.
Polarized FAK activity in newly formed FA at leading edge.
After late spreading, cells start to migrate11. We imaged FAK activity at the leading edge of the migrating cells (Fig. 5A). Briefly, we transfected FAK-SPARK and mApple-paxillin into HeLa cells, which were then reseeded and allowed to reattach and spread. FAK-SPARK visualized green droplets, which were produced in the distal tip of newly formed FAs in the leading edge (Fig. 5B–D). Quantitative analysis of the fluorescence intensity confirmed that FAK-SPARK droplets were distributed in the distal tip of single FAs (Fig. 5D, right panel). These droplets then dissociated from the FAs and moved toward the cell body due to retrograde flow (Supplementary Movie 11). This is likely because after FAK-induced phosphorylation of the reporter’s substrate peptide, the phosphorylated substrates will no longer interact with FAK. Thus, after phosphorylation, the FAK-SPARK droplets will no longer interact with FAK and thus with retrograde flow in the leading edge, they moved toward the cell body. This is also partly due to the relatively long lifetime of the droplets ~ 20 minutes (supplementary Fig. 3). These FAK-SPARK droplets’ flow speed is ~ 0.5 – 1.5 μm/min, which is consistent with the reported actin retrograde flow ~ 0.6 – 1.8 μm/min 16. Furthermore, these droplets became larger on their way toward the cell center, because the smaller droplets fuse together during their movement.
Fig. 5. Polarization of FAK activity depends on FERM domain, integrin and actin cytoskeleton.
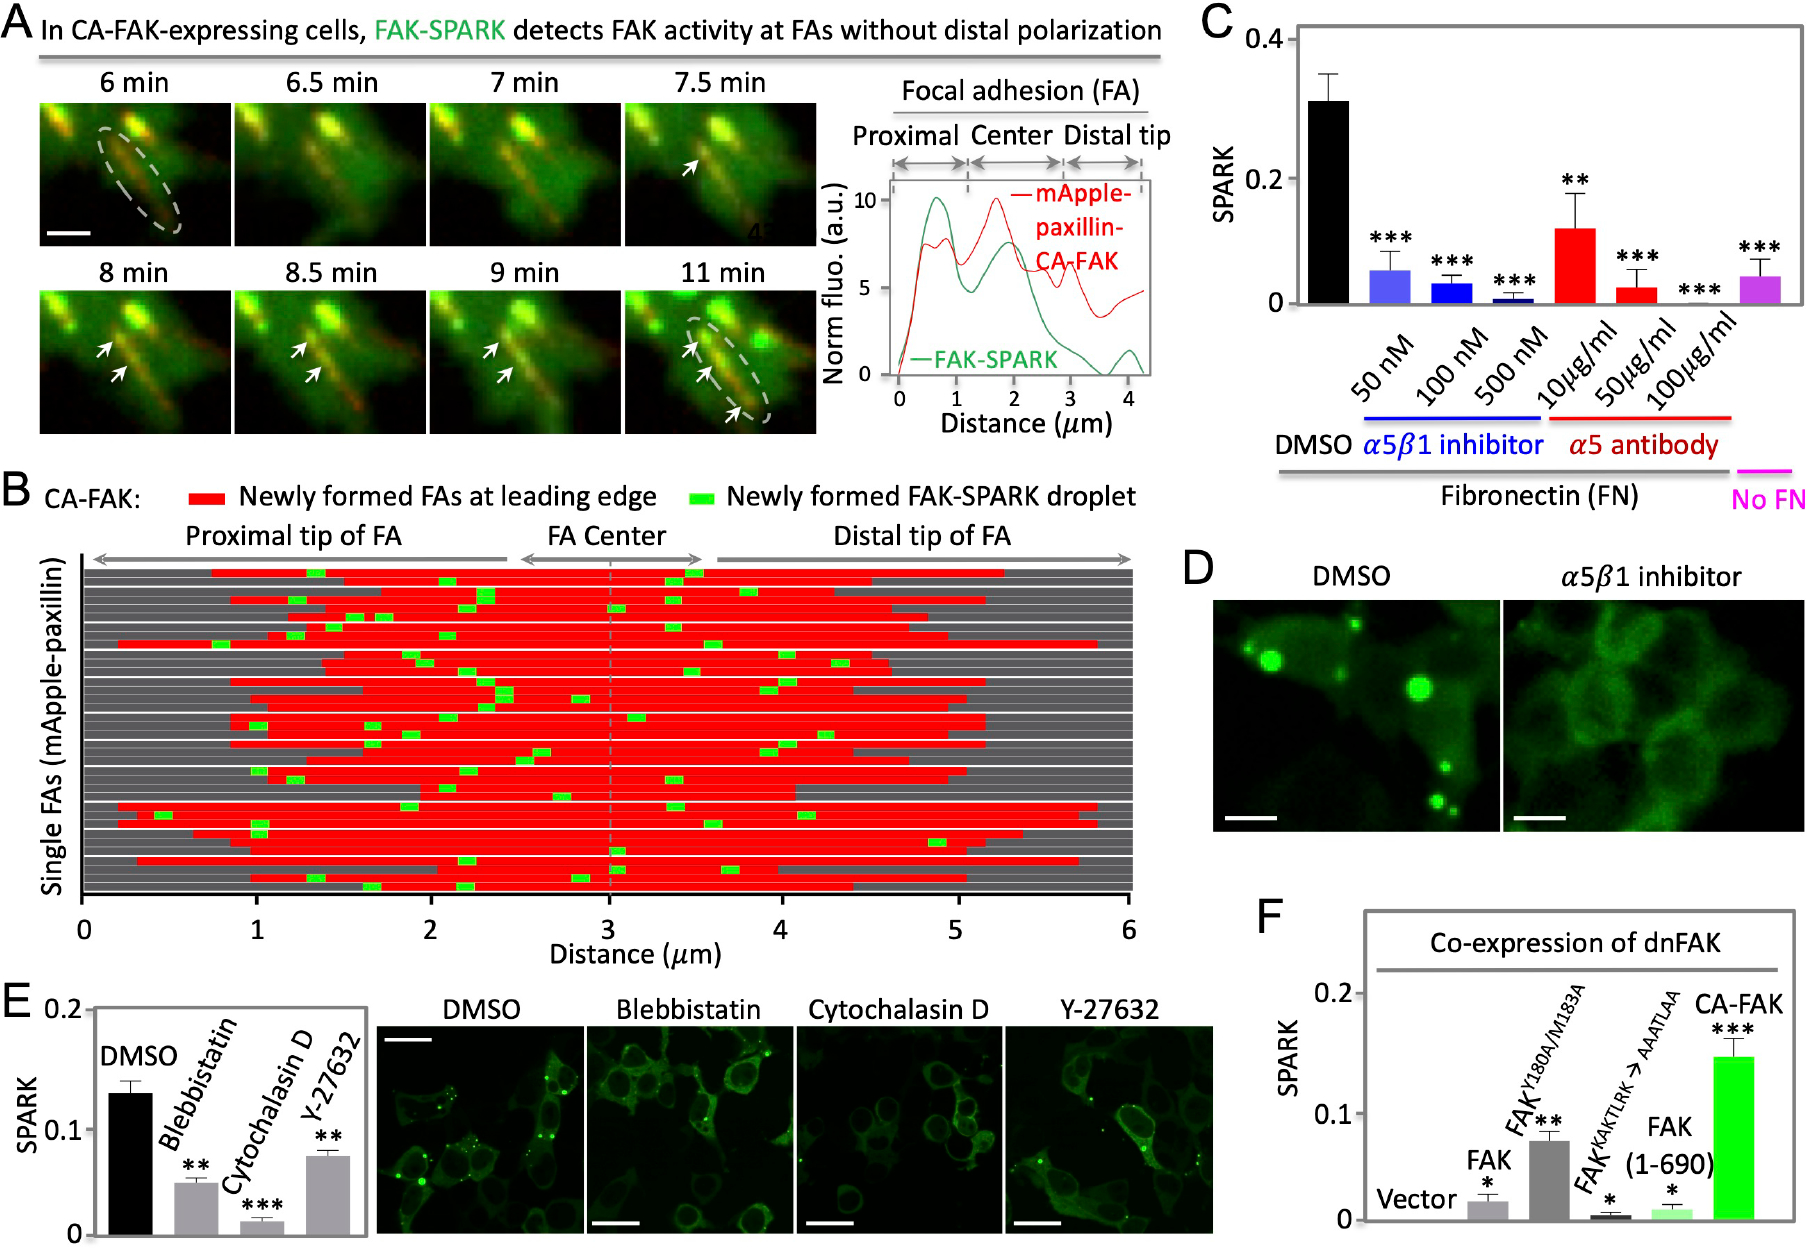
(A) Left: fluorescence images showing no distal polarization of FAK activity when CA-FAK is fused to paxillin and targeted to focal adhesions in cells with endogenous FAK knocked down by shRNA against FAK (Details in text). Right: normalized fluorescence over distance along the single FA (boxed area at 11 min). (B) Distribution of newly formed FAK-SPARK droplets in single FAs at the leading edge. (C) Normalized SPARK signal in cells incubated with integrin inhibitors or antibodies. Cells were grown on fibronectin. (D) Representative images of cells expressing FAK-SPARK, incubated with DMSO or integrin inhibitor. (E) Left: normalized SPARK in cells incubated with inhibitors of myosin II, actin polymerization, and ROCK. Right: Representative images (F) Normalized SPARK in cells expressing various FAK mutants. The cells co-expressed dominant negative FAK (dnFAK), and FAK-SPARK. Data are mean ± SEM (n = 3 or 4 biological replicates). *: p value < 0.05. **: p value < 0.01. ***: p value < 0.001. Scale bar, 1 μm (A); 10 μm (D); 15 μm (E).
We also verified that FAK was distributed along the entire FA using a near-infrared IFP2-tagged FAK (Fig. 5E, F) 17–19. We further used immunostaining against the endogenous FAK, which indicated that the endogenous FAK was distributed along the entire FA (supplementary Fig. 4). In contrast, newly formed FAK-SPARK droplets were found in the distal tip of the newly formed FAs in the leading edge of a migrating cell. Statistical analysis of over 40 single FAs showed that formation of FAK-SPARK droplets occurred in the distal tip of these newly formed FAs in the leading edge of migrating cells (Fig. 5G). Furthermore, immunostaining with antibody against FAK pY397 showed that FAK-SPARK droplet signal colocalized with peak signal of FAK pY397, demonstrating that the sensor reports polarized FAK pY397 signal (supplementary Fig. 5). Thus, our data suggest that while FAK is distributed in both the distal and proximal tip of FAs, the active FAK is mainly found in the distal tip of FAs in the leading edge.
Based on our results and current understanding of FAK activation mechanisms, we propose a model (Fig. 5H) to interpret the polarized FAK activity in single FAs at the leading edge (See details in Discussion). Briefly, membrane protrusion is induced by actin polymerization in the leading edge of a migrating cell. Actin contraction generates forces, which are likely stronger when closer to the membrane. Through the focal adhesions and integrin-extracellular matrix (e.g. fibronectin) interaction, the actin contractibility-generated force is transmitted to FAK, which, on the one hand, is connected to actin filament via actin-vinculin-paxillin-FAK 20 by binding to paxillin via its FAT domain, or via actin-Arp2/3-FAK 21,22, and on the other hand, is anchored to cell membrane via interaction of FERM with phosphatidylinositol 4,5-bisphosphate (PI(4,5)P2) 23,24. The tension on FAK dissociates the inhibitory FERM domain from the kinase domain, initiating FAK activation. Our model suggests that the closer an FA is to the membrane protrusion, the stronger the actin contractibility-induced force and the stronger the tension on the FA (and FAK), resulting in polarized FAK activity along single FAs at the leading edge of a migrating cell.
Polarized FAK activity depends on inhibitory FERM domain.
According to the above model, the inhibitory FERM domain is one critical component for the polarized activity of FAK in single FAs at the leading edge. To test this, we decided to target CA-FAK to the focal adhesions at the leading edge and examine whether FAK-SPARK droplets would be generated without polarization. We knocked down endogenous FAK by shRNA against the c-terminal region of FAK (between 854 and 860aa) (supplementary Fig. 6). Knockdown of FAK abolished FAK-SPARK droplets in cells (supplementary Fig. 6). We then fused CA-FAK to mApple-paxillin and expressed the fusion protein, which rescued FAK activity in cells (supplementary Fig. 6). Time-lapse confocal microscopic imaging of single FAs revealed that FAK-SPARK droplets were generated at proximal, center, and distal tip of FAs at the leading edge of migrating cells that expressed FA-targeted CA-FAK (Fig. 6A, Supplementary Movie 12). Statistical analysis of ~40 single FAs showed that FAK activity is no longer polarized at the distal tip (Fig. 6B). Furthermore, we confirmed that re-expression of the wild-type full-length FAK (wtFAK) in these cells showed polarized activity of FAK (supplementary Fig. 7). Interestingly, CA-FAK enhanced FA assembly and disassembly rate compared to the wtFAK (supplementary Fig. 8). Taken together, our results indicate that the FERM domain is critical for the polarized FAK activity, which is consistent with the proposed model (Fig. 5H).
Fig. 6. FAK-SPARK droplet formation scales with integrin ligand Ttol.
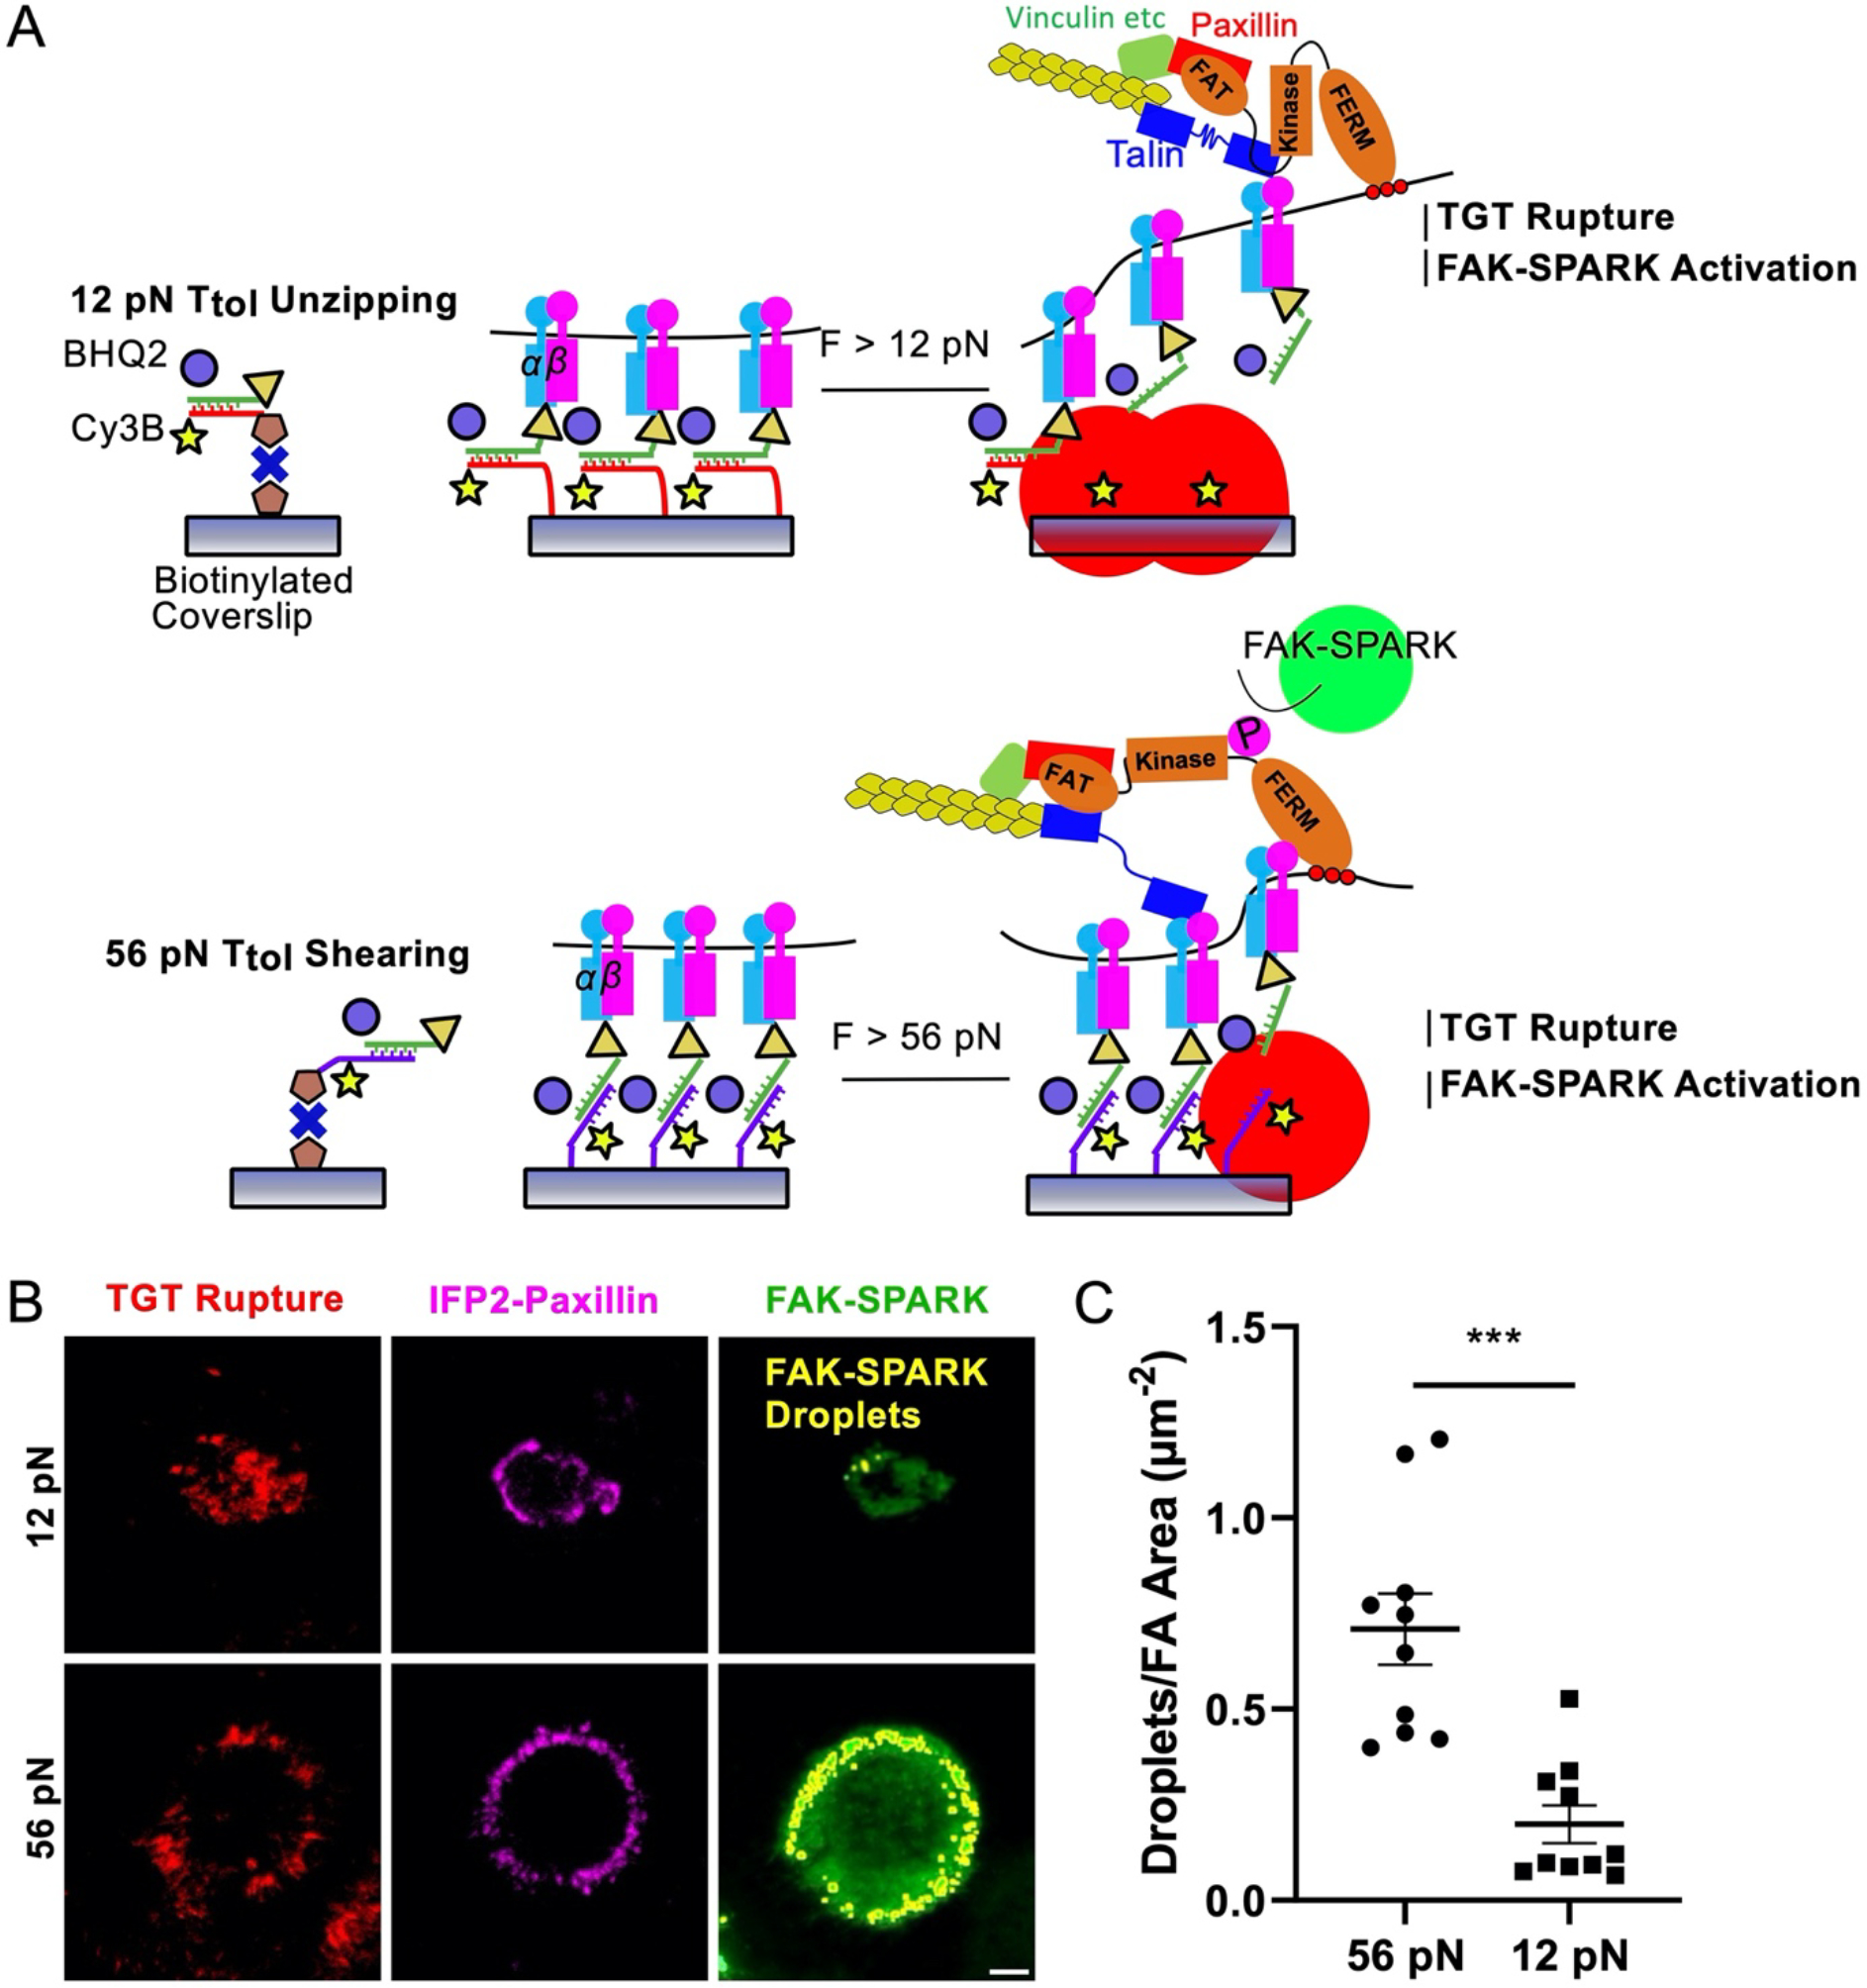
(A) Diagram of 12 pN TGT geometry and TGT force induced fluorescence and FAK activation mechanism. (B) FAK-SPARK droplet (green outlined in yellow) fluorescence micrographs of HeLa cells transfected with FAK-SPARK and on 12 and 56 pN TGTs after 30 min incubation. (C) Number of identified FAK-SPARK droplets normalized by FA area in each cell for 12 and 56 pN TGTs. N = 10 cells (4 biological replicates). Scale bar, 5 μm.
FAK activity depends on integrin and actin contractibility.
To further support the proposed model, we next examined whether the detected FAK activity is dependent on integrins that bind fibronectin. α5β1 is one of the main integrins in HeLa cells that also express αvβ5 and αvβ3 25. Incubation of cells with α5β1 inhibitors reduced FAK activity in a dose-dependent manner (Fig. 6C, D) 26. Antibody against α5β1 also blocked FAK activity 26. These data demonstrate that FAK activity does depend on integrins, which is consistent with the proposed model.
Next, we perturbed actin cytoskeleton and examined whether this affects FAK activity. Incubation with blebbistatin, a myosin II inhibitor 27, reduced FAK activity (Fig. 6E). Actin polymerization inhibitor, cytochalasin D 24, also blocked FAK activity. Furthermore, Rho-kinase inhibitor, Y-27632 28, also inhibited FAK activity. We also confirmed the observed reduction of FAK activity by determining FAK pY397 levels using western blot analysis, which showed that pY397 level was largely reduced upon treatment with the drugs (supplementary Fig. 9). These data indicate that actin contraction contributes to FAK activation, which is consistent with the previous studies 10,24 and the proposed model (Fig. 5H).
Lastly, we examined several FAK mutants that were previously reported to have altered activity or interaction with the plasma membrane. We blocked basal FAK activity by co-expressing a dominant negative FAK (dnFAK) that is comprised of the FRNK domain 29,30. Then we expressed various FAK mutants and FAK-SPARK. First, expression of the wild type (WT) FAK rescued FAK activity as expected. Second, expression of FAK mutant Y180A/M183A, which has reduced affinity between FERM and the kinase domain 23, showed higher FAK activity than WT FAK, which is consistent with the consensus that the FERM domain interacts and inhibits the kinase (Fig. 6F). Third, the KAKTLRK motif at the FERM domain has been characterized to be responsible for binding to PI(4,5)P2 via the positively charged lysine and arginine because mutation of these basic residues to alanine blocked FAK interaction with PI(4,5)P2 23. Expression of this FAK mutant showed little FAK activity, which is consistent with our model (Fig. 5H). Lastly, expression of the kinase domain from 355 to 690aa (i.e. CA-FAK) showed the strongest FAK activity among the mutants (Fig. 6F). Addition of the FERM domain to this CA-FAK, i.e. 1-690aa, significantly reduced FAK activity to a level similar to that of WT-FAK (Fig. 6F).
Integrin-ECM ligand tension drives FAK activation.
We first showed that Integrin-ECM ligand tension precedes FAK activity (Supplementary Information, Extended Data Fig. 6, Supplementary Figs. 10–20, Supplementary Table 2, Supplementary Movie 13). Next, to further investigate the causal relationship between integrin tension and FAK activation, we designed a set of experiments that controlled integrin force levels and then recorded FAK signaling outcomes. Specifically, we anchored the RGD ligands to the tension gauge tether (TGT) which is a double stranded DNA duplexes that dissociate from the substrate at different magnitudes of force, described as the tension tolerance (Ttol) (Fig. 8A, Supplementary Fig. 21) 31–34. The Ttol can be tuned from ~12 pN to 56 pN by altering the geometry of the TGT. When RGD ligand on the top strand is at the same end of the duplex as the anchoring group on the bottom strand, then forces lead to unzipping which is facile and requires ~12 pN of force. Conversely, when the RGD ligand is at the opposite end of the duplex compared to the surface anchoring group, then applied force re-orient the probe into a shearing geometry and dehybridization requires large forces of ~56 pN (Fig. 8A) 33,34. The top and bottom strands are modified with quencher and fluorophore, respectively, such that mechanical denaturation of DNA is quantified by fluorescence (Fig. 8A). Conveniently, we used TIRF microscopy to map DNA dehybridization which is a readout of traction force history.
HeLa cells transfected with FAK-SPARK and IFP2-paxillin were plated on TGT surfaces of 12 and 56 pN Ttol for 20 min and then we imaged these three fluorescence channels in single cells to quantify focal adhesion formation, TGT rupture, and FAK-SPARK signaling. Consistent with prior reports 31, cell spreading and focal adhesion formation was limited on the 12 pN probes but the TGT signal was greater for these 12 pN probes. Interestingly, FAK-SPARK droplets were more abundant on 56 pN TGTs compared to 12 pN TGTs (Fig. 8B, C). We also found that while the FA area was ~2-fold smaller in cells seeded on 12 pN TGT substrate than those on 56 pN TGT, the FAK-SPARK activity normalized by FA area was higher in cells seeded on 56 pN TGT substrate than those on 12 pN TGT, demonstrating that FAK activity is proportional to the amplitude of the tension even when the activity is normalized to the FA area (Supplementary Fig. S22). This difference in activity was sustained over 80 minutes of cell spreading as quantified by image segmentation analysis (Supplementary Fig. S23, Methods) demonstrating the persistent influence of ligand Ttol on FAK activity. Timelapse imaging of FAK-SPARK droplets showed retrograde flow for both 12 and 56 pN TGTs and the differential FAK signaling and dynamics was sustained over 80 min of imaging (Supplementary Fig. 23, Supplementary Movies 14–15). Moreover, we also quantified phospho-FAK Y397 levels for cells on 12 and 56 pN TGTs. These immunostaining experiments confirm the fidelity of the FAK-SPARK biosensor and showed significantly enhanced FAK-pY397 signal per cell for the 56 pN TGT compared to that of the 12 pN probes (supplementary Fig. 24, Methods). Increased FAK-SPARK activity for cells on 56 pN TGTs demonstrates that FAK activity is mechanosensitive and specifically integrin-ligand forces > 12 pN lead to enhanced FAK signaling.
Discussion
Our phase separation-based FAK activity reporter FAK-SPARK has several advantages compared to previous FAK reporters 24,35,36. First, FAK-SPARK achieves large dynamic range, simple signal pattern, and high brightness, which enable robust detection of FAK activity in living cells and animals. As a comparison, previous genetically encoded FAK activity reporters such as FRET-based reporters have a small dynamic range due to weak fluorescence change of the donor and acceptor fluorophores upon FAK activation, which makes them difficult to detect FAK activation. Second, FAK-SPARK achieves spatial resolution in single focal adhesions and even within a single FA. This is consistent with another GFP phase separation-based reporter for imaging ATM kinase activity upon DNA damage 37,38. In contrast, previous FAK reporters suffer from poor spatial resolution. For example, they require genetic targeting to FAs in order to detect FAK activity in FAs 24. We emphasize that in order to achieve the spatial and temporal resolution of FAK activity, formation of FAK-SPARK droplets should be monitored because of relatively long lifetime of the droplets and that they may drift away if there is intracellular fluid flow such as actin retrograde flow. Third, FAK-SPARK reporter does not require exogenous expression of FAK, which is advantageous to the other reporters 35,36. Fourth, FAK-SPARK achieves fast temporal resolution within 1–2 minutes based on the data with expression of active FAK in the nucleus, which enables detection of FAK activation dynamics during FA turnover including assembly and disassembly. On the other hand, the long time-delay between tension build-up and FAK-SPARK signal suggests that temporal resolution of FAK-SPARK likely depends on several factors including the time for FAK activation and accumulation of sufficient FAK activity that leads to SPARK droplet formation. Taken together, FAK-SPARK provides an excellent tool for spatiotemporal imaging of FAK activity within single FAs in living cells and animals using appropriate imaging approaches.
Our data suggest that FAK is active where focal adhesions are most dynamic including FA turnover (assembly and disassembly). Previous studies show that FAK enhances cell spreading 39. Indeed, we observed that FAK activation follows FA assembly during cell spreading and migration, and that FAK activation is proportional with cell spreading. We also found FAK activation during FA disassembly, suggesting that FAK activity is likely required for FA disassembly. This is consistent with previous studies that in FAK-deficient mouse, cells show larger focal adhesions, in addition to reduced cell motility 4. FAK activation and potential phosphorylation of its substrate proteins in FA may trigger downstream events, resulting in FA disassembly. And FAK activation might be caused by tension resulted from contraction of actin cytoskeleton.
Our work showed that FAK activity is polarized along the newly formed single FAs at the leading edge of a migrating cell. Interestingly, several previous studies suggest that FAK is a tension-activatable kinase and that the FERM domain of FAK interacts with and inhibits the kinase domain, and that tension-induced pulling dissociates the FERM from the kinase domain, initiating FAK activation 23,40–42. Furthermore, a previous study reported that the traction force on single FAs is skewed to the distal tip of FAs (toward the leading edge) 43, and that paxillin is more phosphorylated at the distal tip 10.
Combining these with our observations, we propose a model to explain the observed polarization of FAK activity (Fig. 5H). In the leading edge of a migrating cell, actin and actomyosin contraction generates forces, which are likely stronger when closer to the membrane (Fig. 5H). Transmission of this actin contraction-generated force from actin cytoskeleton to FAK (via actin-vinculin-paxillin-FAK 20) depends on: 1) interaction of FAK’s FAT domain with paxillin within single FAs that are connected to actin filament; 2) the integrin-ECM interaction, which anchors the FAs to the substratum; and 3) the FERM interaction with the plasma membrane via PI(4,5)P2 23,24. Combining these factors, the tension on FAK is likely stronger toward the leading edge, as shown by the previous observations of polarized tension within single FAs toward the leading edge43. This may lead to differential degree of FERM dissociation from the kinase, resulting in polarized FAK activities within single FAs, consistent with polarized paxillin phosphorylation 10. On the other hand, FAK activity enhances actin polymerization via regulating Rho-family GTPases44. The polarized FAK activity may thus direct actin polymerization and contractibility via actomyosin, generating positive feedback with the actin contractibility-induced tension on FAK and its activation, resulting in membrane protrusion by actin polymerization and directed cell migration. Therefore, our results, together with previous studies, suggest that polarized tension and FAK activity in single FAs at the leading edge may guide cell migration.
To support the proposed model, we conducted various studies including mutagenesis and DNA tension probe-based approaches. We showed that the FAK activity we observed does depend on integrin, because inhibition of integrin by small molecule inhibitors of α5β1 or antibodies against α5 abolished FAK activity. Second, inhibitors of actin polymerization, myosin II and ROCK, reduce FAK activity. These data indicate that FAK activation does depend on actin cytoskeleton. Our results are consistent with current consensus that actin cytoskeleton propagates force to FAs via FA connection with actin filament and integrin10. We also verified that FAK activity is dependent on FERM domain’s interaction with PI(4,5)P2, because disruption of FERM::PI(4,5)P2 interaction by mutagenesis does reduce FAK activity. And we further showed that FAK inhibition is dependent on FERM domain’s association with the kinase domain of FAK, because reduction of this interaction by mutating key residues that mediate this interaction increases FAK activity.
It is currently debated as to whether integrin mediated traction force is directly sensed by FAK and triggers its activation, or whether FAK signaling exclusively promotes the generation of integrin traction forces. For example, Stutchbury et al. showed that substrate stiffness does not affect the rate at which FAK is recruited to FAs 45. Acebrón et al. hypothesized that allosteric changes induced by cell membrane interactions are responsible for the priming of FAK, and that their data fits with a model where FAK activation occurs by force 46. Furthermore, multiple studies support the model that FAK is a mechanosensor. FAK undergoes changes in autophosphorylation in response to changing substrate stiffness for fibronectin (FN) coated surfaces 47. Micropillar array deflection experiments showed that inhibition of FAK reduces FA paxillin phosphorylation, vinculin recruitment, and integrin mediated traction force on FN substrates, demonstrating that FAK has a downstream influence on FA traction force 48. Recent single molecule force spectroscopy measurements showed that FERM-kinase rupture is associated with a force peak, suggesting that FAK kinase activity could be modulated by mechanical tension because the FERM domain is known to inhibit the kinase activity and its dissociation could lead to kinase activation 49. Perhaps the strongest evidence to support that FAK is a mechanosensor comes from a study by Zhou et al. 50 showing that FAK phosphorylation (pY397) and total FAK correlate with the amplitude of the applied force 50.
Our results strongly support that FAK is a mechanosensor that detects pN integrin force magnitude. While we do not provide evidence to the mechanism of mechanosensation, the literature suggests that forces drive a conformational change of FAK out of the autoinhibited state, which is akin to the mechanism of how vinculin senses tension within FAs. Our data demonstrates that FAK activation occurs within focal adhesions in less than 20 min following mounting of tension and recruitment of focal adhesion markers. Moreover, capping the forces at focal adhesions using the TGT to values <12 pN shows dampening of FAK activity, thus directly demonstrating a causal link between integrin tension and FAK activity. Taken together, our data is consistent with a model where FAK directly senses integrin tension and responds by phosphorylation of its kinase.
Methods
Plasmid construction and lenti virus production
All plasmid constructs were created and purified by standard molecular biology techniques and confirmed by exhaustively sequencing the cloned fragments. To create FAK-SPARK, DNA fragments encoding ETDDYAEIIDE was inserted to replace FKBP in the pcDNA3 FKBP-EGFP-HOTag3 construct 51,52. DNA sequence encoding SH2 domain was inserted upstream of a non-fluorescent GFP mutant (EGFP* containing Y66F mutation) followed by HOTag6. A “self-cleaving” 2A (T2A) sequence was further added to 3’-downstream of FAK-EGFP-HOTag3 via PCR and the resulting FAK-EGFR-HOTag3-T2A fragment was then subcloned into 5’-upstream of SH2-EGFP*-HOTag6 to generate the full FAK-SPARK expressing vector. The tyrosine was changed to phenylalanine (ETDDPAEIIDE) for the mutFAK-SPARK via designed DNA oligo-synthesis. FAK-SPARK-NLS was generated via inserting NLS sequence (PAAKRVKLD) before EGFP and EGFP* in FAK-SPARK. For lentiviral vector, the DNA fragment encoding FAK-SPARK was cloned into pHR-SFFV-GFP1-10 to replace GFP1-10. Lentivirus production followed standard protocol of “Improve Lentiviral Production Using Lipofectamine 3000 Reagent” from ThermoFisher Scientific.
Cell culture
The HEK293, 293FT, Hela, U2OS, MDA-MB-231 and MEF cells were passaged in Dulbecco’s Modified Eagle medium (DMEM) while Kelly and SHEP cells were passaged in RPMI 1640 Media supplemented with 10% Fetal Bovine Serum (FBS), non-essential amino acids, penicillin (100 units/mL) and streptomycin (100 μg/mL). All culture supplies were obtained from the UCSF Cell Culture Facility.
Live cell imaging
Cells were grown on Nunc® Lab-Tek® II chambered coverglass for imaging experiment.
To express FAK-SPARK, HEK293 cells were transiently transfected using calcium phosphate transfection reagent 2 with 50 ng FAK-SPARK plasmid. Hela cells were transiently transfected using Lipofectamine 3000 Transfection Reagent with 100 ng FAK-SPARK and 50 ng paxillin-mApple. HEK293 and Hela cell were imaged 1 day after transfection. U2OS, MDA-MB-231, Kelly, SHEP, SKNAS and MEF cells were infected with medium containing ATM-SPARK lentivirus and imaged 3 days after infection.
All imaging was carried out on Nikon Eclipse Ti inverted microscope equipped with Yokogawa CSU-W1 confocal scanner unit (Andor), digital CMOS camera ORCA-Flash4.0 (Hamamatsu) and ASI MS-2000 XYZ automated stage (Applied Scientific Instrumentation). Imaging was performed in environmental control unit incubation chamber (In Vivo Scientific) maintained at 37 °C and with 5% CO2. Fluorescence images were acquired using Nikon CFI Plan Apochromatic 20X dry (N.A. 0.75) objective or CFI apochromatic TIRF 60X oil objective (N.A. 1.49) against GFP, Cherry and IFP per experiment settings.
Hela cell transfection and reseeding
Hela cell (~80% confluency in 24-well plate) were transfected with pcDNA-FAK-SPARK (1ug) and Paxilin-mApple (0.2 ug) or Paxilin-mApple-CA-FAK or Paxilin-IFP2.0 with lipofectamine. 5 hours later, medium was changed with fresh. Prepare fibronectin coated image chamber by incubating chamber with 10ug/ml fibronectin at 37 degrees for one hour followed by 3XPBS washing. 24hours after transfection transfected Hela cells were resuspended with 0.05% Trypsin, then washed and collected in CO2-independent medium (with 10% FBS). After incubation, cells were checked for timelapse imaging. For drug treatment during reseeding, 1652 (dual inhibitor of α5β1 and αvβ1), P1D6, anti–integrin α5, Cytochalasin D, Blebbistatin and Y27632 were added together with resuspended cells into FN-coated chamber and imaged for FAKS-SPARK signal at indicated time with microscope. 1 μM biliverdin was added for imaging with IFP2.0 (FAK-SPARK/tension probe experiments).
Generation of FAK knock-down Hela cell line
Lentiviral vector with shRNA for targeting human FAK (CCGATTGGAAACCAACATATA) were generous gift from Dr. Valerie Weaver. Lentivirus were produced and used to infect Hela cell. After puromycin selection, cells were maintained for further use.
Zebrafish maintenance and imaging
Zebrafish were maintained and handled in compliance with standard (http://zfin.org) and University of California, San Francisco Institutional Animal Care and Use Committee protocols. Wild-type strains used were EKW. UAS-FAKSPARK and UAS-mutSPARK transgenic zebrafish were made with Tol2 system. UAS- zebrafish were mated with TgBAC (ΔNp63:Gal4FF)la213 for skin expression. Imaging was carried out 2 days post fertilization (2 dpf) using Nikon Eclipse Ti inverted microscope under 20X objective.
Phospho-FAK Y397 immunofluorescence microscopy
HeLa cells were incubated for 90 minutes on TGT surfaces in full culture medium. Then, medium was removed and replaced with 4% (v/v) formaldehyde in PBS and incubated for 15 minutes to allow fixation. Special care was taken to reduce the force fluid shear flow during wash steps so as not to dissociate adhered cells from the surface. Formaldehyde solution was then removed, surfaces were washed with three well volumes of PBS then incubated with 0.1% (v/v) Triton-X in PBS, washed again, then incubated in 100 mg/ml BSA for 1 hr. Cells were then incubated in 1 μg/ml Anti-FAK(phospho Y397) antibody EP2160Y in PBS, rabbit monoclonal (abcam ab81298) for 12 hr at 4°C. Cells were then washed with PBS and stained with 3 μg/ml goat anti-rabbit IgG Alexa Fluor-488(abcam ab150077) in PBS, and 50 μL nuc-blue (Invitrogen R3760)(to confirm cell presence via nuclear stain) in PBS for 1 hr then imaged.
Mass spectrometry
For synthetic intermediates products (Product 1 and Product 2, Supplementary Fig. 4), matrix assisted laser absorption ionization (MALDI) time-of-flight(TOF) mass spectrometry(MS) was carried out on an Applied Biosystems 4700 Proteomics Analyzer Matrix-assisted laser desorption/ionization-time of flight (MALDI-TOF) mass spectrometer by dissolving the oligonucleotide at a concentration of 0.1–20 μM in a saturated solution of 3-hydroxypicolinic acid dissolved in of 49.4% (v/v) acetonitrile, 0.1% TFA, and 49.4% water, 5 mg/ml ammonium citrate, or saturated solution of α-cyano-4-hydroxycinnamic acid in 49.4% (v/v) H2O, 49.4% acetonitrile, 0.1% TFA. For synthetic products 3–6 (Supplementary Fig. 4) the molecular weight of the products was evaluated with an electro-spray ionization (ESI) method using a Thermo Fisher Scientific LTQ Orbitrap. The samples were prepared in the mixture of 70% 18.2 MΩ Nanopure water and 30% methanol containing 10 μM ethylenediaminetetraacetic acid (EDTA), 0.0375% triethylamine, and 0.75% of 1,1,1,3,3,3-hexafluoro-2-propanol (HFIP) and recorded the spectra with negative charge mode eluted with same solution. The main peak of obtained ESI-MS spectrum (m/z) was then deconvoluted to obtain average molecular weight for the oligonucleotides 53.
DNA strand hybridization
To anneal MTFM and TGT DNA strands, the respective oligonucleotides were suspended in 20 ul PBS at a concentration of 1 μM in a 0.2-ml microcentrifuge tube. Oligonucleotides were denatured at 95°C for 5 min and subsequently annealed by returning to 25°C at a rate of 1.3°C min−1.
Fabrication of 19 pN hairpin MTFM surfaces and imaging
Modified DNA strands were purchased from Integrated DNA Technologies and functionalized as previously reported (Supplementary Table 1, Supplementary Fig. 13) 54. To prepare MTFM probe modified coverslips, 25 mm No.2 diameter borosilicate glass coverslips (VWRCIR2-25MM) were mounted on a fluorocarbon rack in a 40 ml beaker and rinsed 3 times in 40 ml of ethanol. Coverslips were then sonicated in ethanol for 30 min and then dried in an oven at 100°C for 20 min. Surfaces were then functionalized with biotin, streptavidin, and then MTFM probe (Supplementary Fig. 13). The cleaned slides were treated with fresh piranha solution (3:1 v/v H2SO4:H2O2) for 10 min. CAUTION: piranha solution is highly corrosive and may violently explode if mixed with organic solvents. The coverslips were then rinsed 6 times with 40 ml of 18.2 MΩ resistance purity(nanopure) water, and 3 times with pure ethanol. Subsequently slides were incubated in a solution of 3% (v/v) (3-Aminopropyl) triethoxysilane (APTES)(Sigma 440140-100ML) solution in ethanol for 1 h. Then, the coverslips were washed 3 X with ethanol and dried in a 100°C oven for 30 min. The dry coverslips were then incubated overnight with 2 mg/ml NHS-biotin (Thermo 20217) in anhydrous DMSO in a petri dish at room temperature sealed with parafilm. Biotin modified coverslips were stored at 4°C and used within 2 weeks of preparation. On the day of FAK-SPARK/tension probe experiments, substrates were rinsed with ethanol, mounted in an Attofluor™ cell chamber (ThermoFisher Scientific A7816) for microscopy and washed with 3 X 1 ml chamber volumes of phosphate buffered saline pH 7.4(PBS). The mounted surfaces were incubated with 0.1 wt% BSA in PBS for 30 min, washed with 3 ml PBS and then covered with a 50 μg/ml solution of streptavidin(Rockland-Inc. S000-01) in PBS. After incubating the coverslips for 1 hr at room temperature, they were rinsed with 3 ml of PBS to remove the unbound streptavidin. The surfaces were then covered with 0.5 ml of 60 nM annealed MTFM probe DNA in PBS for 1 hr. Unbound DNA was washed away with 3 ml PBS and 2 mL of normal culture media before plating cells on the surfaces.
Our previous studies demonstrated that the tension signal indeed measures tension and does not result from some artefact at sites of integrin binding to the RGD-DNA substrate. Firstly, our previous study showed that the sensor is evenly distributed by generating probes that lack the quencher with a +/− 7% CV 54,55. Secondly, tension signal shows high coincidence with various focal adhesion markers (Supplementary Fig. 14) 54,56. Furthermore, there are areas where adhesions form, but no significant tension has been built up (Supplementary Fig. 14, paxillin signal is high but without tension). Thus, tension signal does not result from spectral bleed-through between channels despite the high level of colocalization between tension and paxillin.
Fabrication of 12 and 56 pN TGT surfaces
12 and 56 pN TGTs were synthesized (Supplementary Fig. 21) 57. Glass coverslips were piranha cleaned as above for 30 minutes, washed with 6 volumes of nanopure water, then coverslips were etched in 0.5 M KOH on ice in a sonicator for 30 min. Slides were then washed with 6 volumes of water then 4 volumes of ethanol. Coverslips were then dried at 90 °C in an oven for 5 min. To better prevent nonspecific binding of cells to surfaces 150 mg/ml Biotin-PEG-Silane MW 5kDa (Broadpharm BP-24037) in anhydrous DMSO was added to the coverslips and baked at 90 °C in a glass petri dish for 15 minutes 58. Coverslips were then washed with three volumes of nanopure water, dried under a stream of nitrogen gas, and stored at 4°C and used within 2 weeks of fabrication. To functionalize surfaces with TGTs the protocol for MTFM probes was followed as above but without blocking with BSA. TGT DNA probes were annealed as described above using the synthesized TGT DNA strands. Each replicate cells were plated and imaged in microtiter plate 96 round well (Grace Bio Labs 204969) with functionalized coverslips applied to the adhesive bottom. Calculation of F1/2 of DNA hairpin is outlined in Supplementary Fig. 12. The F1/2 threshold at which the DNA hairpins have a 50% probability of unfolding and generating MTFM fluorescence signal is based on assumptions and measurements made by Woodside et al 59.
Microscopy
Cells were seeded onto functionalized coverslips at a density of 2–3000 cells cm−2 and incubated at 37°C in 5% CO2 atmosphere for 20–30 min before fluorescence microscopy imaging. Fluorescence microscopy was carried out using a Nikon Eclipse Ti driven by the NIS Elements Advanced Research software. The microscope objective used was CFI Apo 100X (numerical aperture 1.49) objective (Nikon). The optical system includes a and a total internal reflectance fluorescence (TIRF) variable mirror launcher and a Nikon Perfect Focus System, an interferometry- based device which corrects z-drift of the stage. Fluorescence excitation of samples through the optical system was carried out 488nm (50 mW) and 561nm (50 mW) lasers. Fluorescence micrographs of IFP 2.0-paxillin were acquired using a LED source passed through a Cy5 fluorescence filter cube (Chroma 49006 filter set). The camera used to collect images was a Andor DU-897 X-9319 camera imaging at 50–500 ms exposure times. FLIM images were acquired using a Nikon Ti Eclipse Inverted Laser Scanning confocal microscope with a Plan Apo Lambda 60×/1.40 Oil objective equipped with Picoquant Time Correlated Single Photon Counting (TCSPC) Upgraded with SymPhoTime 64 2.1.3813. TCSPC. Average fluorescence lifetime per pixel was determined using the SymPhoTime Fast FLIM algorithm.
FAK-SPARK particle delay time quantification
Fluorescence microscopy time lapse videos of the FAK-SPARK and IFP2.0-Paxillin transfected cells plated to 19 pN hairpin MTFM surfaces were collected. Newly forming adhesions of 19 pN fluorescence tension signal ROIs were manually selected for line scan analysis using the Fiji imageJ software package(NIH). Each line scan includes the newly formed 19 pN tension area in the early timepoint as well as the FAK-SPARK droplet forming in the later timepoint and averages a 2 pixels width along the direction in the line. Orientation of line scan is position to include both tension defined FA and FAK-SPARK droplet at the timepoint of initial appearance of both FA and droplet, and also the droplet and tension area are closer than 2.5 μm in distance (Extended Data Fig. 6A). Images were then subjected to rolling ball background subtraction with a ball radius of 50 pixels on the to increase contrast and minimize background noise. Kymographs of the line scans were then generated with length on the y-axis, time on the x-axis, and kymograph pixel intensity the average pixel intensity of the 2-pixel width the linear ROI (Extended Data Fig. 6B). Individual kymographs of FAK-SPARK, tension, and paxillin were generated and processed using a python script with the Anaconda package manager. The maximum intensity on the y-axis(distance) of the kymograph is then plotted VS the x-axis(Time) of the kymograph (Extended Data Fig. 6C). The max intensity values of the plot of tension, FAK-SPARK, and IFP2.0-paxillin are then normalized to a scale of 0–1. The time delay is calculated by subtracting the point on the FAK-SPARK trace where the normalized max. intensity reaches 75% of its maximum value from that of the tension signal.
FAK-SPARK droplet production quantification
To quantify relative FAK-SPARK droplet production on TGT’s an algorithm using the Fiji imageJ software package assisted by a macro script was employed. Timelapse micrographs using TIRF488 fluorescence to track FAK-SPARK droplet production using 200 ms exposure time with 100% laser intensity settings ever 30 s for 50 min (Supplementary Movies 13–15).
These were subjected to primary background subtracted subtracting half of the median pixel intensity value of the image frame from each frame. Each frame was then subjected to rolling ball background subtraction with a radius of 15 pixels. Timelapses were then corrected for stage drift using the SPIM Registration 60 ImageJ plugin and by selecting regions of immobile fluorescence intensity to generate an image a drift corrected image. A manual pixel intensity threshold was then applied then the ‘Convert to Mask’ function was applied to create a binary mask image of regions above the threshold intensity. The watershed image segmentation algorithm was applied as described below followed by the ‘Analyze Particles’ image segmentation function with a maximum particle area threshold which was varied as described below. The number of identified particles for each frame was then recorded.
To verify that the identified number of FAK-SPARK droplets identified by particle analysis over time does not change drastically for cells for 12 and 56 pN TGT. Three permutations of the droplet identification algorithm were employed. One with a low 8 μm2 maximum particle area threshold without applying the watershed image segmentation operation (Settings 1) to the binary mask image resulting from intensity thresholding, one with a 8 μm2 maximum area and applying the watershed function(Settings 2), and a third using a higher 24 μm2 maximum particle area (Settings 3). Modifying the particle identification algorithm settings changed the number of particles identified for some FAK-SPARK TIRF fluorescent micrographs (Supplementary Fig. 8). We found that FAK-SPARK droplet count did not change significantly for cells over time regardless of the droplet identification algorithm (Supplementary Fig. 8) through comparing the number of droplets produced using setting by the unpaired t-test with Welch’s correction.
Phospho-FAK Y497 fluorescence quantification
To measure cell spread area an RICM outline of the cell was manually created by creating on ROI of the cell edge and measuring its area. For measurements of fluorescence intensity cell micrographs were subjected to background subtraction, bleed through of fluorescence dye correction, and camera detector background subtraction using a python script. To measure TGT fluorescence the signal intensity in the average intensity in the RICM ROI in the 561 nm channel was measured. To measure phospho-FAK Y397 fluorescence intensity the average intensity in the 488 nm channel was measured within the RICM ROI was measured.
Extended Data
Extended Data Fig.1. FAK-SPARK forms droplets after removal of the FAK inhibitor.
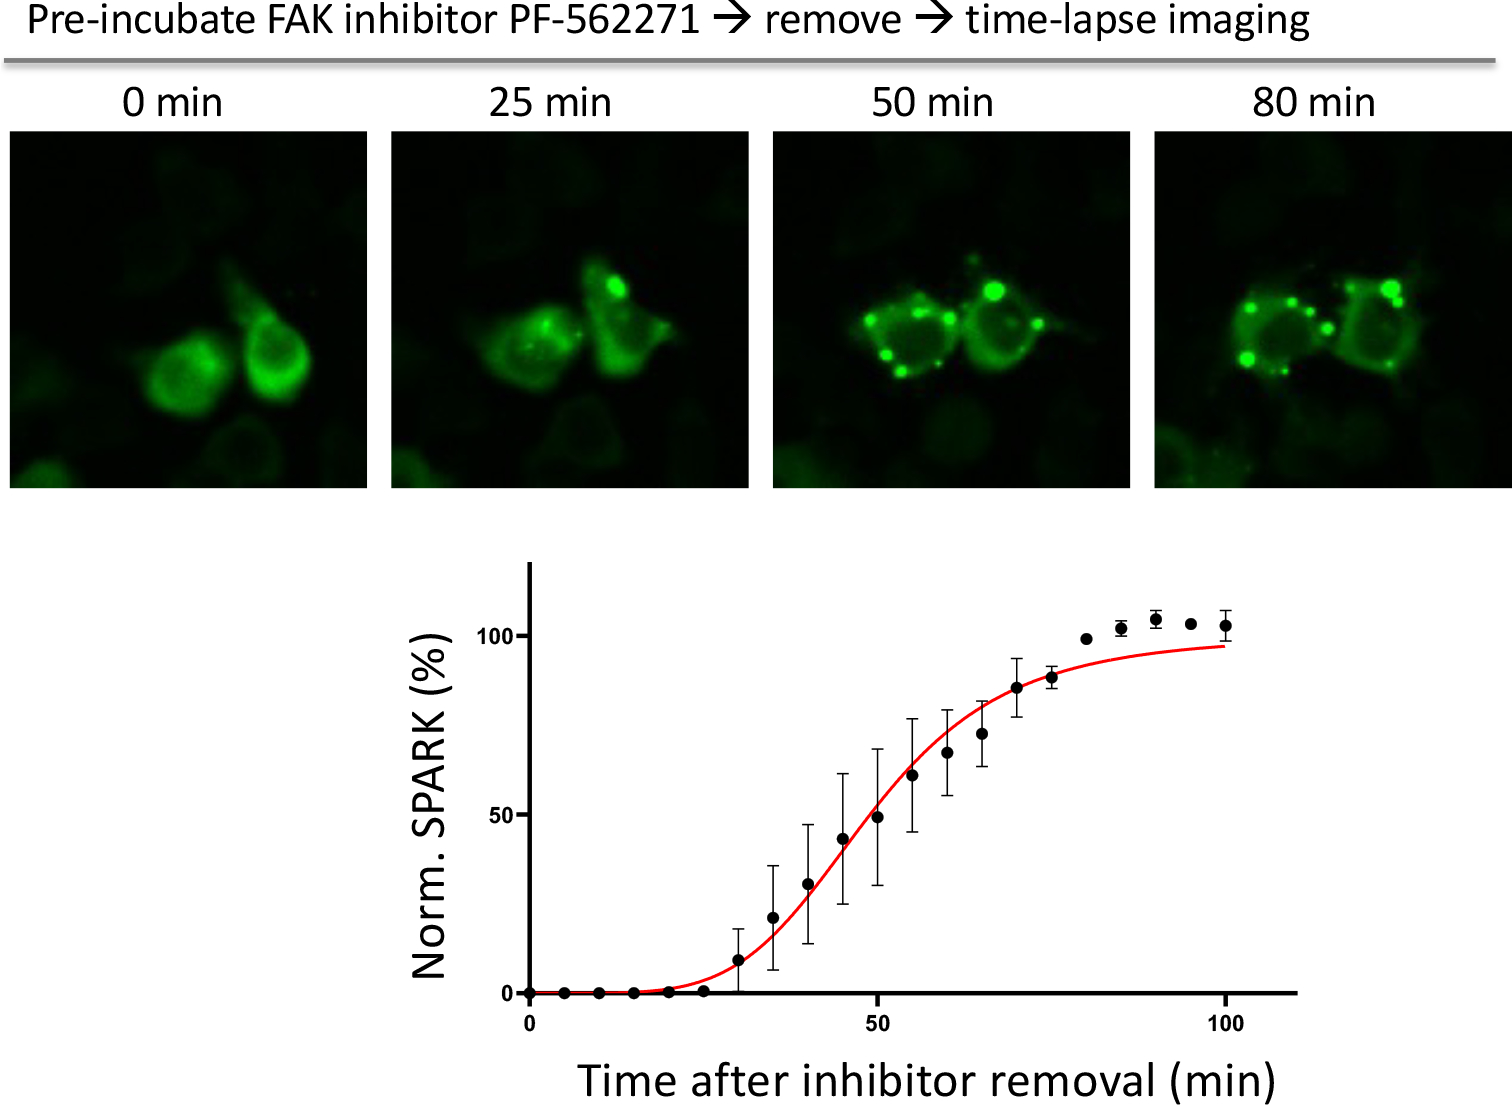
Data are mean ± SEM (n = 3 biological replicates).
Extended Data Fig.2. FAK-SPARK is applicable to various cancer cells in imaging FAK activity using a lentivirus expressing FAK-SPARK.
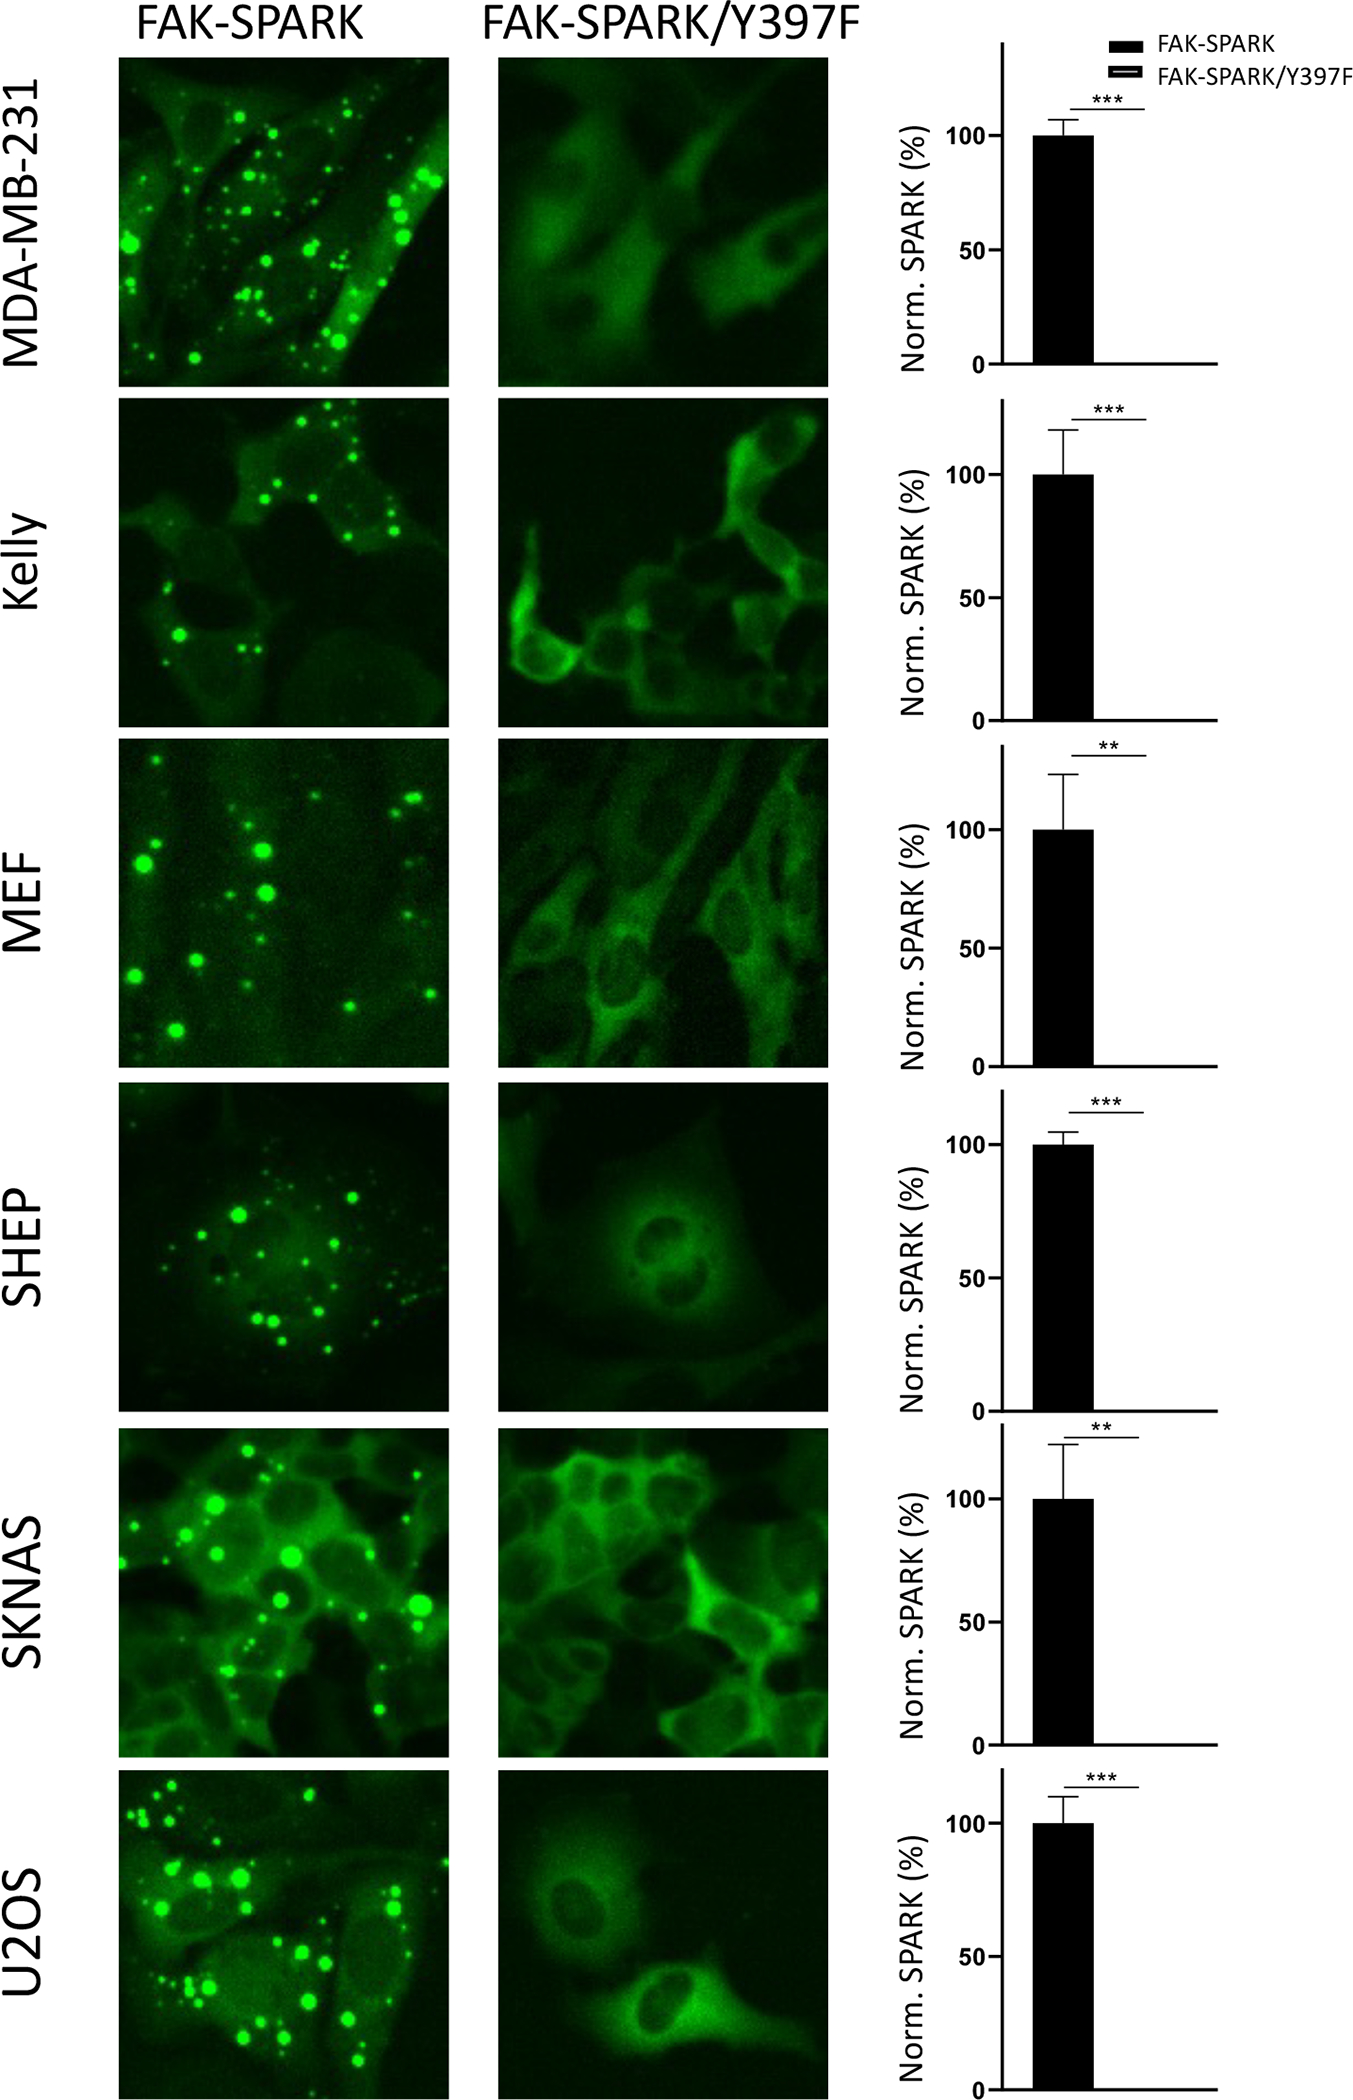
Data are mean ± SEM (n = 3 biological replicates). **: p value < 0.01. ***: p value < 0.001.
Extended Data Fig.3. FAK-SPARK visualizes FAK activity with spatiotemporal resolution by targeting active FAK into specific locations.
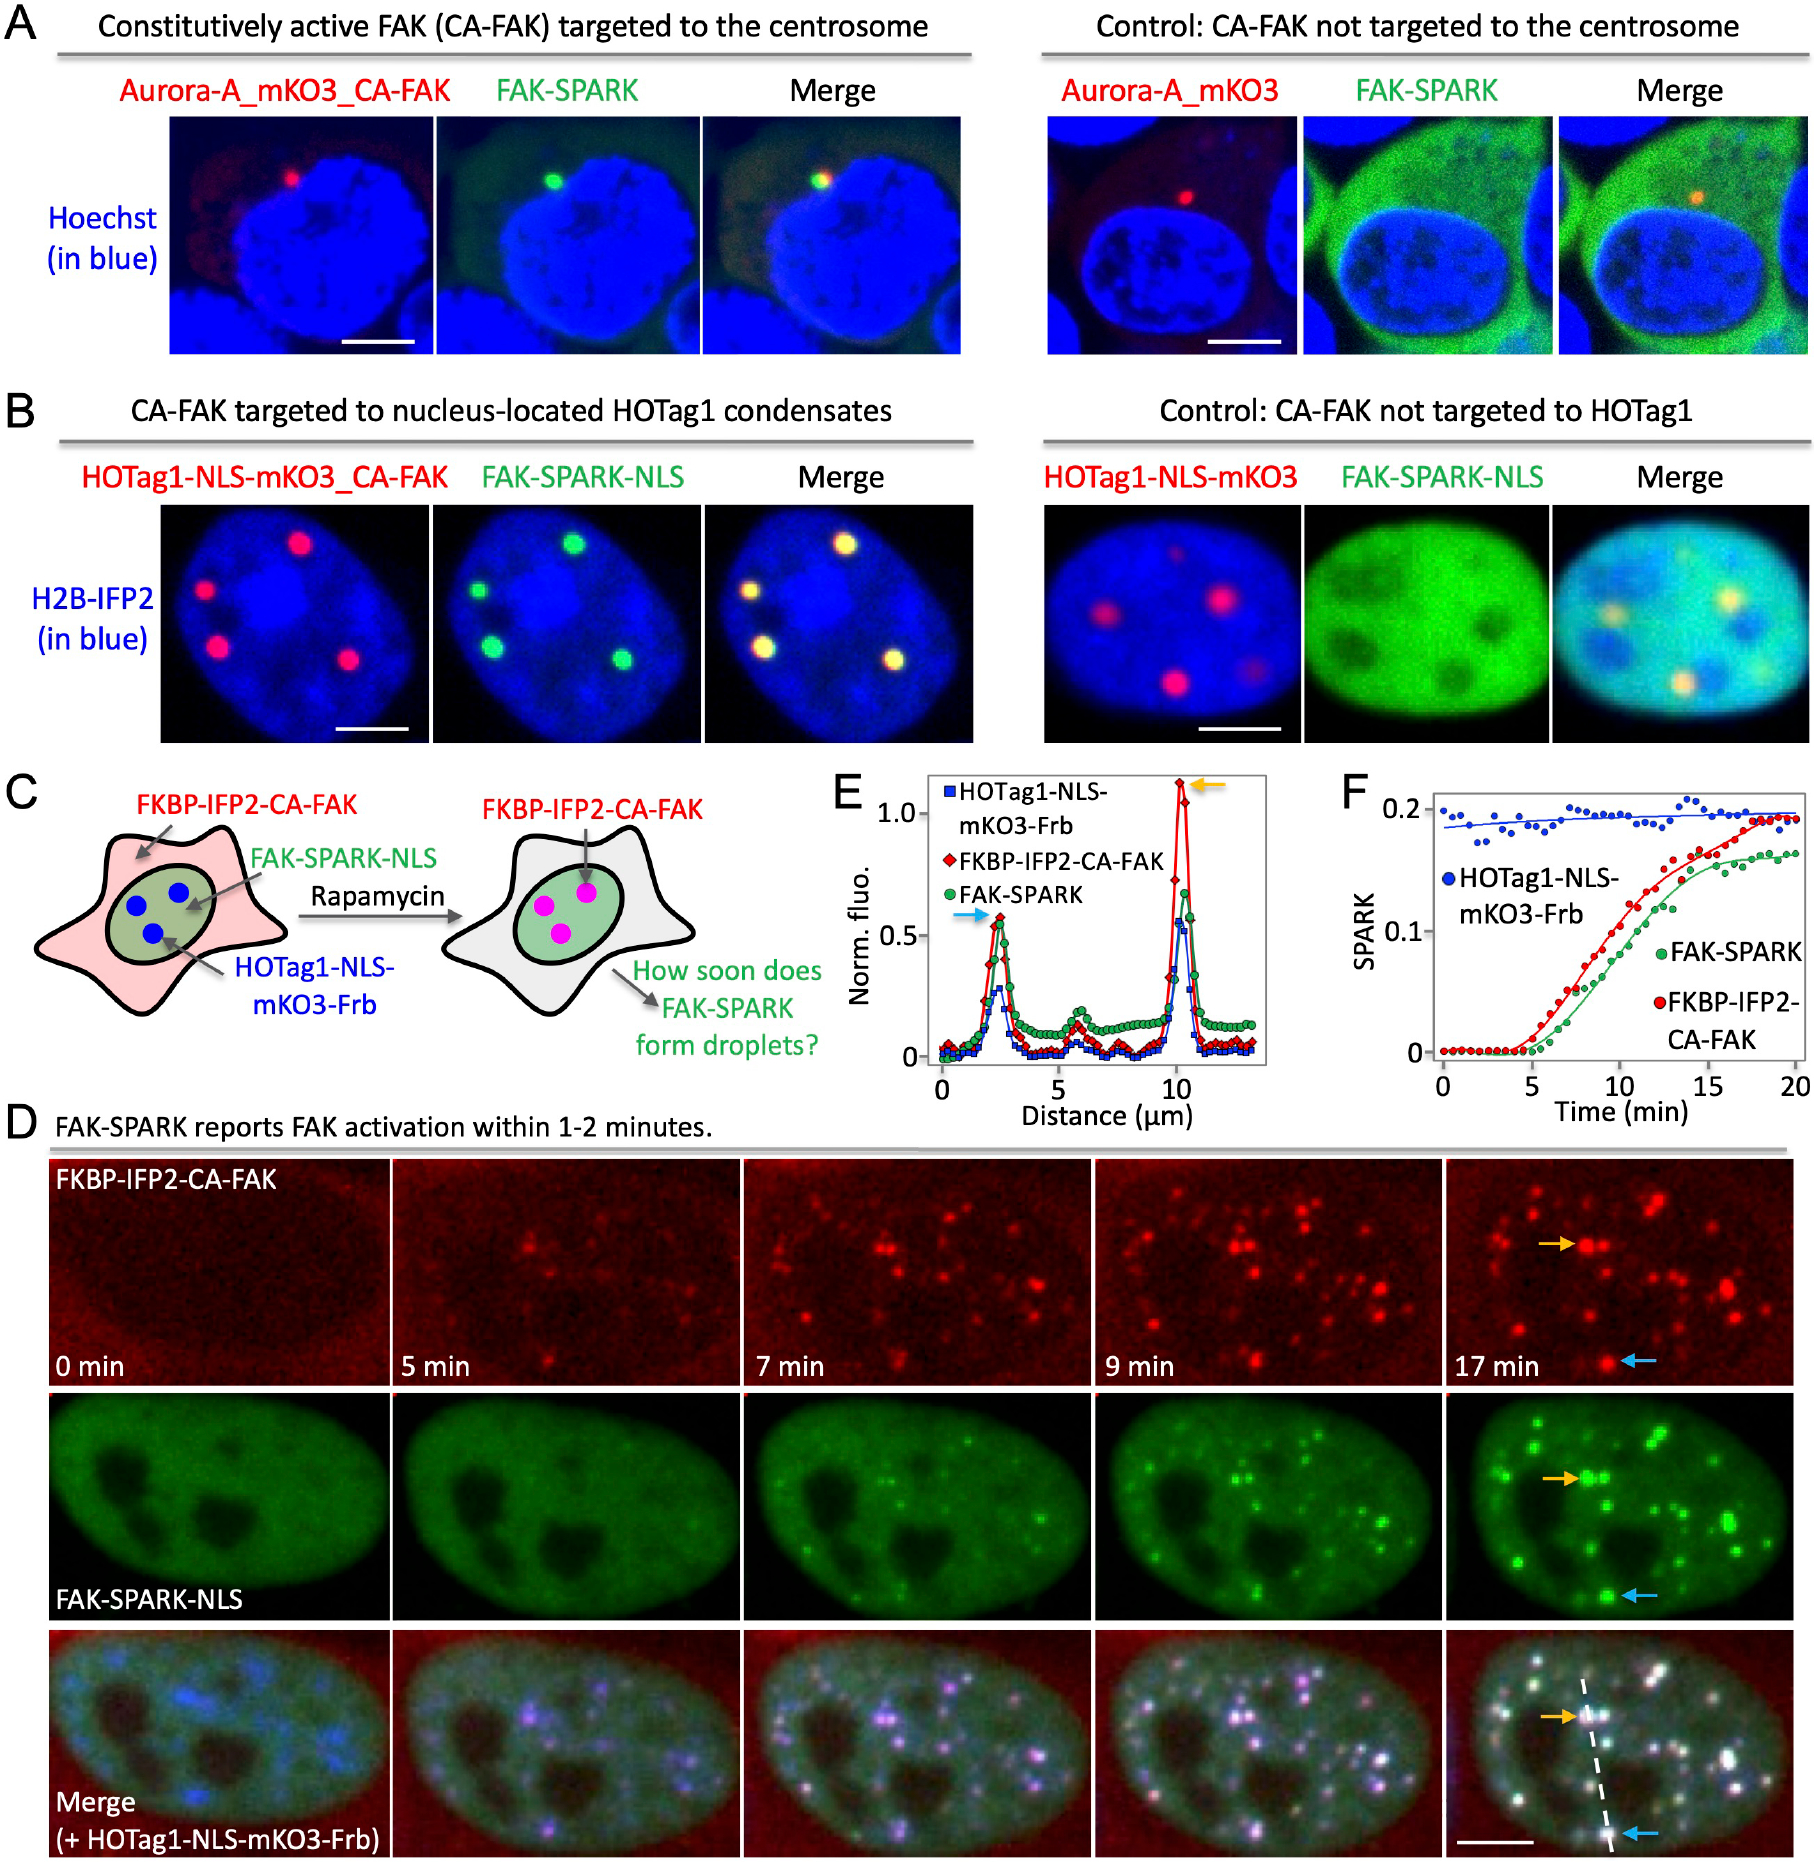
(A) Fluorescence images showing that FAK-SPARK visualizes FAK activity in the centrosome when constitutively active FAK (CA-FAK) is fused to aurora A kinase that is located in the centrosome (left panels). FAK activity is absent in the centrosome without CA-FAK (right panels). (B) Fluorescence images showing that nucleus-located FAK-SPARK-NLS (nuclear localization signal) visualizes FAK activity in the nuclear HOTag1 condensates that are tagged with CA-FAK (left panels). FAK activity is absent the CA-FAK-absent HOTag1 condensates. (C) Cartoon showing experimental procedure of measuring FAK-SPARK temporal resolution. (D) Time-lapse images after addition of rapamycin. (E) Normalized fluorescence along the dash line in (D). (F) Normalized SPARK signal over time. Scale bar, 5 μm (A, B, D).
Extended Data Fig.4. FAK-SPARK expression does not perturb dynamics of focal adhesion assembly and disassembly.
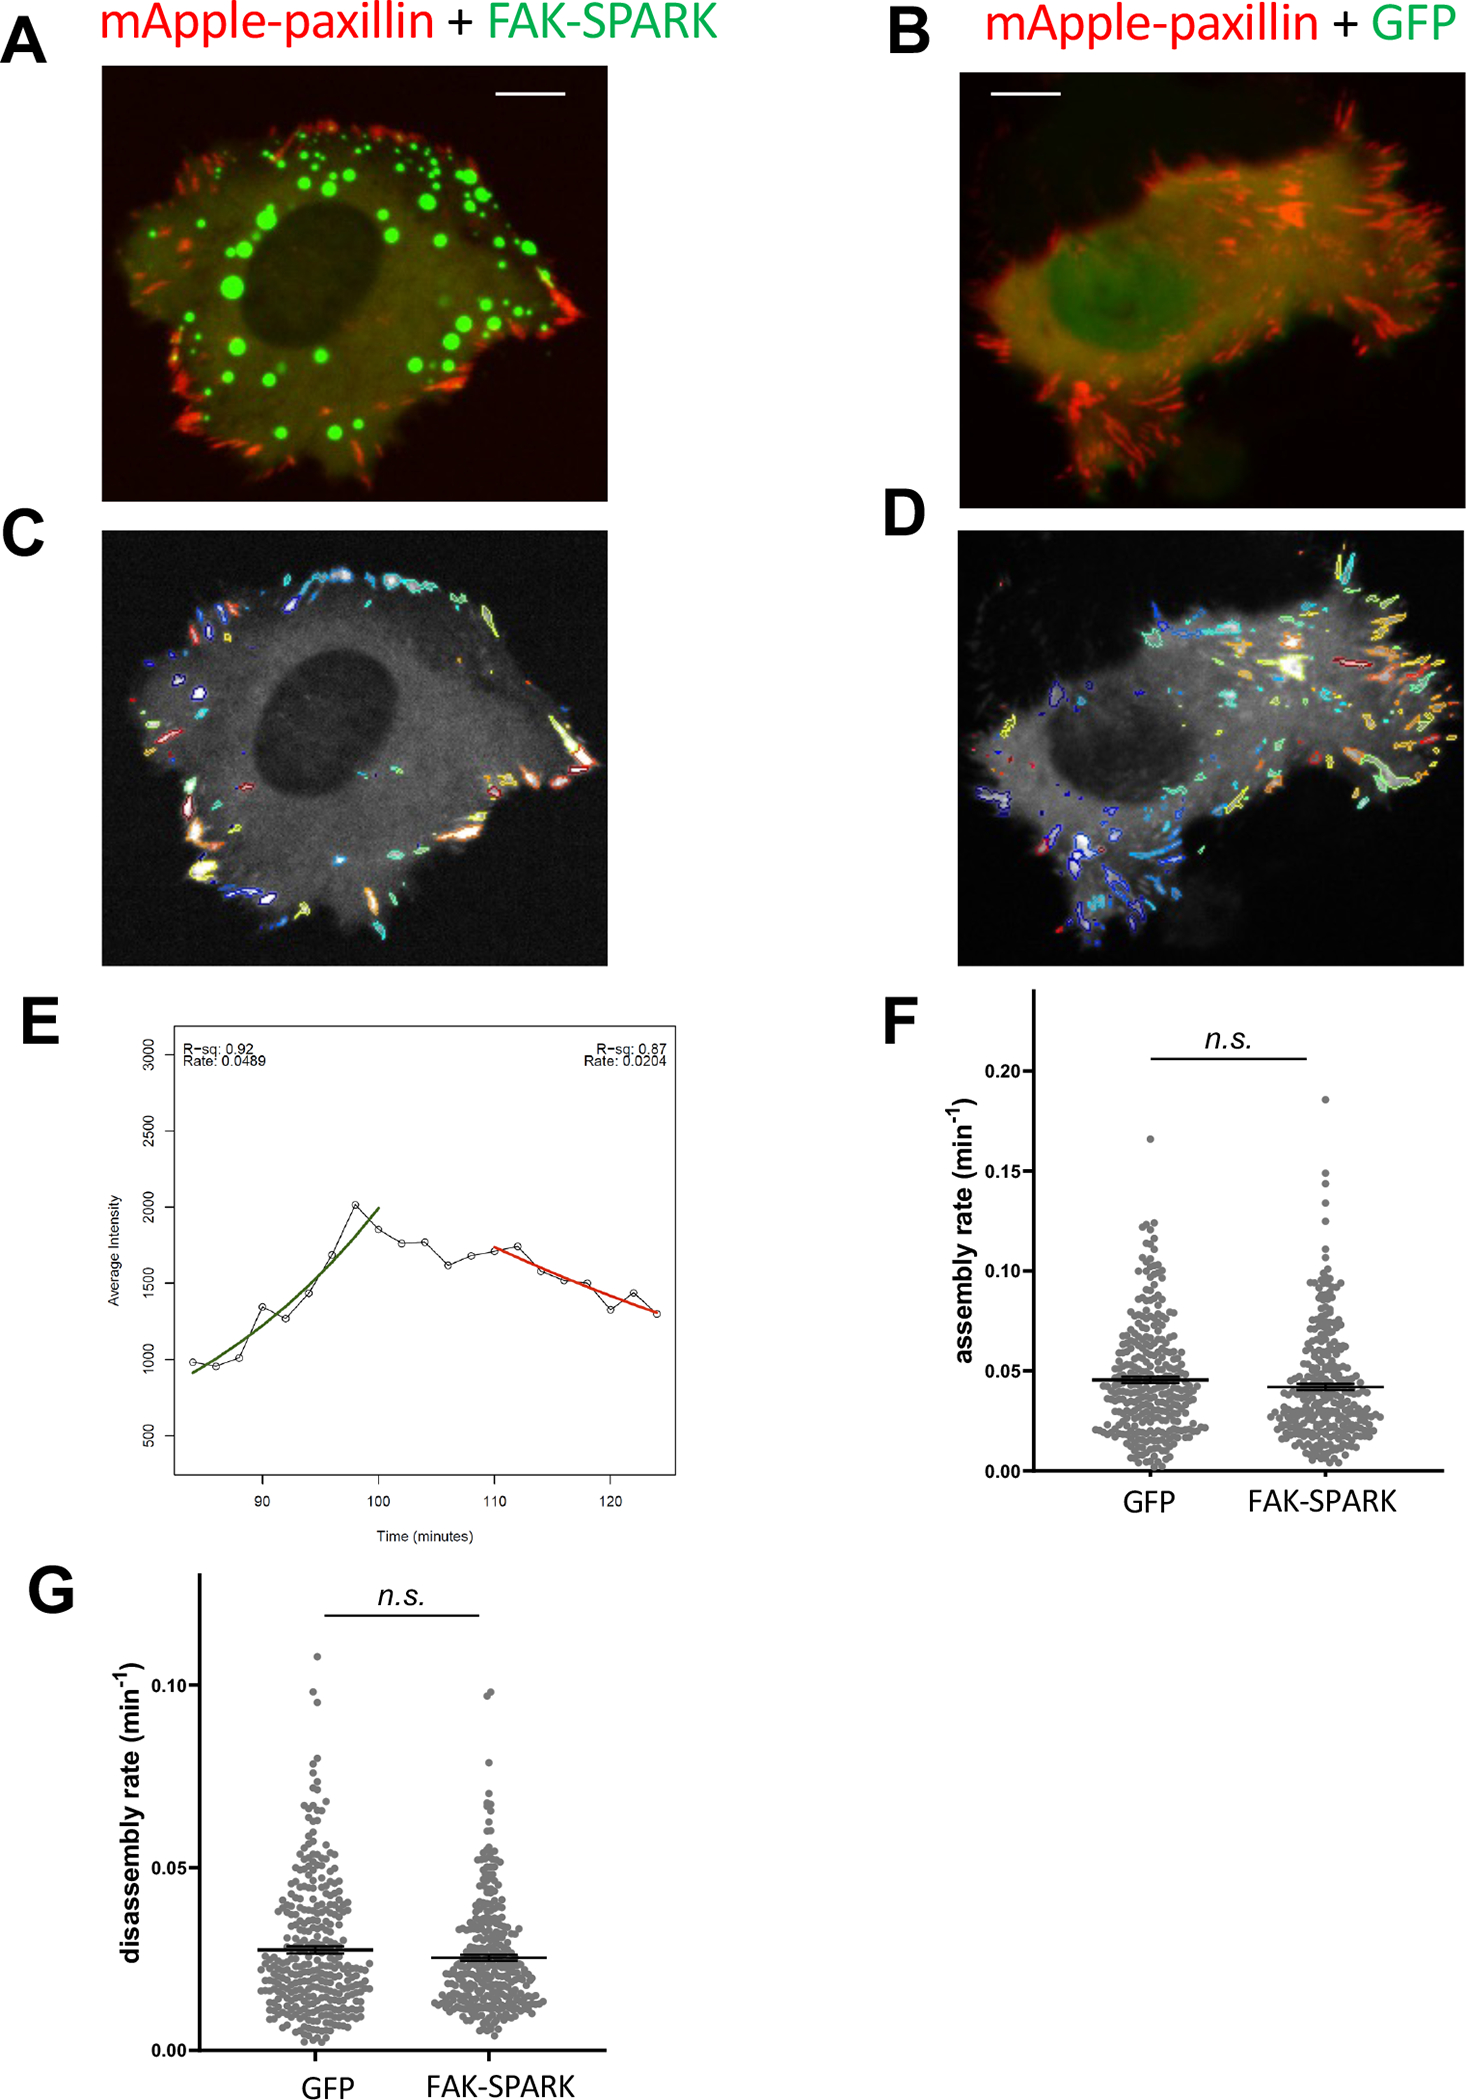
A & B, Representative images of HeLa cells expressing mApple-paxillin + FAK-SPARK and mApple-paxillin + GFP, respectively. C & D, Tracking of FAs using Focal Adhesion Analysis Server {Steenkiste:2021iv, Berginski:2013dj} in A & B. E, A typical trace of assembly and disassembly rate calculation. F & G, Assembly rate and disassembly rate in HeLa cells expressing FAK-SPARK or GFP. Data represent mean ± SE (n ~300 focal adhesions) n.s., not significant. Scale= 10 μm.
Extended Data Fig.5. FAK-SPARK expression does not perturb cell migration during wound healing using wound scratch assay.
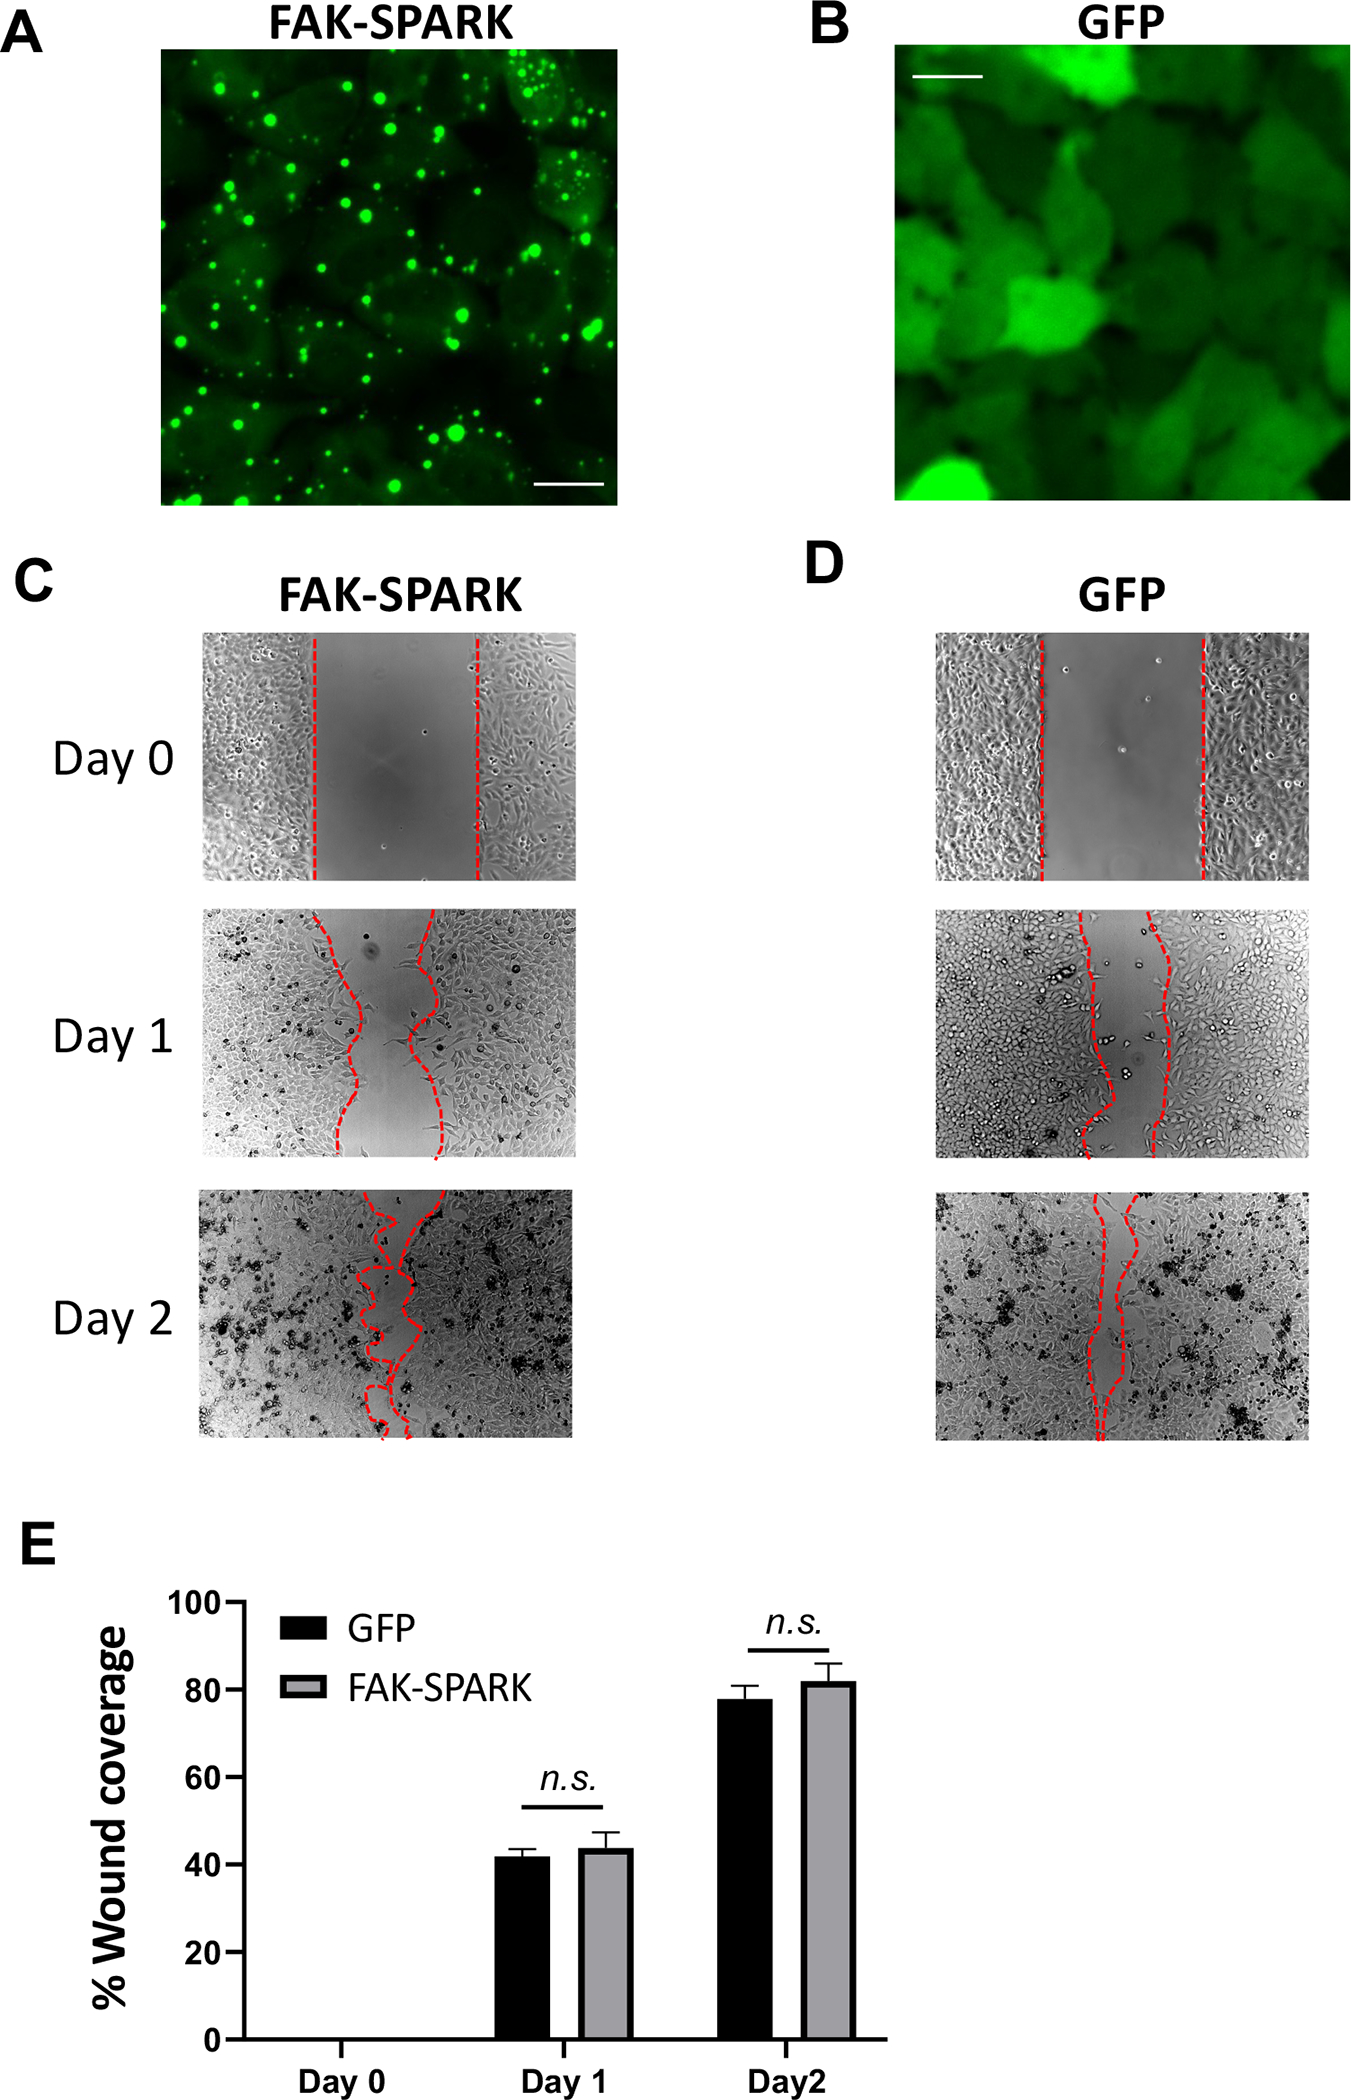
Wound was induced in HeLa cells expressing FAK-SPARK using a scratcher. A & B, Representative images of HeLa cells expressing FAK-SPARK or GFP, respectively. C & D, Typical images showing wound healing right after scratching (day 0), one day (day 1) and two days (day 2) after scratching. The red line marks cell boundary. E, Quantification of wound healing. Data represent mean ± SE (n=3) n.s., not significant. Scale bar, 20 μm.
Extended Data Fig.6. Integrin-ECM ligand tension precedes FAK activity.
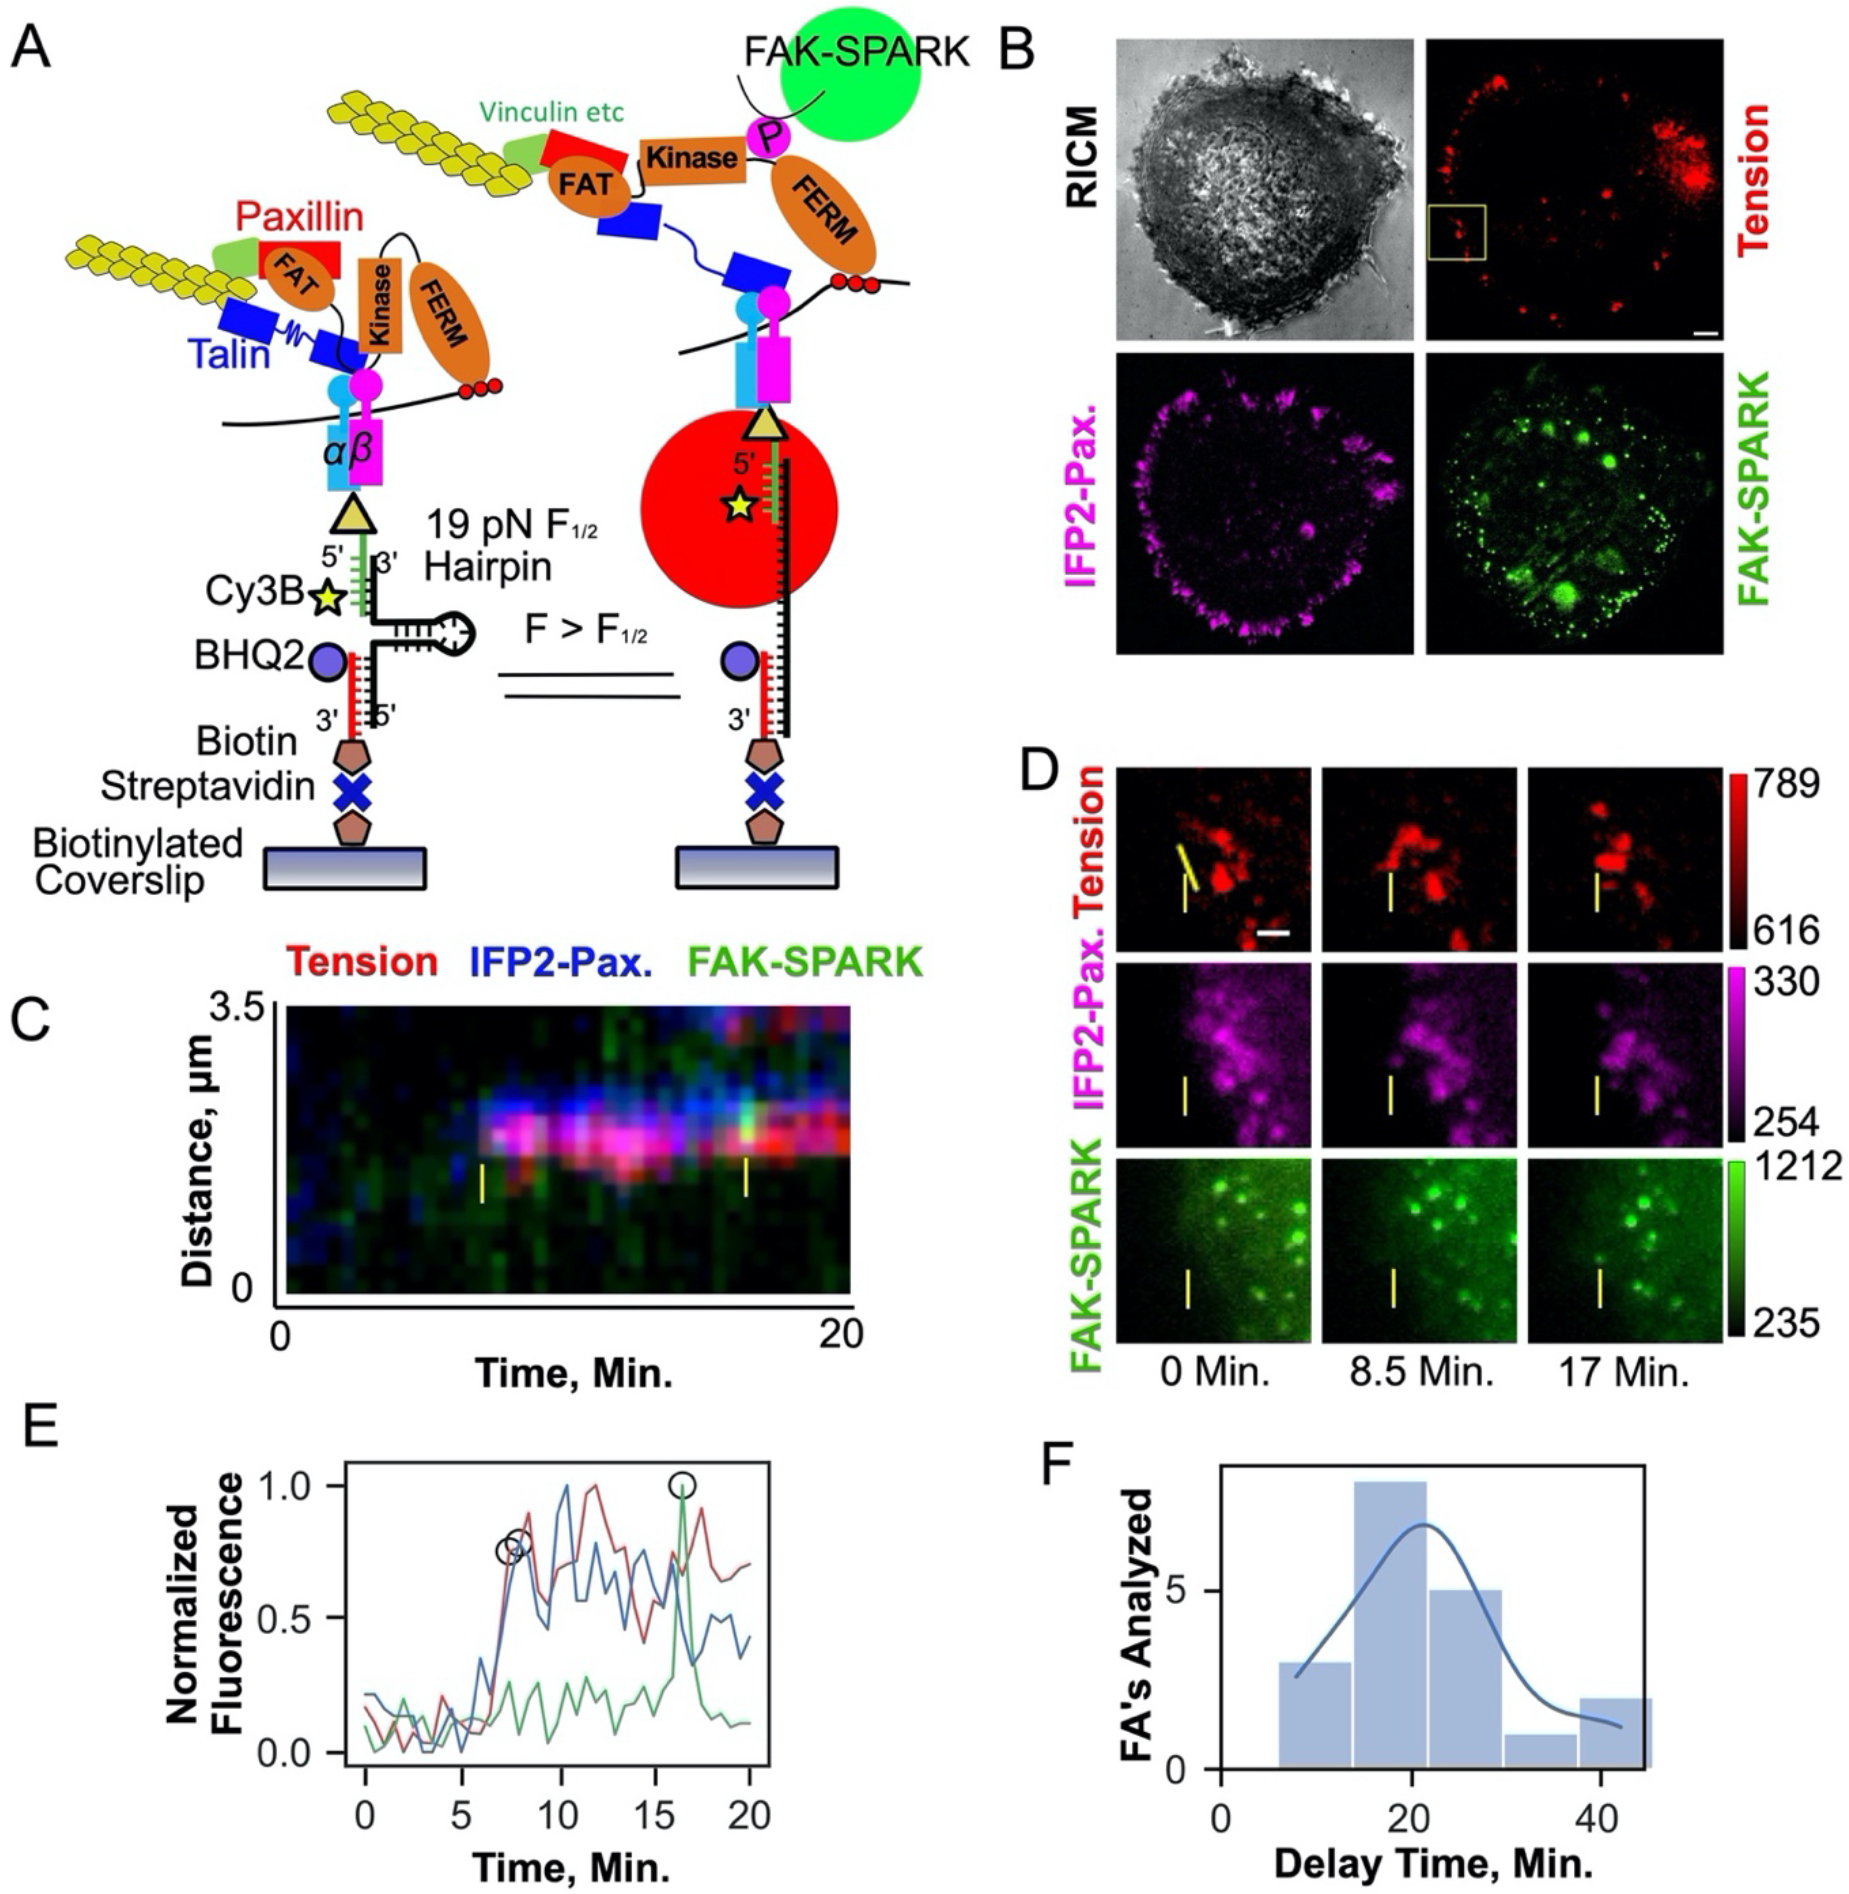
(A) Diagram of 19 pN DNA based MTFM probes and FAK-SPARK activation mechanism. (B) Representative cell RICM(grey) and fluorescence micrographs of 19 pN hairpin tension(red), IFP2-Paxillin(magenta), and FAK-SPARK(green) at t = 0.0 min. Scale bar, 5 μm. (C) Overlayed kymographs (yellow line in (D)) of tension, FAK-SPARK, and paxillin channels. Yellow arrows denote the point of tension and paxillin recruitment and FAK-SPARK droplet formation respectively. (D) Individual fluorescence micrographs of yellow inset in (b) at different timepoints, yellow dotted line denotes the linear ROI used for kymograph analysis in (c). Scale bar, 2 μm. (E) Plot of normalized maximum fluorescence over time derived from the kymograph, with threshold points used to derive the time delay denoted with black circles (Supplementary Methods 1). (F) Histogram of time delay measurements yielding 21.0 +/− 9.0 min average delay between 19 pN integrin tension and FAK-SPARK droplet formation. N=19 focal adhesions from 4 cells on 4 different surfaces (4 biological replicates).
Supplementary Material
Fig. 2. FAK-SPARK detects FAK activation during cell spreading and visualizes FAK activity within single focal adhesions after FA assembly.
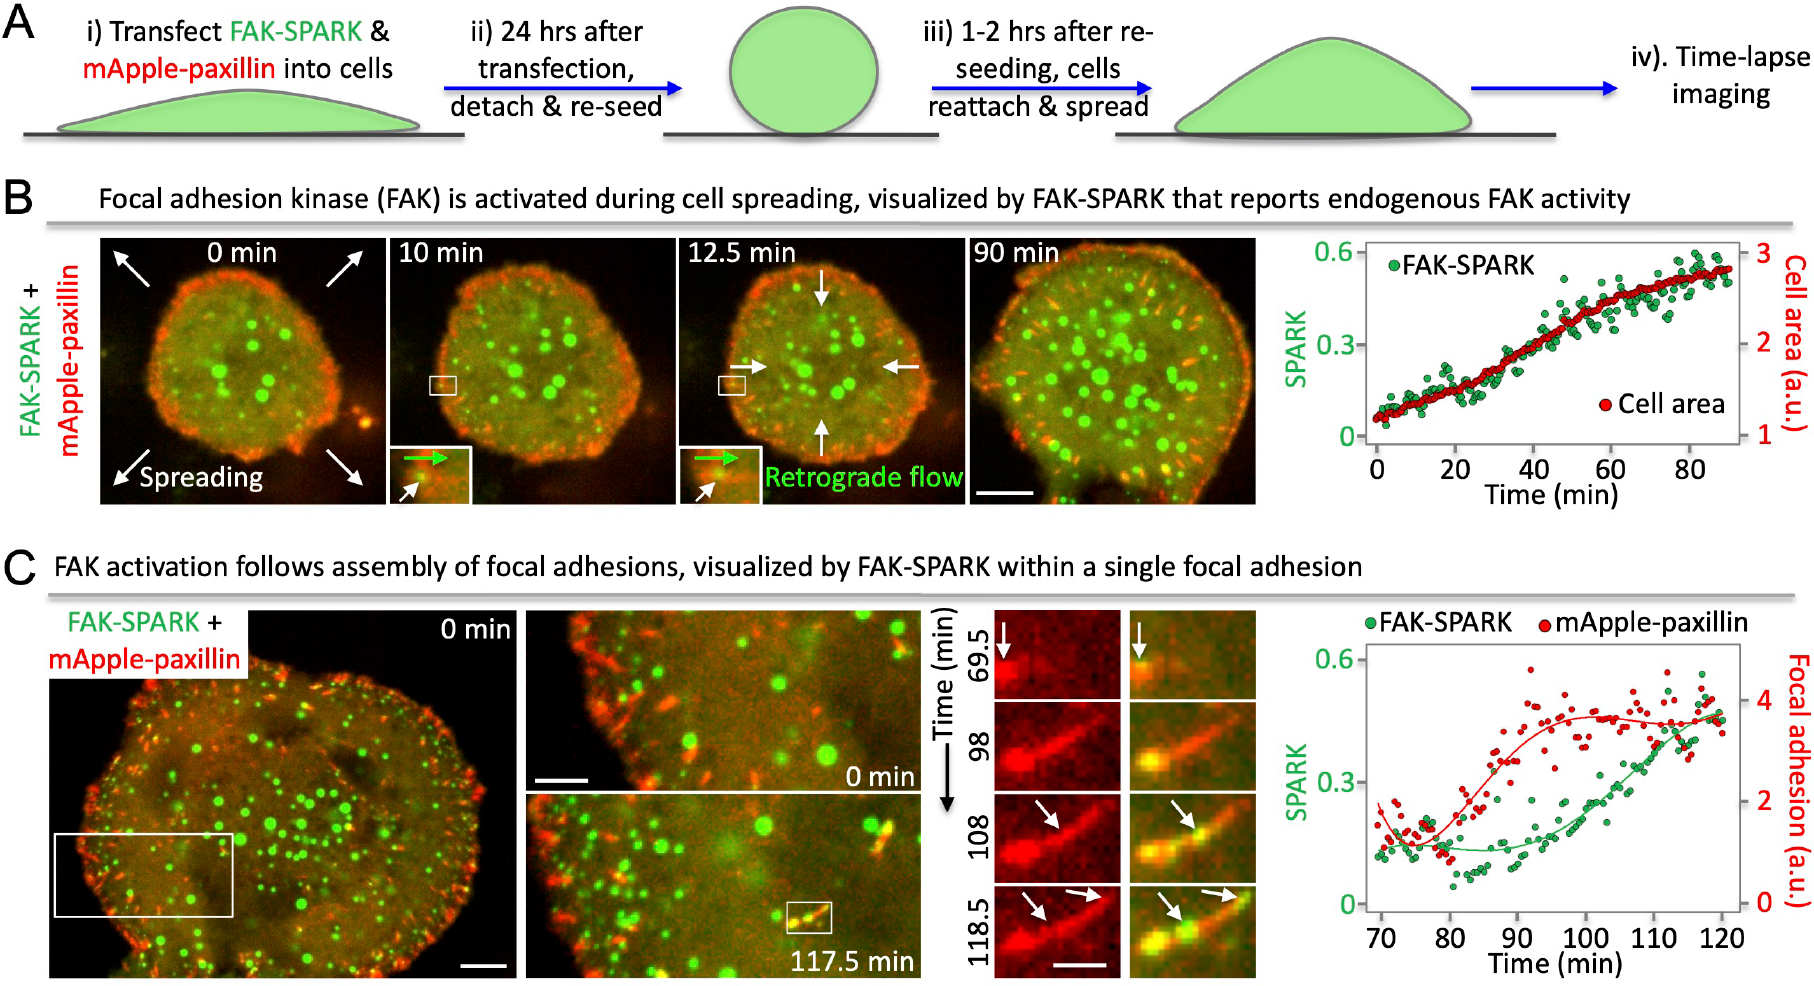
(A) Experimental procedure. (B) Left, time-lapse images during cell spreading. Right, normalized SPARK signal (green) and cell area (red) over time. (C) Left, time-lapse images during focal adhesion (FA) assembly and FAK activation within FAs (middle panels). Right, normalized SPARK signal and focal adhesion over time. Scale bar, (B) 10 μm; (C) Left, 10 μm; Middle, 5 μm; Right, 2 μm.
Acknowledgments:
We would like to thank Steven Narum for carrying out FLIM and analysis, Dr. William Weiss for sharing cell lines, William Degrado and Dean Sheppard for sharing integrin inhibitors and antibodies, Orion Weiner and Dean Sheppard for constructive comments.
Funding:
This work was supported by NIH NIGMS R35GM131766 to X.S., NIH NIGMS R01GM131099 and R01GM124472 to K.S.
Footnotes
Competing interests:
The authors declared no competing interest.
References
- 1.Kechagia JZ, Ivaska J & Roca-Cusachs P Integrins as biomechanical sensors of the microenvironment. Nat Rev Mol Cell Biol 1–17 (2019). doi: 10.1038/s41580-019-0134-2 [DOI] [PubMed] [Google Scholar]
- 2.Burridge K Focal adhesions: a personal perspective on a half century of progress. FEBS J 284, 3355–3361 (2017). [DOI] [PMC free article] [PubMed] [Google Scholar]
- 3.Mitra SK, Hanson DA & Schlaepfer DD Focal adhesion kinase: in command and control of cell motility. Nat Rev Mol Cell Biol 6, 56–68 (2005). [DOI] [PubMed] [Google Scholar]
- 4.Ilic D et al. Reduced cell motility and enhanced focal adhesion contact formation in cells from FAK-deficient mice. Nature 377, 539–544 (1995). [DOI] [PubMed] [Google Scholar]
- 5.Parsons JT, Horwitz AR & Schwartz MA Cell adhesion: integrating cytoskeletal dynamics and cellular tension. Nat Rev Mol Cell Biol 11, 633–643 (2010). [DOI] [PMC free article] [PubMed] [Google Scholar]
- 6.Seong J et al. Detection of focal adhesion kinase activationat membrane microdomains by fluorescenceresonance energy transfer. Nature Communications 2, 406–9 (2011). [DOI] [PMC free article] [PubMed] [Google Scholar]
- 7.Chung C-I, Zhang Q, Dynamic XS Imaging of Small Molecule Induced Protein–Protein Interactions in Living Cells with a Fluorophore Phase Transition Based Approach. Anal Chem 1–7 (2018). doi: 10.1021/acs.analchem.8b03476 [DOI] [PMC free article] [PubMed] [Google Scholar]
- 8.Zhang Q et al. Visualizing Dynamics of Cell Signaling In Vivo with a Phase Separation-Based Kinase Reporter. Mol Cell 69, 334–345.e5 (2018). [DOI] [PMC free article] [PubMed] [Google Scholar]
- 9.Schepis A et al. Protease signaling regulates apical cell extrusion, cell contacts, and proliferation in epithelia. J Cell Biol 217, 1097–1112 (2018). [DOI] [PMC free article] [PubMed] [Google Scholar]
- 10.Case LB & Waterman CM Integration of actin dynamics and cell adhesion by a three-dimensional, mechanosensitive molecular clutch. Nat Cell Biol 17, 955–963 (2015). [DOI] [PMC free article] [PubMed] [Google Scholar]
- 11.McGrath JL Cell Spreading: The Power to Simplify. Current Biology 17, R357–R358 (2007). [DOI] [PubMed] [Google Scholar]
- 12.Tomar A, Lim S-T, Lim Y & Schlaepfer DD A FAK-p120RasGAP-p190RhoGAP complex regulates polarity in migrating cells. Journal of Cell Science 122, 1852–1862 (2009). [DOI] [PMC free article] [PubMed] [Google Scholar]
- 13.Ezratty EJ, Partridge MA & Gundersen GG Microtubule-induced focal adhesion disassembly is mediated by dynamin and focal adhesion kinase. Nat Cell Biol 7, 581–590 (2005). [DOI] [PubMed] [Google Scholar]
- 14.Ballestrem C, Hinz B, Imhof BA & Wehrle-Haller B Marching at the front and dragging behind. J Cell Biol 155, 1319–1332 (2001). [DOI] [PMC free article] [PubMed] [Google Scholar]
- 15.Laukaitis CM, Webb DJ, Donais K & Horwitz AF Differential dynamics of alpha 5 integrin, paxillin, and alpha-actinin during formation and disassembly of adhesions in migrating cells. J Cell Biol 153, 1427–1440 (2001). [DOI] [PMC free article] [PubMed] [Google Scholar]
- 16.Gardel ML et al. Traction stress in focal adhesions correlates biphasically with actin retrograde flow speed. J Cell Biol 183, 999–1005 (2008). [DOI] [PMC free article] [PubMed] [Google Scholar]
- 17.Feliks M, Lafaye C, Shu X, Royant A & Field M Structural Determinants of Improved Fluorescence in a Family of Bacteriophytochrome-Based Infrared Fluorescent Proteins: Insights from Continuum Electrostatic Calculations and Molecular Dynamics Simulations. Biochemistry 55, 4263–4274 (2016). [DOI] [PubMed] [Google Scholar]
- 18.Yu D et al. Rational design of a monomeric and photostable far-red fluorescent protein for fluorescence imaging in vivo. Protein Science 25, n/a–n/a (2015). [DOI] [PMC free article] [PubMed] [Google Scholar]
- 19.Yu D et al. An improved monomeric infrared fluorescent protein for neuronal and tumour brain imaging. Nature Communications 5, (2014). [DOI] [PMC free article] [PubMed] [Google Scholar]
- 20.Le Coq J, Acebrón I, Rodrigo Martin B, López Navajas P & Lietha D New insights into FAK structure and function in focal adhesions. Journal of Cell Science 135, (2022). [DOI] [PubMed] [Google Scholar]
- 21.Swaminathan V, Fischer RS & Waterman CM The FAK-Arp2/3 interaction promotes leading edge advance and haptosensing by coupling nascent adhesions to lamellipodia actin. Mol Biol Cell 27, 1085–1100 (2016). [DOI] [PMC free article] [PubMed] [Google Scholar]
- 22.Serrels B et al. Focal adhesion kinase controls actin assembly via a FERM-mediated interaction with the Arp2/3 complex. Nat Cell Biol 9, 1046–1056 (2007). [DOI] [PubMed] [Google Scholar]
- 23.Goñi GM et al. Phosphatidylinositol 4,5-bisphosphate triggers activation of focal adhesion kinase by inducing clustering and conformational changes. Proceedings of the National Academy of Sciences 111, E3177–86 (2014). [DOI] [PMC free article] [PubMed] [Google Scholar]
- 24.Seong J et al. Distinct biophysical mechanisms of focal adhesion kinase mechanoactivation by different extracellular matrix proteins. Proc Natl Acad Sci USA 110, 19372–19377 (2013). [DOI] [PMC free article] [PubMed] [Google Scholar]
- 25.Orgovan N et al. Dependence of cancer cell adhesion kinetics on integrin ligand surface density measured by a high-throughput label-free resonant waveguide grating biosensor. Sci. Rep. 4, 1216–8 (2014). [DOI] [PMC free article] [PubMed] [Google Scholar]
- 26.Sundaram A et al. Targeting integrin α5β1 ameliorates severe airway hyperresponsiveness in experimental asthma. J Clin Invest 127, 365–374 (2017). [DOI] [PMC free article] [PubMed] [Google Scholar]
- 27.Pasapera AM, Schneider IC, Rericha E, Schlaepfer DD & Waterman CM Myosin II activity regulates vinculin recruitment to focal adhesions through FAK-mediated paxillin phosphorylation. J Cell Biol 188, 877–890 (2010). [DOI] [PMC free article] [PubMed] [Google Scholar]
- 28.Labouesse C, Verkhovsky AB, Meister J-J, Gabella C & Vianay B Cell Shape Dynamics Reveal Balance of Elasticity and Contractility in Peripheral Arcs. Biophysj 108, 2437–2447 (2015). [DOI] [PMC free article] [PubMed] [Google Scholar]
- 29.Petridou NI, Stylianou P & Skourides PA A dominant-negative provides new insights into FAK regulation and function in early embryonic morphogenesis. Development 140, 4266–4276 (2013). [DOI] [PubMed] [Google Scholar]
- 30.Zheng Y et al. FAK Phosphorylation by ERK Primes Ras-Induced Tyrosine Dephosphorylation of FAK Mediated by PIN1 and PTP-PEST. Mol Cell 35, 11–25 (2009). [DOI] [PMC free article] [PubMed] [Google Scholar]
- 31.Rashid SA et al. DNA Tension Probes Show that Cardiomyocyte Maturation Is Sensitive to the Piconewton Traction Forces Transmitted by Integrins. ACS Nano (2022). doi: 10.1021/acsnano.1c04303 [DOI] [PMC free article] [PubMed] [Google Scholar]
- 32.Pérez LA et al. An Outside-In Switch in Integrin Signaling Caused by Chemical and Mechanical Signals in Reactive Astrocytes. Front. Cell Dev. Biol. 9, 712627 (2021). [DOI] [PMC free article] [PubMed] [Google Scholar]
- 33.Jo MH, Cottle WT & Ha T Real-Time Measurement of Molecular Tension during Cell Adhesion and Migration Using Multiplexed Differential Analysis of Tension Gauge Tethers. ACS Biomater Sci Eng 5, 3856–3863 (2019). [DOI] [PubMed] [Google Scholar]
- 34.Wang X & Ha T Defining Single Molecular Forces Required to Activate Integrin and Notch Signaling. Science 340, 991–994 (2013). [DOI] [PMC free article] [PubMed] [Google Scholar]
- 35.Ritt M, Guan J-L & Sivaramakrishnan S Visualizing and Manipulating Focal Adhesion Kinase Regulation in Live Cells*. J Biol Chem 288, 8875–8886 (2013). [DOI] [PMC free article] [PubMed] [Google Scholar]
- 36.Cai X et al. Spatial and temporal regulation of focal adhesion kinase activity in living cells. Mol. Cell. Biol. 28, 201–214 (2008). [DOI] [PMC free article] [PubMed] [Google Scholar]
- 37.Li X et al. ATM-SPARK: A GFP phase separation-based activity reporter of ATM. Sci Adv 9, eade3760 (2023). [DOI] [PMC free article] [PubMed] [Google Scholar]
- 38.Shu X Imaging dynamic cell signaling in vivo with new classes of fluorescent reporters. Current opinion in chemical biology 54, 1–9 (2020). [DOI] [PMC free article] [PubMed] [Google Scholar]
- 39.Wakatsuki T, Wysolmerski RB & Elson EL Mechanics of cell spreading: Role of myosin II. Journal of Cell Science 116, 1617–1625 (2003). [DOI] [PubMed] [Google Scholar]
- 40.Bell S & Terentjev EM Focal Adhesion Kinase: The Reversible Molecular Mechanosensor. Biophysj 112, 2439–2450 (2017). [DOI] [PMC free article] [PubMed] [Google Scholar]
- 41.Zhou J et al. Mechanism of Focal Adhesion Kinase Mechanosensing. PLoS Comput Biol 11, e1004593–16 (2015). [DOI] [PMC free article] [PubMed] [Google Scholar]
- 42.Zhou J, Bronowska A, Le Coq J, Lietha D & Gräter F Allosteric Regulation of Focal Adhesion Kinase by PIP2 and ATP. Biophysj 108, 698–705 (2015). [DOI] [PMC free article] [PubMed] [Google Scholar]
- 43.Plotnikov SV, Pasapera AM, Sabass B & Waterman CM Force Fluctuations within Focal Adhesions Mediate ECM-Rigidity Sensing to Guide Directed Cell Migration. Cell 151, 1513–1527 (2012). [DOI] [PMC free article] [PubMed] [Google Scholar]
- 44.Pollard TD & Cooper JA Actin, a Central Player in Cell Shape and Movement. Science 326, 1208–1212 (2009). [DOI] [PMC free article] [PubMed] [Google Scholar]
- 45.Stutchbury B, Atherton P, Tsang R, Wang D-Y & Ballestrem C Distinct focal adhesion protein modules control different aspects of mechanotransduction. Journal of Cell Science 130, 1612–1624 (2017). [DOI] [PMC free article] [PubMed] [Google Scholar]
- 46.Acebrón I et al. Structural basis of Focal Adhesion Kinase activation on lipid membranes. EMBO J 39, e104743 (2020). [DOI] [PMC free article] [PubMed] [Google Scholar]
- 47.Seong J et al. Distinct biophysical mechanisms of focal adhesion kinase mechanoactivation by different extracellular matrix proteins. Proceedings of the National Academy of Sciences 110, 19372–19377 (2013). [DOI] [PMC free article] [PubMed] [Google Scholar]
- 48.Panagiotakopoulou M et al. Cell cycle-dependent force transmission in cancer cells. Mol Biol Cell 29, 2528–2539 (2018). [DOI] [PMC free article] [PubMed] [Google Scholar]
- 49.Bauer MS et al. Structural and mechanistic insights into mechanoactivation of focal adhesion kinase. Proceedings of the National Academy of Sciences 116, 6766–6774 (2019). [DOI] [PMC free article] [PubMed] [Google Scholar]
- 50.Zhou DW et al. Force-FAK signaling coupling at individual focal adhesions coordinates mechanosensing and microtissue repair. Nature Communications 1–13 (2021). doi: 10.1038/s41467-021-22602-5 [DOI] [PMC free article] [PubMed] [Google Scholar]
References
- 51.Chung C-I, Zhang Q, Dynamic XS Imaging of Small Molecule Induced Protein–Protein Interactions in Living Cells with a Fluorophore Phase Transition Based Approach. Anal Chem 1–7 (2018). doi: 10.1021/acs.analchem.8b03476 [DOI] [PMC free article] [PubMed] [Google Scholar]
- 52.Zhang Q et al. Visualizing Dynamics of Cell Signaling In Vivo with a Phase Separation-Based Kinase Reporter. Mol Cell 69, 334–345.e5 (2018). [DOI] [PMC free article] [PubMed] [Google Scholar]
- 53.Hail ME, Elliott B & Anderson K High-throughput analysis of oligonucleotides using automated electrospray ionization mass spectrometry. American Biotechnology Laboratory 12–14 (2004). [Google Scholar]
- 54.Zhang Y, Ge C, Zhu C & Salaita K DNA-based digital tension probes reveal integrin forces during early cell adhesion. Nature Communications 5, 5167–10 (2014). [DOI] [PMC free article] [PubMed] [Google Scholar]
- 55.Blanchard A et al. Turn-key mapping of cell receptor force orientation and magnitude using a commercial structured illumination microscope. Nature Communications 1–15 (2021). doi: 10.1038/s41467-021-24602-x [DOI] [PMC free article] [PubMed] [Google Scholar]
- 56.Liu Y, Galior K, Ma VP-Y & Salaita K Molecular Tension Probes for Imaging Forces at the Cell Surface. Acc. Chem. Res. 50, 2915–2924 (2017). [DOI] [PMC free article] [PubMed] [Google Scholar]
- 57.Pérez LA et al. An Outside-In Switch in Integrin Signaling Caused by Chemical and Mechanical Signals in Reactive Astrocytes. Front. Cell Dev. Biol. 9, 712627 (2021). [DOI] [PMC free article] [PubMed] [Google Scholar]
- 58.Gidi Y, Bayram S, Ablenas CJ, Blum AS & Cosa G Efficient One-Step PEG-Silane Passivation of Glass Surfaces for Single-Molecule Fluorescence Studies. ACS Appl Mater Interfaces 10, 39505–39511 (2018). [DOI] [PubMed] [Google Scholar]
- 59.Woodside MT et al. Nanomechanical measurements of the sequence-dependent folding landscapes of single nucleic acid hairpins. Proc Natl Acad Sci USA 103, 6190–6195 (2006). [DOI] [PMC free article] [PubMed] [Google Scholar]
- 60.Preibisch S, Saalfeld S, Schindelin J & Tomancak P Software for bead-based registration of selective plane illumination microscopy data. Nat Meth 1–2 (2010). doi: 10.1038/nmeth0610-418 [DOI] [PubMed] [Google Scholar]
Associated Data
This section collects any data citations, data availability statements, or supplementary materials included in this article.


