

ABSTRACT
Pancreatic adenocarcinomas (PDAC) often possess mutations in K-Ras that stimulate the ERK pathway. Aberrantly high ERK activation triggers oncogene-induced senescence, which halts tumor progression. Here we report that low-grade pancreatic intraepithelial neoplasia displays very high levels of phospho-ERK consistent with a senescence response. However, advanced lesions that have circumvented the senescence barrier exhibit lower phospho-ERK levels. Restoring ERK hyperactivation in PDAC using activated RAF leads to ERK-dependent growth arrest with senescence biomarkers. ERK-dependent senescence in PDAC was characterized by a nucleolar stress response including a selective depletion of nucleolar phosphoproteins and intranucleolar foci containing RNA polymerase I designated as senescence-associated nucleolar foci (SANF). Accordingly, combining ribosome biogenesis inhibitors with ERK hyperactivation reinforced the senescence response in PDAC cells. Notably, comparable mechanisms were observed upon treatment with the platinum-based chemotherapy regimen FOLFIRINOX, currently a first-line treatment option for PDAC. We thus suggest that drugs targeting ribosome biogenesis can improve the senescence anticancer response in pancreatic cancer.
Keywords: ribosome biogenesis, nucleolus, therapy-induced senescence, pancreatic cancer, folfirinox, MAP kinase
Introduction
The extracellular signal-regulated kinases ERK1 and ERK2 transmit signals from a variety of cellular receptors activated by growth factors, cytokines, hormones, and other extracellular ligands [1]. The intensity of ERK activation downstream of oncogenic signaling controls the decision between proliferation, senescence, and apoptosis [2–6]. The mechanisms that translate signal intensity into different biological responses are not well understood. During oncogene-induced senescence in normal human fibroblasts, highly aberrant ERK activity was linked to proteasome-dependent degradation of several proteins required for cell cycle progression and ribosome biogenesis [1,3,7]. High ERK activity was responsible for cell death after RAF inhibitor withdrawal in melanoma cells [8] or metabolic stress induced by lack of glucose in HEK293 cells [9]. Thus, several potential mechanisms are acting downstream high ERK signaling that can halt tumor progression.
The ERK pathway is often aberrantly activated by oncogenes in human cancers [1]. Expression of mutant KRAS in mouse pancreatic epithelial cells induces pancreatic intraepithelial neoplasia (PanIN) [10,11] a lesion that contains senescent cells [12]. Cell lines established from PanIN also express senescence markers and are not tumorigenic [13]. These results are consistent with the idea that PanIN cells undergo oncogene-induced senescence (OIS) in vivo, which halts malignant progression [13]. However, some PanIN lesions eventually progress to pancreatic ductal adenocarcinomas (PDAC). Here, we report that during pancreatic cancer progression both in humans and mice, PanIN lesions have the highest levels of ERK activity and that progression to malignancy correlates with phospho-ERK downregulation. Restoring high ERK signaling in malignant cells forced tumor cells into a senescent cell cycle arrest characterized by phosphoproteome alterations involving nucleolar proteins. In addition, several nucleolar proteins lose their normal localization and form ERK-dependent intranucleolar foci. This ERK-dependent nucleolar phenotype causes sensitization to agents that affect ribosome biogenesis. Intriguingly, we show that the drug combination FOLFIRINOX (FOLinic acid, Fluorouracil, IRInotecan, OXaliplatin) which is a first-line chemotherapy regimen for pancreatic cancer [14], activates ERK and inhibits ribosome biogenesis. Together, we provide a molecular mechanism effective to halt pancreatic cancer progression.
Results
Downregulation of ERK signaling correlates with the progression of human and mouse pancreatic cancer
KRAS-driven pancreatic cancer pathogenesis consists of sequential premalignant steps leading to invasive pancreatic ductal adenocarcinoma (PDAC) [15]. Data from mouse models indicate that PDAC emerges from the conversion of differentiated acinar cells to immature duct-like cells (acinar-to-ductal metaplasia (ADM)), followed by progressive pancreatic intraepithelial neoplasia grade 1 to 3 (PanIN-1 to 3). While ERK is activated downstream of oncogenic KRAS, the established role of ERK inhibition in subverting differentiation decisions and escape from senescence [1] led to speculation that there may be additional modulation of this pathway to facilitate PDAC progression. To better define the role of ERK signaling in pancreatic cancer pathogenesis, we assessed ERK activation status by immunohistochemistry in a set of human specimens (from 16 patients) representing each of these different stages of tumor progression. We found that p-ERK levels are modestly increased in ADM and the tissue adjacent to the tumor. This is consistent with a proposed role for ERK activation in the dedifferentiation of acinar cells during ADM [16]. P-ERK levels were dramatically increased in PanIN-1 and remained almost as high in PanIN-2, whereas they decreased significantly in PanIN-3 and PDAC. Notably, p-ERK levels correlated inversely with proliferation measured by staining for Ki-67, with the strongly p-ERK-positive PanIN-1 lesions showing minimal proliferation compared to the p-ERK-low PanIN-3/PDAC lesions (Figure 1a and S1a). Remarkably, in sections where both PanIN-1 or PanIN2 were close to PanIN-3 lesions, we can see that higher p-ERK levels associated with the most benign lesions (Figure 1b) quantified in Figure 1(c-d). PanIN-1 lesions are common in the general population and have a low risk of progression, whereas PanIN-3 are equivalent to carcinoma-in-situ and are invariably associated with the development of invasive PDAC [17,18]. Thus, our results link attenuation of the ERK pathway to malignant progression in pancreatic cancer. Notably, the Pdx1-Cre; LSL-KRasG12D p53Lox/+ mouse model of PDAC progression [11,19] exhibited an identical profile of p-Erk activation and Ki-67 staining (Figure 2a-c and S1b).
Figure 1.

Decreased p-ERK levels correlate with the progression of human pancreatic cancer. (a), immunohistochemistry of p-ERK and KI-67 of human adjacent pancreas and different grades of pancreatic neoplasms. Insets: ADM, acinar-to-ductal metaplasia; PanIN-1 to 3 (P1–3), pancreatic intraepithelial lesions (grades 1 to 3); PDAC, pancreatic ductal adenocarcinoma; H&E, hematoxylin, and eosin; BV, blood vessel; AC, acinar cells; D, normal duct; A, ADM. Black arrows, adjacent ducts; white arrows, acinar cells; scale bars = 100 µm. (b) staining as in (a), but fields showing two different types of pancreatic lesions. (c) quantification of KI-67-positive epithelial cells in (a). Data are presented as the average percentage of positive cells ± SD, n = 16 patients; two-tailed Student t-test. (d) quantification of p-ERK staining of epithelial cells in (a) according to four intensities of staining (none, 0; low, 1; moderate, 2; high, 3). The average percentage of cells for each staining intensity is shown. Patients as in (c); PanIN-1 vs ADM P < 0.0001, PanIN-3 vs PanIN-2 P = 0.0201, PanIN-3 vs PanIN-1 P < 0.0001, PDAC vs PanIN-1 P < 0.0001, two-tailed Student t-test. See also supplemental Figure S1.
Figure 2.

Decreased p-ERK levels correlate with tumor initiation in a KRas-driven mouse model of pancreatic cancer. (a) immunohistochemistry of p-Erk and Ki-67 of pancreatic tissues from Pdx1-Cre;LSL-KRasG12D mice. Normal pancreatic tissues, pancreatic intraepithelial lesions (PanIN; grades 1 to 3), and PDAC are shown. Insets: higher magnification of representative regions. PC, pancreatic cancer; black arrows, normal ducts; white arrows, acinar cells; scale bars = 100 µm. (b) quantification of Ki-67-positive epithelial cells in (a). Data are presented as the average percentage of positive cells ± SD, n = 14 mice; P compared to PanIN-1, two-tailed Student t-test. (c) quantification of p-Erk staining of epithelial cells in (a) according to four intensities of staining (none, 0; low, 1; moderate, 2; high, 3). The average percentage of cells for each staining intensity is shown. Mice as in b; PanIN-1 vs ADM P < 0.0001, PanIN-2 vs PanIN-1 P = 0.0106, PanIN-3 vs PanIN-1 P = 0.0022, PDAC vs PanIN-1 P < 0.0001, two-tailed Student t-test. (d) Immunoblots for the indicated proteins in cell lines established from the Pdx1-Cre; LSL-KRasG12D mouse model in (a): PanIN-1 (1497 to 1499) vs PDAC (AH375). The NB508 PDAC cell line was established from the Pdx1-Cre; LSL-KrasG12D;p53Lox/+;p16± mouse model. P-c-raf, c-raf phosphoserine 338; p-Mek1/2, Mek1/2 phosphoserine 217/221; p-Erk1/2, Erk 1 (p44, upper band) and 2 (p42, lower band) phosphothreonine 202 and phosphotyrosine 204, n = 3. (e-f) RNA from 1499 and AH375 cells were collected for microarray gene expression analysis (GEO accession number: GSE57566). Gene set enrichment analysis (GSEA) revealed a gene expression signature of (e) RAF activation in 1499 cells (RAF_UP.V1_UP; M2728) and (f) MEK activation in 1499 cells (MEK_UP.V1_UP; M2725), n = 3 biological replicates. See also supplemental Figure S1b-S2.
To study the functional roles of ERK in PDAC pathogenesis, we established pancreatic epithelial cell lines from Pdx1-Cre; LSL-KRasG12D mice harboring ADM/PanIN-1 lesions or advanced PDAC [13]. Notably, the ADM/PanIN-1 lines showed considerably higher levels of p-Erk (Figure 2d) and of transcriptional targets of the ERK pathway as compared to the PDAC-derived tumorigenic cell lines (Figure 2e-f and S2a-b). We also measured phospho-ERK levels in several human pancreatic cancer cell lines, which in general were lower than in HPNE, a pseudodiploid human cell line obtained from pancreatic ducts and immortalized with hTERT (Fig. S2c). Of note, the ability of PDAC cells to form colonies in soft agar was inversely correlated with their levels of phospho-ERK (Fig. S2d) suggesting that ERK-dependent tumor suppression mechanisms operate both in premalignant and malignant cells.
Restoring high ERK signaling induces senescence in pancreatic cancer cells
We next sought to investigate whether increasing ERK signaling changed the malignant phenotype of pancreatic cancer cells. Since most pancreatic cancer cell lines already express mutant KRAS, we used a constitutively activated allele of c-RAF fused to the estrogen receptor (RAF-ER). The fusion protein is inactive but can be activated by treatment with 4-hydroxytamoxifen leading to ERK pathway activation, which can be prevented by using the ERK inhibitor SCH772984 as shown in immunoblots for activated MEK and ERK both in human Panc-1 (Figure 3) and KP-4 cells and mouse AH375 and NB508 cells (Fig. S3a). The activation of RAF-ER inhibited cell proliferation both in growth (Figure 3b and S3b) and colony assays (Figure 3c and d and S3c and d), induced the senescence-associated β-galactosidase (SA-β-Gal) (Figure 3e and S3e), decreased KI-67 levels (Figure 3f and S3f) and increased the cell cycle inhibitor p21/CDKN1A (Figure 3g and S3g). Immunoblots analysis showed additional signs of proliferation arrest in response to the ERK inhibitor or the induction of RAF-ER, and they include a decrease in phosphorylated RB and phosphorylation of H3 at serine 10 (Figure 3h and S3h). Panc-1, KP4, and NB508 are disabled for p53 [13,20,21] while Panc-1 cells have a homozygous deletion of p16INK4a [21] implying a non-canonical pathway for induction of senescence in these cell lines. Importantly, all signs of senescence were prevented by treatment with the ERK inhibitor (Figure 3b-h and S3b-h) indicating that the ERK kinases are the major targets of RAF-ER for the induction of a senescent-like cell cycle arrest.
Figure 3.

Reactivation of ERK signaling in PDAC induces a senescent-like phenotype in an ERK-dependent manner. (a) immunoblots for the indicated proteins in Panc-1 human pancreatic cancer cells expressing ΔRAF1-ER (RAF-ER) or ER control vector (ER) following a 48 h treatment with indicated drugs. 4OHT, 4-hydroxytamoxifen; SCH, ERK inhibitor SCH772984. p-MEK1/2, MEK1/2 phosphoserines 217/221; p-ERK1/2, ERK 1 (p44, upper band) and 2 (p42, lower band) phosphorylated on threonine 202 and tyrosine 204. (b) proliferation of Panc-1 cells expressing the RAF-ER vector, measured by MTT assay. The relative proliferation represents the fold of OD at 570 nm over 48 h of treatment with indicated drugs. Each bar represents the mean of three replicates ± SD. (c) phenotype of colonies as revealed by crystal violet staining 10 days post-seeding at low density with a single 48 h treatment of 4OHT and/or two treatments with SCH772984 every day for two days. Fresh drug-free media was used 48 hours after treatment. (d) quantification of colonies from (c). Each bar represents the mean number of colonies relative to colonies from vehicle-treated cells from three replicates ± SD.Co-treatment with ERK inhibitor SCH772984 rescues the growth defect caused by 4OHT-induced RAF activation. e SA-β-gal assay on cells as in (b). Each bar indicates the mean percentage of SA-β-gal-positive cells from three ≥ 100 cell counts ± SD. (f-g) quantitative RT-PCR (qPCR) for the indicated genes on cells as in (b). Each bar represents the mean fold-change (2−ΔΔCq) over the vehicle-treated condition from three replicates ± SD. (h) immunoblots for the indicated proteins on cells as in (b). p-RB S780, retinoblastoma protein phosphorylated on serine 780; p-H3 S10, Histone 3 phosphorylated on serine 10. (i) tumor volume, starting at day 0 of treatment, 1 month after subcutaneous injection of 1 × 10[6] Panc-1 cells expressing the RAF-ER construct into hsd: athymic Nude-Foxn1nu mice. Mice were treated every 48 h intraperitoneally with tamoxifen (Tam) or vehicle (Veh) starting when mean tumor volume reached ≥50 mm3. Data are shown as mean volume + SEM. Veh, n = 8 tumors from 4 mice; Tam, n = 10 tumors from 5 mice. (j) Immunohistochemistry of p-ERK and KI-67 of tissue sections from tumors harvested at the endpoint of (i). Scale bars = 50 µm. (k-l) quantification of p-ERK-positive cells and KI-67-positive cells from (j). Data are presented as the mean percentage of positive cells, from ≥ two fields with ≥ 100 cells for each tumor, ± SEM. Veh, n = 20 fields; Tam, n = 22 fields. For panels b, d-g, i, k-l, two-tailed Student t-test. Experiments a-h were performed independently at least twice in Panc-1 cells and were repeated with similar results in three additional pancreatic cancer cell lines. Experiments i-l were repeated with similar results in one additional pancreatic cancer cell line. See supplemental Figures S3-S4.
To investigate whether ERK activation can also halt tumor progression in vivo, we injected mice with Panc-1 or AH375 cells expressing RAF-ER in nude mice and when tumors reached 50 mm3 we induced ERK activation with tamoxifen. This treatment significantly slowed tumor growth (Figure 3i and S4a) and increased the levels of phospho-ERK while decreasing the levels of KI-67 (Figure 3j-l and S4b-d). In these immunocompromised mice, senescent cells were not eliminated and therefore tumors did not regress.
ERK-dependent tumor suppression is associated with changes in the nucleolar phosphoproteome and nucleolar stress
Since ERK kinase activation is responsible for the senescent cell cycle arrest triggered by RAF-ER in pancreatic cancer cells, we next sought to find ERK targets responsible for this phenotype. We thus performed label-free phosphoproteomics to identify the changes within the phosphoproteome after induction of RAF-ER in Panc-1 cells. As expected, we observed a prominent increase in the phosphorylation of RAF1 consistent with its activated status (Figure 4a). We also detected a striking increase in the phosphorylation of ZNF185, which is a p53 target gene that plays a role in the DNA damage response and the cytoskeleton [22]. The most downregulated phosphoproteins included several nuclear proteins, splicing factors, and a network of nucleolar proteins such as the tumor antigen KI-67, the ribosome biogenesis factors NPM1, TCOF1/Treacle, DDX21, and RSL1D1 (Figure 4a-e). Of note, the downregulation of nucleolar phosphoproteins including RSL1D1 (Ribosomal L1 Domain Containing 1) and DDX21 (DExD-Box Helicase 21) is a hallmark of oncogene-induced senescence (OIS) in normal human fibroblasts [7]. The role of all the individual phosphoproteins downregulated in RAF-ER-induced cells is not yet known. Protein phosphorylation is likely linked to the activation of some of these proteins. For example, the nucleolar transcription factor UBF [23,24] and the nucleolar oncoprotein nucleophosmin/B23 [25] are positively regulated by phosphorylation. Also, the ARF tumor suppressor inhibits ribosome biogenesis in part by decreasing UBF phosphorylation [26]. We thus reasoned that a decrease in phosphorylation of nucleolar proteins induced by RAF-ER could inhibit their functions and trigger a nucleolar stress response. We previously reported that depletion of RSL1D1 was sufficient to induce senescence [3,7] suggesting that decreasing the functions of nucleolar proteins is sufficient to trigger the process. To further strengthen the relationship between nucleolar proteins and senescence, we knocked down TCOF1, another phosphoprotein whose levels were decreased by RAF in Panc-1 cells (Figure 4a). Disabling TCOF1 with two independent shRNAs decreased cell proliferation and induced the accumulation of cells positive for SA-β-Gal in both Panc-1 and KP-4 cells (Fig. S5a-f).
Figure 4.
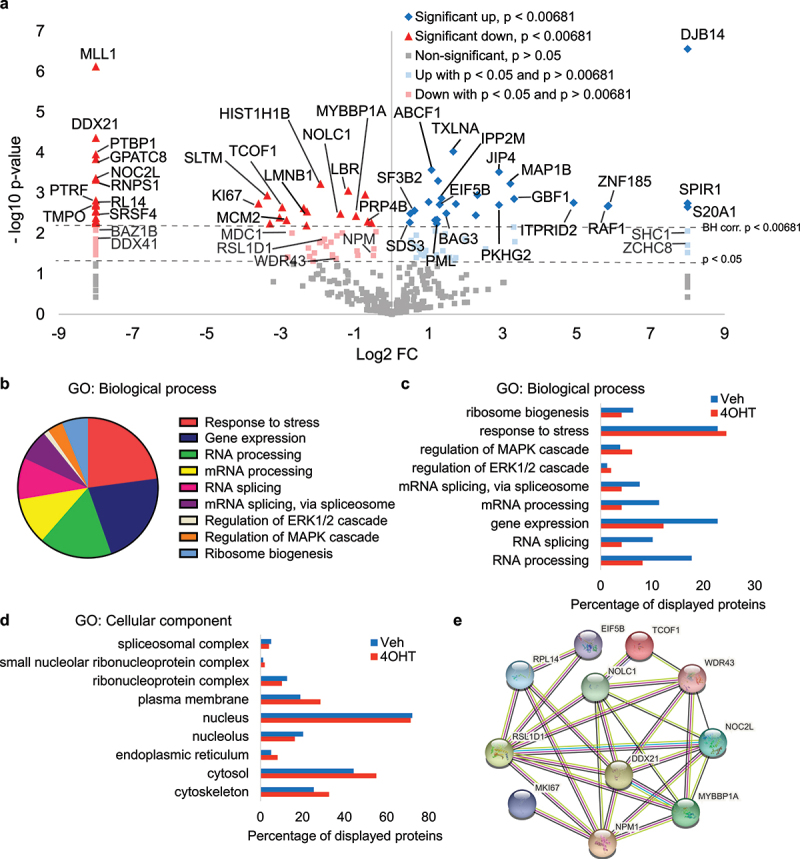
Phosphoproteomics of Panc-1 cells under high ERK signaling reveal changes associated with nucleolar stress. (a) Volcano plot summarizing phosphoproteomic changes in Panc-1 ΔRAF1-ERT (RAF-ER) cells treated for 48 h with 4OHT relative to vehicle-treated cells. Proteins whose phosphopeptides are enriched following RAF activation are shown in blue, whereas proteins whose phosphopeptides are downregulated are shown in red. Significance was assessed by t-test with Benjamini-Hochberg correction for multiple testing, BH P < 0.00681, n = 3 biological replicates. (b) Gene ontology for biological processes, using scaffold 4 Proteomics Software, of proteins whose phosphopeptides are significantly up- or downregulated following RAF pathway activation as in (a). (c) percentage of proteins from each condition (Veh or 4OHT) that are associated with GO terms of biological processes from (b). (d) percentage of proteins from each condition (Veh or 4OHT) that are associated with GO terms of cellular components. (e) STRING network representation of hits from (a) that are linked to nucleolar functions, ribosome biogenesis, and translation.
Agents that inhibit rRNA synthesis or induce rDNA damage induce a reorganization of the nucleolus leading to the formation of foci known as nucleolar caps [27]. Nucleolar caps contain RNA polymerase I (pol I) subunits and rRNA processing factors and they may function as sites for the repair of damaged rDNA [28]. To investigate the extent of nucleolar stress after induction of senescence in pancreatic cancer cells we looked at nucleolar caps using an antibody against the pol I subunit RPA194. As a positive control, we used cells where rRNA synthesis was inhibited using actinomycin D, a treatment that induces nucleolar caps [29]. Actinomycin D inhibited rRNA synthesis (as assessed using by 5-Ethynyl Uridine (EU) incorporation) in all cells in the population and induced characteristic nucleolar caps (visualized by staining with the anti-RPA194 antibody). However, induction of senescence by RAF-ER in Panc-1 cells did not inhibit rRNA synthesis at the time cells were fixed for staining and did not induce nucleolar caps. In fact, nuclei in RAF-ER induced cells displayed either a moderate or a high level of EU incorporation (Figure 5b). The latter is perhaps a reflection of the oncogenic stress induced by MAPK signaling that increases ribosomal RNA synthesis [7]. Nevertheless, clear foci containing RPA194 were visible in a substantial fraction RAF-ER induced cells (Figure 5a). Unlike nucleolar caps that localize to the periphery of nucleoli, these RPA194 foci localized inside the nucleolus. This was revealed by co-staining the cells with an antibody against the rRNA processing factor RSL1D1, which localizes to the nucleolar periphery (Figure 5c). These foci were also visualized in KP-4 pancreatic cancer cells expressing RAF-ER and treated with 4-hydroxytamoxifen (Fig. S6a) and in primary pancreatic epithelial cells (Figure 5d and S6b-c) or normal human fibroblasts after induction of senescence with oncogenic Ras (Fig. S6d). We thus designate them senescence-associated nucleolar foci (SANF). SANF also contained the pol I core factor TIF-IA/RRN3 and the pol I subunit RPA12 (Fig. S6e and f).
Figure 5.
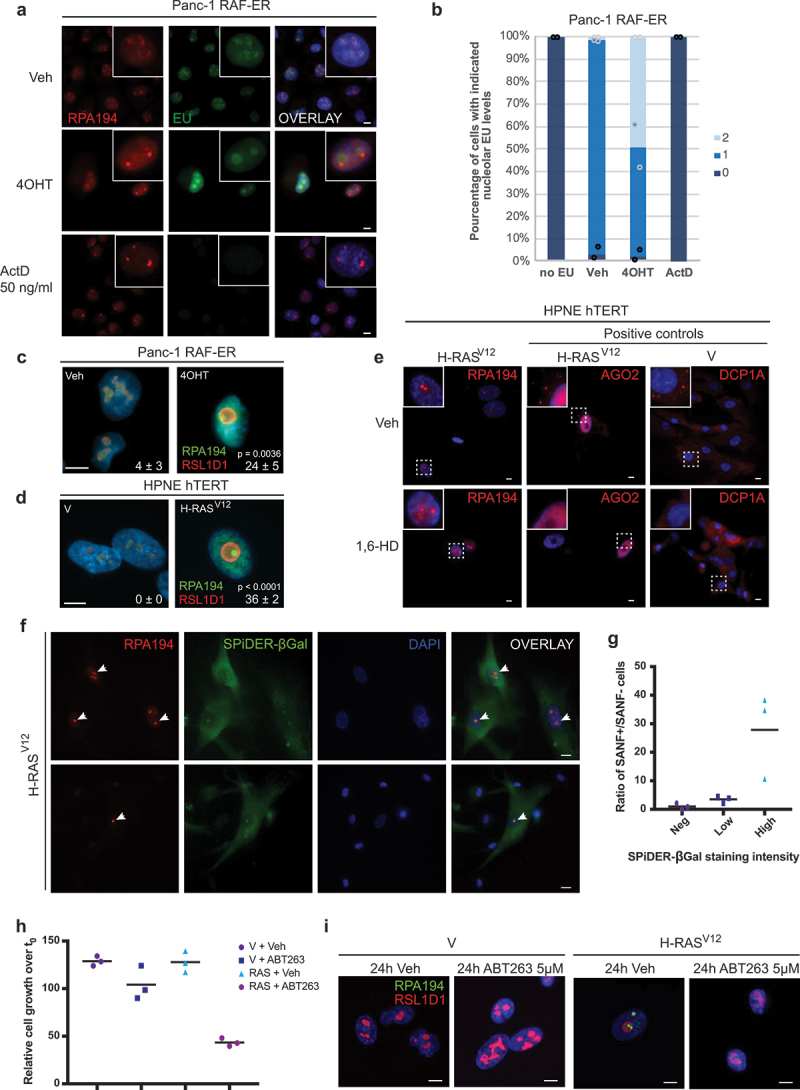
ERK-induced senescence is linked to nucleolar stress and senescence-associated nucleolar foci (SANF) formation. (a) 5-ethynyl uridine (EU) incorporation RPA194 in Panc-1 RAF-ER cells treated for 72 h with either vehicle or 4OHT, or for 18 h with actinomycin D (ActD) 50 ng/ml. Nuclei are counterstained with DAPI. Scale bar = 10 µm, n = 2. (b) quantification of EU incorporation by a semiquantitative scoring system (no staining = 0, moderate staining = 1 and strong staining = 2). One hundred cells were scored in six different images from two biological replicas. (c) immunofluorescence for RPA194 and RSL1D1 of Panc-1 RAF-ER cells treated for 48 h with vehicle, Veh or 4-hydroxytamoxifen, 4OHT. Quantification of cells harboring senescence-associated nucleolar foci (SANF) is shown in the bottom right corner. Data represent the mean percentage of cells ± SD from three counts of ≥ 100 cells, two-tailed Student t-test. Scale bar = 10 µm, n = 3. (d) immunofluorescence for RPA194 and RSL1D1 of HPNE hTERT cells expressing H-RASV12 or control vector (V), 12 days post-infection. Quantification was performed as in (c), two-tailed Student t-test, scale bar = 10 µm, n = 3. (e) immunofluorescence for RPA194, or AGO2 and DCP1A as positive controls, on cells as in (d) treated for 1 h with 1% 1,6-hexanediol or vehicle before fixation. SANF are not dissolved by hexanediol whereas P-bodies containing AGO2 or DCP1A are. Scale bar = 10 µm, n = 3. (f) SPiDER-βGal assay on H-RASV12-expressing HPNE hTERT cells and immunofluorescence using anti-RPA194 antibodies showing the presence of SANF (white arrows) in SPiDER-βGalHigh cells compared to surrounding SPiDER-βGalLow or negative cells. Scale bar = 20 µm, n = 2. (g) Quantification of the ratio of SANF-positive cells over negative cells among the indicated categories of SPiDER-βGal staining intensities from cells in (f). Data represent the mean ratio of cells from three counts of ≥ 60 cells ± SD, one-way ANOVA with Tukey HSD. (h) the senolytic ABT263 kills preferentially SANF-positive senescent cells. The graph shows the relative percentage of cell proliferation after a 24 h treatment with 5 µM ABT263 of cells as in (d), R means H-RASV12 expression. Data represent the mean of triplicates ± SD, as measured by crystal violet staining and quantification of OD at 590 nm relative to time 0, two-tailed Student t-test, n = 2. (i) immunofluorescence using antibodies against RPA194 and RSL1D1 on cells from (h), showing the phenotype of nucleoli and loss of SANF in cells remaining after senolysis. Scale bar = 10 µm, n = 2.
The nucleolus is a membrane-less organelle formed by co-existing but immiscible liquid sub-compartments that arise by the process of liquid-liquid phase separation (LLPS) [30]. Nucleolar caps are likely formed via the same mechanism and pol I that localizes there may remain in solution but in a different phase [31]. Treatment of senescent cells with 1,6-hexanediol, an aliphatic alcohol that disrupts the weak hydrophobic interactions that mediate LLPS [32], did not dissolve SANF (Figure 5e). As a control, 1,6-hexanediol was able to dissolve P-bodies, another membrane-less organelle formed by LLPS that can be visualized using antibodies against AGO2 or DCP1A (Figure 5e). Similarly, 1,6-hexanediol dissolved phase separated nucleolar caps [31] induced by actinomycin D, indicating that the drug can act in the nucleolus (Fig S7). Together, these results suggest that SANF are solid aggregates.
Since SANF were not present in every cell after induction of senescence, we next correlated their presence with the levels of SA-β-Gal revealed with the fluorescent biomarker SPiDER-βGal. We found that SANF were present in cells with higher SPiDER-βGal fluorescence, suggesting that they may correlate with the full establishment of the senescence program (Figure 5f-g). Consistent with this idea, the elimination of senescent cells from the population using the senolytic agent ABT-263 (a BCL2 family inhibitor) eliminated all SANF-containing cells (Figure 5h-i). Taken together, these results indicate that a nucleolar stress response is an important component of the senescence program, thereby suggesting that agents targeting the nucleolus can promote senescence in cancer cells.
Drugs targeting rRNA biogenesis improve the senescence response in pancreatic cancer cells
Ribosome biogenesis is a promising target for new anticancer therapies because the process is highly upregulated in tumor cells [33,34]. Several ribosome biogenesis inhibitors have been developed, including the pol I inhibitor CX-5461, currently in clinical trials [35] and BMH-21, an agent that inhibits ribosome biogenesis by promoting the degradation of pol I [36] but also via binding to G-quadruplexes present in the rDNA promoter [37,38]. Oxaliplatin, together with irinotecan, 5-fluorouracil, and folinic acid form the drug combination known as FOLFIRINOX, a mainstay systemic therapy against pancreatic cancer [39,40]. Oxaliplatin was initially thought to target tumor cells by causing DNA damage but recently it was found that this drug acts by inhibiting ribosome biogenesis [41,42]. We thus investigated whether oxaliplatin or BMH-21 could improve the senescence response to hyperactive ERK signaling in Panc-1 cells expressing RAF-ER. Both agents improved growth arrest (reduced RB and H3 phosphorylation) and induced cell death (increased cleaved caspase 3) after induction of ERK-dependent senescence in these cells (Figure 6a-d). On the other hand, treatment with actinomycin D, that also inhibits ribosome biogenesis (Fig S8a), did not cooperate with RAF-ER induction to induce growth arrest (Fig S8b-c). These results demonstrate that nucleolar stress triggered by hyperactive ERK signaling and pol I inhibitors cooperate to inhibit tumor cell proliferation and suggest that BMH-21 and oxaliplatin act via additional mechanisms other that inhibition of rRNA synthesis to explain their cooperation with RAF-ER.
Figure 6.

Nucleolar stressors and ERK activation cooperate to arrest the proliferation of pancreatic cancer cells and to promote structural changes in the nucleolus. (a) immunoblots for the indicated proteins on cell extracts from Panc-1 RAF-ER cells treated for 72 h with vehicle, 4OHT, oxaliplatin (L-OHP, 2 µM), or a combination of both drugs. p-RB S795, retinoblastoma protein phosphorylated on serine 795; p-H3 S10, Histone 3 phosphorylated on serine 10, F.L. CASP3, full-length caspase 3; c-CASP3, cleaved caspase 3, n = 3. (b) relative proliferation over 7 days of cells as in (a) as measured by the fold of OD at 590 nm from a crystal violet assay. Data represent the mean percentage of proliferation from triplicates ± SD, n = 3. (c) immunoblots for the indicated proteins on cell extracts from Panc-1 RAF-ER cells treated for 72 h with vehicle, 4OHT, BMH-21 (75 nM) or a combination of both drugs, n = 3. (d) relative proliferation over 7 days of cells as in (c) as measured by the fold of OD at 590 nm from a crystal violet assay. Data represent the mean percentage of proliferation from triplicates ± SD, n = 3. (e) immunofluorescence for RPA194 and RSL1D1 of Panc-1 RAF-ER cells treated with indicated drugs for 5 days at the concentrations described in (a) and (c). Scale bar = 10 µm, n = 3. For panels b and d, two-tailed Student t-test.
We previously showed that induction of senescence in normal human fibroblasts reduced the expression of ribosome biogenesis factors such as RSL1D1 [3,7]. However, hyperactive ERK signaling did not trigger this response in pancreatic cancer cells (Figure 6a-c). Of note, both oxaliplatin and BMH-21 reduced RSL1D1 levels suggesting that these agents restored pro-senescent signals lost during pancreatic cancer progression. We also looked at SANF after combining hyperactive ERK signaling with oxaliplatin or BMH-21. We noticed that combining these treatments increased the size of the nucleolus as we previously reported during OIS in normal fibroblasts. SANF were also bigger, and, in some cells, they localized to the periphery of the nucleolus (Figure 6e). BMH-21 is known for inducing the degradation of pol I [36]. We do see a decrease in RPA194 when using high concentrations of the drug. However, at 75 nM, the concentration used to reinforce senescence, BMH-21 did not decrease the levels of RPA194 (Fig S6g). Since at 75 nM BMH-21 still reduces both precursor and mature rRNA species (Fig S6h), these results suggest additional mechanisms to explain rRNA biogenesis inhibition. Consistent with this idea, BMH21 and CX-5461 bind to G-quadruplexes present in the rDNA promoter leading to pol I inhibition [37,38]. We conclude that senescence induced by hyperactive ERK signaling can be reinforced by using ribosome biogenesis inhibitors.
FOLFIRINOX mimics Ras-induced senescence
Pancreatic cancers are unusually resistant to DNA-damaging chemotherapy and one of the best treatments found so far consists of a chemotherapy regime called FOLFIRINOX. It combines the pol I inhibitor, oxaliplatin [41,43], irinotecan that targets topoisomerase I, and also reduces pol I activity [44,45] and 5-FU that inhibits DNA synthesis and rRNA processing [46]. As expected, treatment of pancreatic cancer cell lines Panc-1 and KP-4 with FOLFIRINOX induced a growth arrest and senescence (Figure 7a-b and S9a-b). Intriguingly, the biochemical pattern of senescent biomarkers induced by FOLFIRINOX is reminiscent of OIS [3,7] as it includes an increase in phospho-ERK and p21, as well as a decrease in STAT3, ribosome biogenesis factors (RSL1D1, EBP2, DDX21) and phospho-H3. FOLFIRINOX also induced apoptosis in this setting as shown by the presence of cleaved caspase 3 (Figure 7c and S9c). Nucleolar stress leads to the accumulation of amyloid deposits labeled by Congo Red [47], which we confirmed in FOLFIRINOX-treated cells both in KP-4 and Panc-1 cells (Figure 7d-e and S9d-e). The impact of this stress on ribosome biogenesis was reflected as a decrease in the levels of mature 18S, 5.8S, and 28S rRNAs (Figure 7f and S9f). Of note, both KP4 and Panc1 cells have a defective p53 pathway. P53 is not detectable in KP4 cells treated with FOLFIRINOX (Fig S10) while it is highly expressed in Panc1 cells (Fig S10), which contain a mutated p53 [48]. These results suggest that FOLFIRINOX and nucleolar stress induce senescence in pancreatic cancer cells independently of p53. FOLFIRINOX also triggered a stable proliferation arrest with high pERK expression, induction of p21, and reduction of mitotic and cell proliferation genes in the breast cancer cell line MDA-MB-231 and the colorectal cancer cell line HCT116 (Fig S11a-c). This effect also involved a reduction in ribosome biogenesis factors, rRNA precursors, and mature rRNA (Fig S11d-e) but RNA polymerase I staining revealed nucleolar caps instead of SANF (Fig S11f-g). Intriguingly, gemcitabine, another agent used to treat pancreatic cancer, also induced SANF in pancreatic cancer cells (Fig S12). Since SANF correlated with a stronger senescence phenotype based on SA-β-Gal staining (Figure 5f-g) these results suggest a cancer type-specific response that may explain the efficacy of FOLFIRINOX in pancreatic cancer.
Figure 7.

FOLFIRINOX efficiently restores high ERK signaling and features of senescence to promote tumor suppression in PDAC cells. (a) proliferation of Panc-1 cells treated every 3 days with FOLFIRINOX (5-FU 5 µM, SN38 10 nM, oxaliplatin 1 µM) or vehicle (Veh, DMSO) as measured by crystal violet assay. Data represent the relative fold change of OD at 590 nm. Each point represents the mean of triplicates ± SD, n = 3. (b) SA-β-gal assay at day 6 on cells as in (a). F, FOLFIRINOX. Each bar indicates the mean percentage of SA-β-gal-positive cells from three ≥ 100-cell counts ± SD, n = 3. (c) immunoblots of indicated proteins on cells as in (b). p-ERK1/2, extracellular-signal regulated kinases 1 (p44, upper band) and 2 (p42, lower band) phosphorylated on threonine 202 and tyrosine 204; p-RB S795, retinoblastoma protein phosphorylated on serine 795; p-H3 S10, Histone 3 phosphorylated on serine 10, c-CASP3, cleaved caspase 3, n = 3. (d) fluorescence imaging of cells as is (b) stained with Congo Red or control vehicle (CTL). Scale bar = 20 µm, n = 3. (e) violin plot showing quantification of Congo Red intensity in nucleoli from cells in (e). Each dot represents an assessment of intensity in a different cell from 20 cells assessed per replicate, dashed lines show the median and quartiles, outer line shows the distribution, n = 3. (f) RTqPCR on cells as in (b) with primers targeting the 18S, 5.8S, or 28S portion of both precursor and mature rRNAs, relative to HMBS and TBP housekeeping genes. Data represent the mean of triplicates ± SD., p = 0.0725, n = 3. (g) model describing the involvement of both p-ERK activation, nucleolar stress, and ribosome biogenesis inhibition in the senescence phenotype of FOLFIRINOX-treated pancreatic cancer cells. For panels a-b, e, and f, two-tailed Student t-test.
Discussion
Here we demonstrate a connection between the activation intensity of the ERK pathway in pancreatic cancer and cell fate. Moderate ERK activation corresponds to proliferative malignant lesions, whereas robust activation is observed in benign premalignant lesions. This pattern is consistent in samples from patients with pancreatic adenocarcinoma and a mouse model of the disease. When moderate ERK activation is intensified in PDAC cells, they stop proliferating and exhibit signs of cellular senescence. This phenotype is reversed when ERK is inhibited. These findings align with prior research indicating that the ERK pathway’s effects on cell proliferation, senescence, or apoptosis depend on the intensity and context of its activation, extending our understanding of PDAC progression [1,3,6,9,13,49–52].
Our mouse models and cell lines all feature the well-studied KRasG12D allele. The Dow lab created mice with various KRas mutants and discovered that mutations like KrasG12C, KrasG12R, and KrasG13D led to fewer PanIN lesions compared to KrasG12D. In low serum conditions, KRasG12D in MEFs showed increased ERK activity [53]. These findings support our research, linking heightened ERK activation to PanIN and senescence. However, further studies are necessary to explore the role of senescence in tumor progression in the presence of different KRas mutations. Initially, senescent cells act as a barrier to tumorigenesis, but they can bypass their cell cycle arrest and evolve into malignancy [13,54]. In line with this interpretation, one of us (VK) recently demonstrated that eliminating senescent PanIN lesions with senolytic drugs impeded PDAC formation in the KRasG12D mouse model [55].
Given this complex relationship between ERK activation and cell fate, we sought to investigate the specific mechanism acting downstream of ERK to halt tumor progression, thereby potentially identifying new targets for anticancer treatments. We found that ERK hyperactivation altered the nucleolar phosphoproteome, which led us to investigate the role of nucleolar stress in ERK-dependent senescence. The data show that ERK hyperactivation induced foci containing pol I in a significant fraction of the cells, correlating with high levels of the senescence marker SA-β-Gal. Unlike previously described nucleolar caps, these foci -which we designated SANF-, localized inside the nucleolus and were not dissolved by the aliphatic alcohol 1,6-hexanediol, suggesting that they represent solid aggregates that have lost the liquid properties of the normal nucleolus [30]. In addition, FOLFIRINOX induced SANF in pancreatic cancer cell lines but not in cell lines from colon or breast cancer, suggesting a cancer-specific response that requires further studies. Nonetheless, our findings suggest that the nucleolus and rRNA biogenesis could be key targets for efficient tumor suppression and senescence mediated by ERK hyperactivation in the absence of classic senescence regulators such as p53 and p16INK4a [20].
In this study, the capability to enhance the senescent response in pancreatic cancer cells was illustrated by merging hyperactive ERK signaling with ribosome biogenesis inhibitors BMH-21 or oxaliplatin. Notably, FOLFIRINOX, which combines ERK activation with ribosome biogenesis inhibition, induces both cell death and senescence in pancreatic cancer cells. We do not understand how FOLFIRINOX induces high levels of ERK in pancreatic cancer cells. We also ignore the mechanism of ERK pathway attenuation during the progression of this cancer. Schmitt and colleagues reported that pERK levels correlated with the induction of senescence in colorectal cancer patients treated with 5FU, one of the components of FOLFIRINOX [56]. We reported that replicative senescence is also associated with high levels of pERK [3]. Our rationale to look at pERK was based on the fact that we linked ERK hyperactivation to a decrease in ribosome biogenesis factors [3] and we reproduced that in FOLFIRINOX-treated pancreatic cancer cells (Figure 7c). Further work will be required to clarify the role of the ERK pathway in the senescence response to FOLFIRINOX. Most patients with pancreatic cancer eventually relapse after treatment with FOLFIRINOX. Our work suggests that this relapse restores ribosome biogenesis but retargeting the process may improve progression-free survival and prognosis of pancreatic cancer patients. Future clinical trials could be designed with ribosome biogenesis inhibitors to answer this question.
Materials and methods
Drugs, reagents, and plasmids
4-hydroxytamoxifen (4OHT, Sigma) was dissolved in ethanol and added to cells at 0.1 µM every 48 h. The ERK inhibitor SCH772984 (Selleckchem) was dissolved in DMSO and added to cells at 0.1 µM every 24 h. Tamoxifen for mice experiments was dissolved in ethanol at 100 mg/mL by incubating at 55°C for 5–10 min. Then it was diluted to 10 mg/mL with sunflower oil, vortexed, and let to stand for 15 min, aliquoted, and stored at 4°C in the dark. Actinomycin D (Sigma), BMH-21 (S7718, Selleckchem), 5-Fluorouracil (S1209, Selleckchem) and SN38 (S4908, Selleckchem) were dissolved in DMSO. Oxaliplatin (S1224, Selleckchem) was dissolved in dH2O. FOLFIRINOX combination is achieved by treating Panc-1 cells with 5 µM 5-FU, 10 nM SN38, and 1 µM Oxaliplatin, and by treating KP-4 cells with 3.5 µM 5-FU, 10 nM SN38, and 6 µM Oxaliplatin. Treatment with BMH-21, Oxaliplatin, or FOLFIRINOX was renewed every 3 days. ABT263 (ApexBio) was dissolved in DMSO, and cells were treated once at 5 µM.
Congo Red (Sigma, C6277) was dissolved in dH2O. 1,6-hexanediol (240117, Sigma) was dissolved in dH2O. Cells were treated with 1% 1,6-HD for 1 h before immunofluorescence procedure. X-Gal (Wisent, 800–145-UG) was dissolved in DMF. SPiDER-βGal assay was purchased from Dojindo (SG04), EU Click-it 488 RNA synthesis detection kit was purchased from ThermoFisher Scientific (C10329), MTT reagent from Sigma (Thiazolyl Blue Tetrazolium bromide, M5655) and crystal violet from Sigma (C6158).
Plasmids pWZL-hygro, pWZL-H-RASV12-hygro, pBabe-puro and pBabe-H-RASV12-puro were obtained from Dr. Scott W. Lowe (Sloan Kettering). pBabe-ΔRAF1-hER-puro and pBabe-ER-puro control vector were obtained from Dr. Martin McMahon (Huntsman Cancer Institute, University of Utah). The CDS from pBabe-ΔRAF1-hER starts with amino acids MEY before S306 of full-length RAF1 and aa Y340 and Y341 are changed for DD. pAMPHO plasmid was obtained from Dr. Garry Nolan, Stanford. Short hairpin RNAs (shRNAs) were obtained from Sigma, (pLKO.1-shTCOF1–2-puro: TRCN0000008631; pLKO.1-shTCOF1–4-puro: TRCN0000008633) and non-targeting control shRNA (pLKO.1-shNTC-puro: SHC002). Sequences of shRNAs are given in Table S1. pCMV-VSV-G (Addgene #8454) and pCMV-dR.91 (Delta8.9, Addgene #8455) were from R. Weinberg’s laboratory (Whitehead Institute, Cambridge, MA).
Cell culture and viral-mediated gene transfer
All cell lines were cultured at 37°C with 5% CO2 in a humidified incubator. Cell lines AH375 and NB508 were obtained from N. Bardeesy and are available upon request. 1497, 1498, and 1499 cell lines are of limited availability since PanIN cells cannot be easily expanded. For their isolation and culture method, see [13]. Human pancreatic normal epithelial (HPNE hTERT) cells were obtained from Dr. M. Ouellette (University of Nebraska Medical Center). IMR90 was obtained from Coriell Institute (I90–79). Pancreatic cancer cell lines were obtained from ATCC or Massachusetts General Hospital Center for Molecular Therapeutics (CMT). Breast cancer cell line MDA-MD-231 and colon cancer cell line HCT116 were purchased from ATCC. The following cell lines were cultured in DMEM (319–015-CL, Wisent) supplemented with 1% penicillin/streptomycin (Wisent) and 10% FBS (Wisent or Gibco): NB508, Panc-1, KP-4, HPAC, HPAF-II, Panc8.13, SW1990, IMR90, MDA-MD-231, HCT116, Phoenix-Ampho and HEK293T. The cell line HPNE-hTERT was cultured in media made of 75% DMEM (219–060-XK) and 25% M3 Base (M300F–500, Incell), supplemented with 1 g/L D-glucose (Sigma), 1.5 g/L sodium bicarbonate (Bioshop), 5% FBS (Wisent), 2 mM L-glutamine (Wisent), 10 ng/mL of human epidermal growth factor (hEGF, Gibco) and phenol red (Sigma). All cells were passaged using Trypsin (Wisent) except for 1497, 1498, 1499, AH375, and HPNE hTERT cells that were passaged using TrypLE (Gibco). All cell lines tested negative for mycoplasma contamination. Retroviral and lentiviral-mediated gene transfers were done as previously described [3].
Proliferation assays (crystal violet, MTT, colony assay and sphere forming assay)
For growth curves and growth assays, 1 × 10[4] Panc-1 cells or 6 × 10[3] KP-4 cells were seeded in four 12-well plates in triplicates. A plate was fixed the following day for day 0, then one at three other time points. Each time, cells were washed with PBS1X and then incubated for 15 min at room temperature with a fresh solution of 1% glutaraldehyde in PBS1X. Cells were washed again and stained with 0.1% Crystal violet in PBS1X for 30 min, then rinsed thoroughly in water and let to dry. Crystal violet was retrieved by dissolving it in 10% acetic acid in water for 1 h under mild agitation, then OD was measured at 590 nm. Plotted data represent the relative change of OD over the day 0 value.
For colony assays, 2 × 10[3] Panc-1 cells or 1 × 10[3] KP-4, NB508, or AH375 were seeded in 6-well plates in triplicates. Crystal violet staining was performed when colonies were observed in vehicle-treated cells, 10 days post-seeding.
For MTT assays, four thousand cells were seeded in 96-well plates in triplicates. At indicated time points, media was replaced by DMEM without phenol red containing 0.5 mg/mL MTT reagent for 3 h at 37°C. Plates were then spun down at 1000 rpm for 10 min, and media was replaced by 100 µL DMSO. Plates were left to rotate at room temperature for 15 min, then OD was measured at 570 nm.
Sphere-forming assay was performed as described in [13] but using DMEM F12 media from Wisent (319–085-Cl).
Senescence-associated β-galactosidase assay
Cells were seeded in 6-well plates then, at indicated time points, cells were washed with PBS1X and fixed for 15 min at room temperature with a fresh solution of 0.5% glutaraldehyde in PBS1X. Cells were then washed twice with 1 mM MgCl2, PBS1X, pH 5.5 for 4 min. Then we added 0.45 µm-filtered X-Gal staining solution (0.164% w/v Potassium hexacyanoferrate (III), 0.21% w/v Potassium hexacyanoferrate (II) trihydrate, 1 mg/mL X-Gal in PBS1X + MgCl2 solution) and incubated overnight at 4°C, followed by another 6 h incubation at 37°C in renewed X-Gal staining solution. Cells were then washed three times with 100 mM Tris pH 8.0 and kept in that solution to stop the enzymatic reaction. Pictures were taken under the 20X objective of the EVOS XL Core imaging system (ThermoFisher Scientific). The mean percentage of positive cells was assessed by manual counting of at least three fields containing ≥ 100 cells.
Western blots
Adherent cells were washed twice with PBS1X and scraped in Laemmli 2X buffer (4% SDS, 20% glycerol, 120 mM Tris-HCl pH 6.8). For immunoblots in Figures 6–7 and S7, floating cells were also collected by centrifugation to assess Caspase 3 status in all cells. Protein extracts were then boiled at 95°C for 5 min and let to cool down to room temperature. Concentration was then assessed using the Nanodrop, and concentrations were equalized between samples by completing with Laemmli 2X, and then adding 10% β-mercaptoethanol and 0.05% of bromophenol blue. Samples were then boiled again for 5 min and 25 µg of proteins were loaded on SDS-PAGE. After migration, proteins were transferred to 0.45 µm nitrocellulose membranes and blocked for 1 h in PBS-T (PBS1X, 0.05% Tween20) containing 5% milk. Membranes were then washed three times 10 min with PBS-T, then primary antibodies were added in PBS1X, 0.1% BSA, 0.02% Sodium azide, and incubated overnight at 4°C except for anti-β-Actin (30 min at room temperature) and anti-STAT3 (20 min at room temperature). Then membranes were washed three times 10 min with PBS-T, then appropriate HRP-conjugated secondary antibodies in PBS1X 1% milk were incubated for 1 h at room temperature (or 30 min following β-actin immunoblot, or 20 min following STAT3 immunoblot). After that, membranes were washed again three times for 10 min and were incubated with ECL Western blotting reagent (RPN2106, Amersham). Chemiluminescent signal was revealed by exposition on Super-RX X-ray films (Fujifilm). Membranes were stripped between incubation with different antibodies using Stripping buffer (25 mM glycine, 1% SDS in dH2O, pH 2.0). For immunoblots with multiple antibodies targeting proteins of approximately the same molecular size, protein extracts were simultaneously run on two gels to avoid overstripping the membranes or ambiguous band assignation. The loading control was performed on all gels to confirm equal loading and transfer.
EU incorporation
EU incorporation was performed with the Click-it RNA AlexaFluor 488 imaging kit (Invitrogen) according to the manufacturer’s instructions. Briefly, cells were seeded on coverslips to be at a ~ 60% confluency on the day of the experiment and treated as indicated. 1 mM EU (or the equivalent volume of the vehicle) was added to the cells (without media change), which were left for one hour at 37°C with 5% CO2. Then, media was removed, and cells were fixed for 15 min at room temperature with 4% PFA in PBS1X. Cells were washed once with PBS1X and then permeabilized in 0.5% Triton X-100 in PBS1X for 15 min at room temperature. Click-it reaction cocktail was prepared fresh and according to the manufacturer’s instructions. Permeabilization buffer was removed, then cells were washed once with PBS1X, then incubated with the reaction cocktail for 30 min at room temperature in the dark. Then, the cocktail was removed, and cells were rinsed once with the rinse buffer (component F of the kit). Then the immunofluorescence protocol was followed from the blocking step but in the dark. AlexaFluor 568 secondary antibodies were used to detect primary antibodies and not interfere with EU-Click-it-488 signal.
Congo red staining
Cells were seeded on coverslips and treated as indicated. Then they were washed twice with PBS1X, fixed with 4% PFA in PBS1X for 10 min at 4°C and washed three times in PBS1X + 0.01% Sodium azide for storage. For staining, we first removed Sodium azide by washing three times for 10 min in PBS1X. Afterward, cells were permeabilized with Triton X-100 0.3% in PBS1X for 5 min, rinsed with dH2O then stained for 15 min in 0.05% w/v Congo Red in dH2O in the dark. Then cells were washed again four times 3 min with dH2O, mounted on slides using Vectashield with DAPI mounting media (H-1200, Vectorlabs) and sealed with nail polish. Congo Red staining was revealed using the 63X objective and the TexasRed channel on the Zeiss Axio Imager Z2 microscope.
Immunofluorescence
Cells were seeded on coverslips in 6-well plates. At indicated time points, cells were washed twice with PBS1X and then fixed for 10 min at 4°C with 4% PFA in PBS1X. Cells were washed three times with PBS and then kept at 4°C in PBS1X + 0.01% Sodium azide or used right away (no sodium azide) for staining. If sodium azide was used to preserve cells, then three other 10 min washes were performed with PBS1X, then cells were incubated for 10 min in permeabilization buffer (0.2% Triton-X-100, 2% BSA, PBS1X). Then cells were blocked three times 10 min with 2% BSA in PBS1X. Coverslips were incubated on slides overnight at 4°C with primary antibodies in a humidity chamber. The following day, coverslips were retrieved and washed three times 10 min with PBS+BSA and then stained on slides in a humidity chamber with secondary antibodies for 1 h at room temperature in the dark. Coverslips were then washed four times 10 min with PBS1X and mounted on slides with Vectashield containing DAPI and sealed using nail polish. Pictures were taken with a Zeiss Axio Imager Z2 microscope.
For SANF quantification, cells containing at least 1 and up to ~ 5 big bright foci of RPA194 per nucleolus were considered positive, whereas cells harboring diffuse nucleolar staining were considered negative.
Senescence-associated SPiDER-βGal assay
The SPiDER-βGal assay was performed according to manufacturer’s instructions (Dojindo, SG04). Briefly, cells were seeded on coverslips. Then, at indicated time points, media was removed, and cells were washed with PBS1X and then fixed for 3 min at room temperature with 4% PFA in PBS1X. Cells were washed again three times with PBS1X and then incubated for 30 min at 37°C without CO2 with SPiDER-βGal solution or diluted McIlvaine buffer. To prepare the SPiDER-βGal solution, the SPiDER-βGal reagent was reconstituted in 7 µL DMSO and then diluted 1:1000 in McIlvaine buffer (pH 6.0) 0.2X. After incubation, cells were kept in the dark for the following steps. Solutions were prepared fresh and used right away. The staining solution was removed, then cells were washed twice with PBS1X. Then cells were permeabilized with 0.1% Triton X-100 in PBS1X for 30 min at room temperature. Cells were washed again twice with PBS1X and then blocked with 1% BSA in PBS1X for 1 h at room temperature. Then immunofluorescence procedure was followed. SPiDER-βGal staining was revealed under the 20X objective and using the AlexaFluor 500 channel on the Zeiss Axio Imager Z2 microscope.
Mouse xenograft experiments
Mouse experiments were performed in accordance with the CDEA (Comité de déontologie de l’expérimentation sur les animaux) of the University of Montreal. 1 × 10[6] Panc-1 RAF-ER cells or AH375 RAF-ER cells were subcutaneously injected in a 1:1 PBS1X+cells: Matrigel (Corning 354,234) mix in both flanks of Hsd: Athymic Nude-Foxn1nu mice (Envigo). Successful engraftment was obtained for 9 mice out of 10. When mean tumor volume reached ≥50 mm3, approximately one-month post-Panc-1 injection and one week post-AH375 injection, mice were separated into two groups, 4 mice in the control group and 5 in the Tamoxifen group. Mice were treated every 48 h by intraperitoneal injection of 100 µL containing 1 mg Tamoxifen in 9:1 sunflower oil: ethanol mix, or Tamoxifen-free mix as a control. Tumors were measured every two days and mice were weighed twice per week to ensure they were not experiencing weight loss. Tumor volume was calculated using the formula: (Length x width x height)/2. Mice were sacrificed and tumors were harvested when any endpoint was reached.
RT-qPCR
RT-qPCR was performed as published in [57]. The complete list of primers used for qPCR and their sequence is available in Table S1.
Microarray and GSEA analyses
Microarray data were published and described in [13]. New analyses were performed using Gene Set Enrichment Analysis (GSEA) software (version 4.0.3) [58], using the same criteria as previously described, to assess enrichment for signatures of MAPK pathway status of activation as indicated in Figure 2 and S2.
Statistical analyses
To determine statistical significance, unpaired two-tailed Student t-tests were performed using the GraphPad Prism Software version 8 or 9 assuming similar SD between populations. ANOVA with Tukey HSD tests was performed using the online platform astatsa.com. Differences between conditions were considered statistically significant at P < 0.05. Analyses performed on the phosphoproteomics data are described in the corresponding section. Error bars represent standard deviation (SD) in all graphs except in Figure 3i-l and Fig. S4 for in vivo xenograft data where the standard error of the mean (SEM) was determined. For qPCR data, immunoblots, growth assays, β-gal staining, immunofluorescences, and immunohistochemistry staining, one representative biological replicate is shown. The “n” value in the figure legends represents the number of biological replicates for which, in the case of qPCR, SA-β-gal, and growth assays, three technical replicates were done for each “n”.
Data availability
Phosphoproteomics data have been deposited to the ProteomeXchange Consortium via the PRIDE partner repository with the dataset identifier P×D032257and 10.6019/PXD032257: Username: reviewer_pxd032257@ebi.ac.uk, Password: ldqHSuTW. Microarray data were deposited in NCBI’s Gene Expression Omnibus (GEO) and are accessible through GEO Series accession number GSE57566. Clinical data regarding tissues used for IHC cannot be shared according to the agreement with Partners Healthcare to protect patient’s privacy. Source data for all figures can be provided upon reasonable request to the corresponding author.
Supplementary Material
Acknowledgements
For phosphoproteomics analyses, we thank Dr. Bonneil and the Center for Advanced Proteomics Analyses. We thank Drs Roy, Desgroseillers, Lowe, McMahon, Nolan, Oeffinger, Ouelette, and Weinberg for access to equipment, reagents, and/or advice. Thanks to M. Vasseur and Dr. Stifani for help with the Microscopy Platform of the University of Montreal’s Biochemistry Department. This work was supported by Canada Graduate Scholarships Michael Smith Foreign Study Supplements to M.C. Rowell and X. Deschênes-Simard and by FRQS (Fonds de recherche Québec - Santé) fellowships to M.C. Rowell, S. Lopes-Paciencia and P. Kalegari. We thank the Montreal Cancer Institute’s Canderel funds and the Pierre-Saul Funds for pancreatic cancer research for financial support. V. Krizhanovsky is supported by the Israel Science Foundation-Canada program (2633/17) and the European Research Council (856487). Nabeel Bardeesy was supported by NIH/NCI P01CA117969. G. Ferbeyre is supported by the Joint Canada-Israel Research Program of IDRC, CIHR PJT-153217, and the CIBC chair for breast cancer research.
Funding Statement
The work was supported by the H2020 European Research Council [856487]; Institute of Cancer Research [PJT-153217]; IDRC [Canada-Israel Research Program]; NIH-NCI [NIH/NCI P01CA117969].
Disclosure statement
No potential conflict of interest was reported by the author(s).
Author contributions:
M.C.R performed most replicates of experiments for Figures 3a-i, 4 –6, 7a-c, S2c, S3, S4a, S5, S6a-f, S8a-c, reproduced data from Figures 1a and 2d, did tissue culture and Congo Red staining for Figure 7d-e and S8d-e, and Western-blots for Fig. S9a and S10a. M.C.R analyzed phosphoproteomics data for Figure 4. X.D.S performed experiments for Figures 1–2, S1, S2a-b, and quantified data for Figure 7b and S8b. S.L.P performed experiments for Figure 5e, quantified Figure 5f, optimized conditions for Fig. S5, did tissue culture for Fig. S6d, performed qPCR experiments for Figure 7f and S8f and immunofluorescences for Fig. S6g, S7, S9f-g, S10b. S.L.P also gave conceptual and technical input and performed many exploratory experiments in the course of project development. B.L.C co-performed experiments for Figure 3a-e, i, Figure 4a, Fig. S3 a-e, S4a, performed IHC and quantification for Figure 3j-l and S4b-d and performed tumor sphere assay for Fig S2. P.K. reproduced data from Figure 3f-g, and optimized drug dosage for Figures 6–7 and S7. L.M. and A.F.R. reproduced experiments for Fig. S5. J.G. reproduced experiments in Figure 7a-c, and f and Fig. S8a-c and f. P.K. and J.G. did tissue culture for Fig. S6g, S7, S9–10. F.L. gave conceptual and technical input during the project. V.B. designed the qPCR primers for rRNA qPCR, did qPCR for Fig. S6h and S9d-e, reproduced qPCR experiments for Figure 7f and S8f, and helped in the design of experiments. S.I. did the image acquisition and quantification for Figure 7d-e and S8d-e. A.M.D. performed crystal violet assays for Fig. S9b-c. Y.S. reproduced data from Fig.S5a-c. F.K. helped in IHC scoring for Figures 1–2, and S1. V.D. reviewed histology for Figures 1–2 and Fig.S1. V.K. supervised the project and provided conceptual input regarding the use of senolytics and the analysis of senescence in PanIN and PDAC samples. N.B. provided patient samples and mouse samples of different stages of progression of PDAC for Figures 1–2 and S2, pancreatic cancer cell lines, and conceptual input regarding pancreatic cancer biology. G.F. supervised the project, provided conceptual input, and wrote the manuscript, except for Figures legends and Materials and methods that were written by M.C.R. Figures were prepared by M.C.R. with help from X.D.S., S.L.P, B.L.C., and S.I. All authors participated in reviewing the manuscript.
Supplementary material
Supplemental data for this article can be accessed online at https://doi.org/10.1080/15384101.2023.2278945
References
- [1].Deschenes-Simard X, Kottakis F, Meloche S, et al. Erks in cancer: friends or foes? Cancer Res. 2014;74(2):412–419. doi: 10.1158/0008-5472.CAN-13-2381 [DOI] [PubMed] [Google Scholar]
- [2].Deng Q, Liao R, Wu BL, et al. High intensity ras signaling induces premature senescence by activating p38 pathway in primary human fibroblasts. J Biol Chem. 2004;279(2):1050–1059. doi: 10.1074/jbc.M308644200 [DOI] [PubMed] [Google Scholar]
- [3].Deschenes-Simard X, Gaumont-Leclerc MF, Bourdeau V, et al. Tumor suppressor activity of the ERK/MAPK pathway by promoting selective protein degradation. Genes Dev. 2013;27(8):900–915. doi: 10.1101/gad.203984.112 [DOI] [PMC free article] [PubMed] [Google Scholar]
- [4].Rahmouni S, Cerignoli F, Alonso A, et al. Loss of the VHR dual-specific phosphatase causes cell-cycle arrest and senescence. Nat Cell Biol. 2006;8(5):524–531. doi: 10.1038/ncb1398 [DOI] [PubMed] [Google Scholar]
- [5].Zhu B, Ferry CH, Blazanin N, et al. PPARβ/δ promotes HRAS-induced senescence and tumor suppression by potentiating p-ERK and repressing p-AKT signaling. Oncogene. 2014;33(46):5348–5359. doi: 10.1038/onc.2013.477 [DOI] [PMC free article] [PubMed] [Google Scholar]
- [6].Chen JY, Hug C, Reyes J, et al. Multi-range ERK responses shape the proliferative trajectory of single cells following oncogene induction. Cell Rep. 2023;42(3):112252. doi: 10.1016/j.celrep.2023.112252 [DOI] [PMC free article] [PubMed] [Google Scholar]
- [7].Lessard F, Igelmann S, Trahan C, et al. Senescence-associated ribosome biogenesis defects contributes to cell cycle arrest through the Rb pathway. Nat Cell Biol. 2018;20(7):789–799. doi: 10.1038/s41556-018-0127-y [DOI] [PubMed] [Google Scholar]
- [8].Kong X, Kuilman T, Shahrabi A, et al. Cancer drug addiction is relayed by an ERK2-dependent phenotype switch. Nature. 2017;550(7675):270–274. doi: 10.1038/nature24037 [DOI] [PMC free article] [PubMed] [Google Scholar]
- [9].Shin S, Buel GR, Wolgamott L, et al. ERK2 Mediates Metabolic Stress Response to Regulate Cell Fate. Mol Cell. 2015;59(3):382–398. doi: 10.1016/j.molcel.2015.06.020 [DOI] [PMC free article] [PubMed] [Google Scholar]
- [10].Bardeesy N, Aguirre AJ, Chu GC, et al. Both p16 Ink4a and the p19 arf -p53 pathway constrain progression of pancreatic adenocarcinoma in the mouse. Proc Natl Acad Sci U S A. 2006;103(15):5947–5952. doi: 10.1073/pnas.0601273103 [DOI] [PMC free article] [PubMed] [Google Scholar]
- [11].Hingorani SR, Petricoin EF, Maitra A, et al. Preinvasive and invasive ductal pancreatic cancer and its early detection in the mouse. Cancer Cell. 2003;4(6):437–450. doi: 10.1016/S1535-6108(03)00309-X [DOI] [PubMed] [Google Scholar]
- [12].Caldwell ME, DeNicola GM, Martins CP, et al. Cellular features of senescence during the evolution of human and murine ductal pancreatic cancer. Oncogene. 2012;31(12):1599–1608. doi: 10.1038/onc.2011.350 [DOI] [PMC free article] [PubMed] [Google Scholar]
- [13].Deschenes-Simard X, Parisotto M, Rowell MC, et al. Circumventing senescence is associated with stem cell properties and metformin sensitivity. Aging Cell. 2019;18(2):e12889. doi: 10.1111/acel.12889 [DOI] [PMC free article] [PubMed] [Google Scholar]
- [14].Kamisawa T, Wood LD, Itoi T, et al. Pancreatic cancer. Lancet. 2016;388(10039):73–85. doi: 10.1016/S0140-6736(16)00141-0 [DOI] [PubMed] [Google Scholar]
- [15].Morris J, Wang SC, Hebrok M, et al. Wnt and the twisted developmental biology of pancreatic ductal adenocarcinoma. Nat Rev Cancer. 2010;10(10):683–695. doi: 10.1038/nrc2899 [DOI] [PMC free article] [PubMed] [Google Scholar]
- [16].Collins MA, Yan W, Sebolt-Leopold JS, et al. MAPK signaling is required for dedifferentiation of acinar cells and development of pancreatic intraepithelial neoplasia in mice. Gastroenterology. 2014;146(3):822–34 e7. doi: 10.1053/j.gastro.2013.11.052 [DOI] [PMC free article] [PubMed] [Google Scholar]
- [17].Hruban RH, Takaori K, Klimstra DS, et al. An illustrated consensus on the classification of pancreatic intraepithelial neoplasia and intraductal papillary mucinous neoplasms. Am J Surg Pathol. 2004;28(8):977–987. doi: 10.1097/01.pas.0000126675.59108.80 [DOI] [PubMed] [Google Scholar]
- [18].Sipos B, Frank S, Gress T, et al. Pancreatic intraepithelial neoplasia revisited and updated. IAP. 2009;9(1–2):45–54. doi: 10.1159/000178874 [DOI] [PubMed] [Google Scholar]
- [19].Corcoran RB, Contino G, Deshpande V, et al. STAT3 plays a critical role in KRAS-induced pancreatic tumorigenesis. Cancer Res. 2011;71(14):5020–5029. doi: 10.1158/0008-5472.CAN-11-0908 [DOI] [PMC free article] [PubMed] [Google Scholar]
- [20].Parisotto M, Vuong-Robillard N, Kalegari P, et al. The NAMPT inhibitor FK866 increases metformin sensitivity in pancreatic cancer cells. Cancers (Basel). 2022;14(22):5597. doi: 10.3390/cancers14225597 [DOI] [PMC free article] [PubMed] [Google Scholar]
- [21].Deer EL, Gonzalez-Hernandez J, Coursen JD, et al. Phenotype and genotype of pancreatic cancer cell lines. Pancreas. 2010;39(4):425–435. doi: 10.1097/MPA.0b013e3181c15963 [DOI] [PMC free article] [PubMed] [Google Scholar]
- [22].Smirnov A, Cappello A, Lena AM, et al. ZNF185 is a p53 target gene following DNA damage. Aging. 2018;10(11):3308–3326. doi: 10.18632/aging.101639 [DOI] [PMC free article] [PubMed] [Google Scholar]
- [23].Lin CY, Navarro S, Reddy S, et al. CK2-mediated stimulation of pol I transcription by stabilization of UBF–SL1 interaction. Nucleic Acids Res. 2006;34(17):4752–4766. doi: 10.1093/nar/gkl581 [DOI] [PMC free article] [PubMed] [Google Scholar]
- [24].Voit R, Grummt I.. Phosphorylation of UBF at serine 388 is required for interaction with RNA polymerase I and activation of rDNA transcription. Proc Natl Acad Sci U S A. 2001;98(24):13631–13636. doi: 10.1073/pnas.231071698 [DOI] [PMC free article] [PubMed] [Google Scholar]
- [25].Perera Y, Farina HG, Gil J, et al. Anticancer peptide CIGB-300 binds to nucleophosmin/B23, impairs its CK2-mediated phosphorylation, and leads to apoptosis through its nucleolar disassembly activity. Mol Cancer Ther. 2009;8(5):1189–1196. doi: 10.1158/1535-7163.MCT-08-1056 [DOI] [PubMed] [Google Scholar]
- [26].Ayrault O, Andrique L, Fauvin D, et al. Human tumor suppressor p14ARF negatively regulates rRNA transcription and inhibits UBF1 transcription factor phosphorylation. Oncogene. 2006;25(58):7577–7586. doi: 10.1038/sj.onc.1209743 [DOI] [PubMed] [Google Scholar]
- [27].Reynolds RC, Montgomery PO, Hughes B. Nucleolar “caps” produced by actinomycin D. Cancer Res. 1964;24:1269–1277. [PubMed] [Google Scholar]
- [28].van Sluis M, McStay B. A localized nucleolar DNA damage response facilitates recruitment of the homology-directed repair machinery independent of cell cycle stage. Genes Dev. 2015;29(11):1151–1163. doi: 10.1101/gad.260703.115 [DOI] [PMC free article] [PubMed] [Google Scholar]
- [29].Shav-Tal Y, Blechman J, Darzacq X, et al. Dynamic sorting of nuclear components into distinct nucleolar caps during transcriptional inhibition. Mol Biol Cell. 2005;16(5):2395–2413. doi: 10.1091/mbc.e04-11-0992 [DOI] [PMC free article] [PubMed] [Google Scholar]
- [30].Feric M, Vaidya N, Harmon TS, et al. Coexisting Liquid Phases Underlie Nucleolar Subcompartments. Cell. 2016;165(7):1686–1697. doi: 10.1016/j.cell.2016.04.047 [DOI] [PMC free article] [PubMed] [Google Scholar]
- [31].Ide S, Imai R, Ochi H, et al. Transcriptional suppression of ribosomal DNA with phase separation. Sci Adv. 2020;6(42):6. doi: 10.1126/sciadv.abb5953 [DOI] [PMC free article] [PubMed] [Google Scholar]
- [32].Kroschwald S, Maharana S, Mateju D, et al. Promiscuous interactions and protein disaggregases determine the material state of stress-inducible RNP granules. Elife. 2015;4:e06807. doi: 10.7554/eLife.06807 [DOI] [PMC free article] [PubMed] [Google Scholar]
- [33].Quin JE, Devlin JR, Cameron D, et al. Targeting the nucleolus for cancer intervention. Biochim Biophys Acta. 2014;1842(6):802–816. doi: 10.1016/j.bbadis.2013.12.009 [DOI] [PubMed] [Google Scholar]
- [34].Pelletier J, Thomas G, Volarevic S. Ribosome biogenesis in cancer: new players and therapeutic avenues. Nat Rev Cancer. 2018;18(1):51–63. doi: 10.1038/nrc.2017.104 [DOI] [PubMed] [Google Scholar]
- [35].Khot A, Brajanovski N, Cameron DP, et al. First-in-human RNA polymerase I transcription inhibitor CX-5461 in patients with advanced hematologic cancers: results of a phase I dose-escalation study. Cancer Discov. 2019;9(8):1036–1049. doi: 10.1158/2159-8290.CD-18-1455 [DOI] [PubMed] [Google Scholar]
- [36].Peltonen K, Colis L, Liu H, et al. A targeting modality for destruction of RNA polymerase I that possesses anticancer activity. Cancer Cell. 2014;25(1):77–90. doi: 10.1016/j.ccr.2013.12.009 [DOI] [PMC free article] [PubMed] [Google Scholar]
- [37].Musso L, Mazzini S, Rossini A, et al. C-MYC G-quadruplex binding by the RNA polymerase I inhibitor BMH-21 and analogues revealed by a combined NMR and biochemical approach. Biochim Biophys Acta Gen Subj. 2018;1862(3):615–629. doi: 10.1016/j.bbagen.2017.12.002 [DOI] [PubMed] [Google Scholar]
- [38].Jacobs RQ, Huffines AK, Laiho M, et al. The small-molecule BMH-21 directly inhibits transcription elongation and DNA occupancy of RNA polymerase I in vivo and in vitro. J Biol Chem. 2022;298(1):101450. doi: 10.1016/j.jbc.2021.101450 [DOI] [PMC free article] [PubMed] [Google Scholar]
- [39].Conroy T, Desseigne F, Ychou M, et al. FOLFIRINOX versus gemcitabine for metastatic pancreatic cancer. N Engl J Med. 2011;364(19):1817–1825. doi: 10.1056/NEJMoa1011923 [DOI] [PubMed] [Google Scholar]
- [40].Conroy T, Hammel P, Hebbar M, et al. FOLFIRINOX or gemcitabine as adjuvant therapy for pancreatic cancer. N Engl J Med. 2018;379(25):2395–2406. doi: 10.1056/NEJMoa1809775 [DOI] [PubMed] [Google Scholar]
- [41].Bruno PM, Liu Y, Park GY, et al. A subset of platinum-containing chemotherapeutic agents kills cells by inducing ribosome biogenesis stress. Nat Med. 2017;23(4):461–471. doi: 10.1038/nm.4291 [DOI] [PMC free article] [PubMed] [Google Scholar]
- [42].Ozdian T, Holub D, Maceckova Z, et al. Proteomic profiling reveals DNA damage, nucleolar and ribosomal stress are the main responses to oxaliplatin treatment in cancer cells. J Proteomics. 2017;162:73–85. doi: 10.1016/j.jprot.2017.05.005 [DOI] [PubMed] [Google Scholar]
- [43].Sutton EC, DeRose VJ. Early nucleolar responses differentiate mechanisms of cell death induced by oxaliplatin and cisplatin. J Biol Chem. 2021;296:100633. doi: 10.1016/j.jbc.2021.100633 [DOI] [PMC free article] [PubMed] [Google Scholar]
- [44].Gadal O, Mariotte-Labarre S, Chedin S, et al. A34.5, a nonessential component of yeast RNA polymerase I, cooperates with subunit A14 and DNA topoisomerase I to produce a functional rRNA synthesis machine†. Mol Cell Biol. 1997;17(4):1787–1795. doi: 10.1128/MCB.17.4.1787 [DOI] [PMC free article] [PubMed] [Google Scholar]
- [45].El Hage A, French SL, Beyer AL, et al. Loss of topoisomerase I leads to R-loop-mediated transcriptional blocks during ribosomal RNA synthesis. Genes Dev. 2010;24(14):1546–1558. doi: 10.1101/gad.573310 [DOI] [PMC free article] [PubMed] [Google Scholar]
- [46].Silverstein RA, Gonzalez de Valdivia E, Visa N. The incorporation of 5-fluorouracil into RNA affects the ribonucleolytic activity of the exosome subunit Rrp6. Mol Cancer Res. 2011;9(3):332–340. doi: 10.1158/1541-7786.MCR-10-0084 [DOI] [PubMed] [Google Scholar]
- [47].Abraham KJ, Khosraviani N, Chan JNY, et al. Nucleolar RNA polymerase II drives ribosome biogenesis. Nature. 2020;585(7824):298–302. doi: 10.1038/s41586-020-2497-0 [DOI] [PMC free article] [PubMed] [Google Scholar]
- [48].Loukopoulos P, Kanetaka K, Takamura M, et al. Orthotopic transplantation models of pancreatic adenocarcinoma derived from cell lines and primary tumors and displaying varying metastatic activity. Pancreas. 2004;29(3):193–203. doi: 10.1097/00006676-200410000-00004 [DOI] [PubMed] [Google Scholar]
- [49].Shojaee S, Caeser R, Buchner M, et al. Erk negative feedback control enables pre-B cell transformation and represents a therapeutic target in acute lymphoblastic leukemia. Cancer Cell. 2015;28(1):114–128. doi: 10.1016/j.ccell.2015.05.008 [DOI] [PMC free article] [PubMed] [Google Scholar]
- [50].Unni AM, Harbourne B, Oh MH, et al. Hyperactivation of ERK by multiple mechanisms is toxic to RTK-RAS mutation-driven lung adenocarcinoma cells. Elife. 2018;7: doi: 10.7554/eLife.33718 [DOI] [PMC free article] [PubMed] [Google Scholar]
- [51].Leung GP, Feng T, Sigoillot FD, et al. Hyperactivation of MAPK signaling is deleterious to RAS/RAF-mutant melanoma. Mol Cancer Res. 2019;17(1):199–211. doi: 10.1158/1541-7786.MCR-18-0327 [DOI] [PubMed] [Google Scholar]
- [52].Wu PK, Hong SK, Park JI. Steady-state levels of phosphorylated mitogen-activated protein kinase kinase 1/2 determined by mortalin/HSPA9 and protein phosphatase 1 alpha in KRAS and BRAF tumor cells. Mol Cell Biol. 2017;37(18). doi: 10.1128/MCB.00061-17 [DOI] [PMC free article] [PubMed] [Google Scholar]
- [53].Zafra MP, Parsons MJ, Kim J, et al. An in vivo kras allelic series reveals distinct phenotypes of common oncogenic variants. Cancer Discov. 2020;10(11):1654–1671. doi: 10.1158/2159-8290.CD-20-0442 [DOI] [PMC free article] [PubMed] [Google Scholar]
- [54].Milanovic M, Fan DNY, Belenki D, et al. Senescence-associated reprogramming promotes cancer stemness. Nature. 2018;553(7686):96–100. doi: 10.1038/nature25167 [DOI] [PubMed] [Google Scholar]
- [55].Kolodkin-Gal D, Roitman L, Ovadya Y, et al. Senolytic elimination of Cox2-expressing senescent cells inhibits the growth of premalignant pancreatic lesions. Gut. 2022;71(2):345–355. doi: 10.1136/gutjnl-2020-321112 [DOI] [PMC free article] [PubMed] [Google Scholar]
- [56].Haugstetter AM, Loddenkemper C, Lenze D, et al. Cellular senescence predicts treatment outcome in metastasised colorectal cancer. Br J Cancer. 2010;103(4):505–509. doi: 10.1038/sj.bjc.6605784 [DOI] [PMC free article] [PubMed] [Google Scholar]
- [57].Igelmann S, Lessard F, Uchenunu O, et al. A hydride transfer complex reprograms NAD metabolism and bypasses senescence. Mol Cell. 2021;81(18):3848–65 e19. doi: 10.1016/j.molcel.2021.08.028 [DOI] [PubMed] [Google Scholar]
- [58].Subramanian A, Tamayo P, Mootha VK, et al. Gene set enrichment analysis: a knowledge-based approach for interpreting genome-wide expression profiles. Proc Natl Acad Sci U S A. 2005;102(43):15545–15550. doi: 10.1073/pnas.0506580102 [DOI] [PMC free article] [PubMed] [Google Scholar]
Associated Data
This section collects any data citations, data availability statements, or supplementary materials included in this article.
Supplementary Materials
Data Availability Statement
Phosphoproteomics data have been deposited to the ProteomeXchange Consortium via the PRIDE partner repository with the dataset identifier P×D032257and 10.6019/PXD032257: Username: reviewer_pxd032257@ebi.ac.uk, Password: ldqHSuTW. Microarray data were deposited in NCBI’s Gene Expression Omnibus (GEO) and are accessible through GEO Series accession number GSE57566. Clinical data regarding tissues used for IHC cannot be shared according to the agreement with Partners Healthcare to protect patient’s privacy. Source data for all figures can be provided upon reasonable request to the corresponding author.