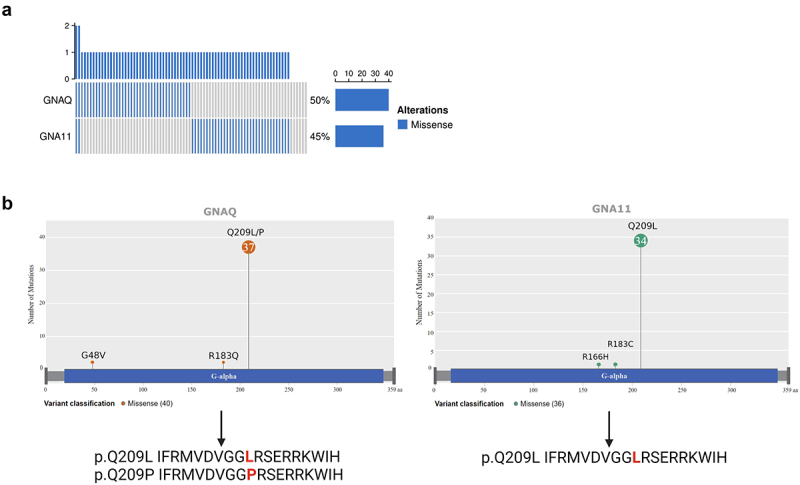
Figure 1.

GNAQ and GNA11 mutations in TCGA UM samples.
a) Mutational status of GNAQ and GNA11 genes. Bar plot shows mutated patients in blue and wild type in gray. The frequency of alterations is 50% for GNAQ and 45% for GNA11. b) Lollipop plot showing GNAQ and GNA11 mutations across the proteins and resulting peptides harboring Q209P and Q209L mutations. Amino acid changes are marked in red.
