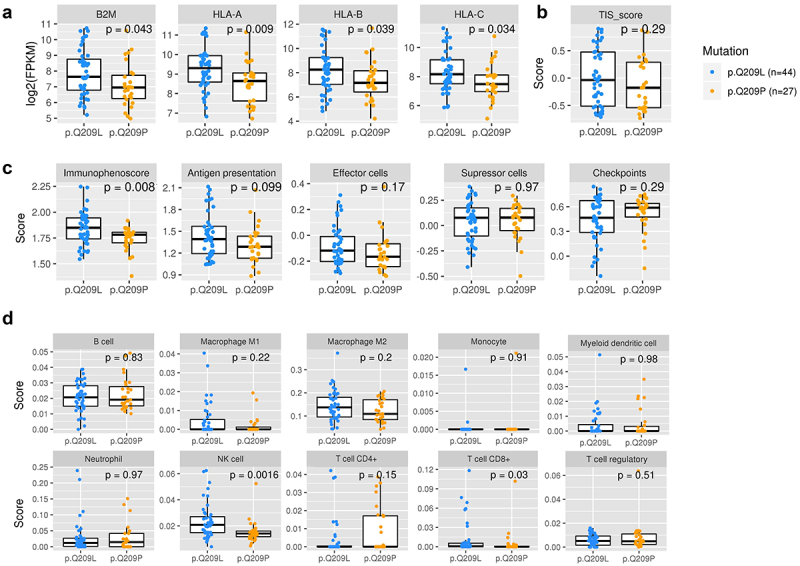
Figure 7.

Characterization of immune state in patients carrying Q209L variant and Q209P variant.
a) Levels of expression of antigen presenting genes B2M, HLA-A, HLA-B, and HLA-C. (b) T cell inflammatory signaling (TIS) score. c) Immunophenoscore (IPS), antigen presentation, effector cells, suppressor cells, and checkpoints scores. d) Immune cell infiltration. The Wilcoxon test was used to calculate statistically significant differences (p-value <0.05).
