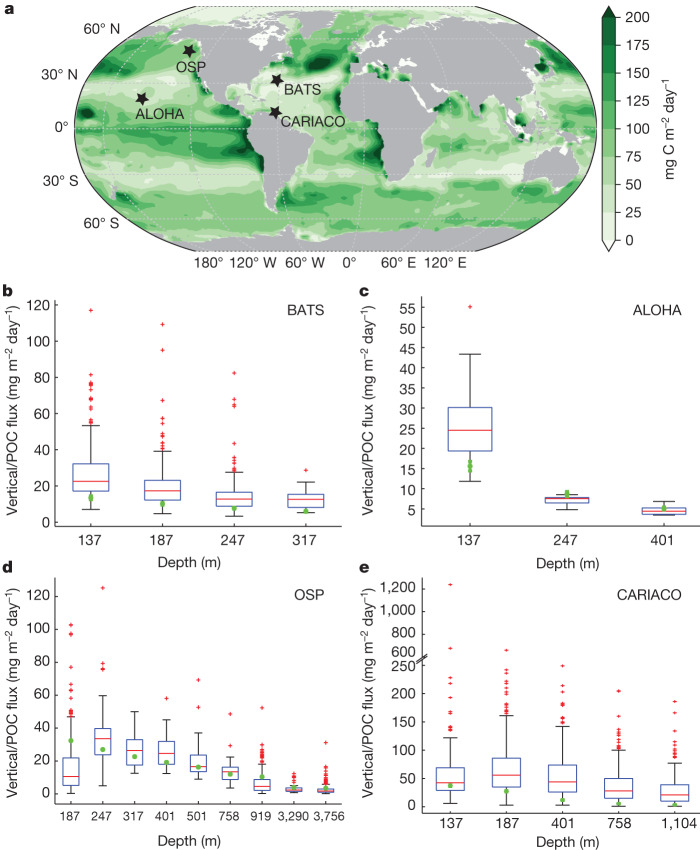
Fig. 2. Non-advective-diffusive vertical flux.
a, Contour plot of non-advective-diffusive vertical flux (mg C m−2 day−1) exiting the base of the euphotic zone, with the location of the four ocean stations (OSP, ALOHA, BATS and CARIACO) marked with black stars. b–e, Model-derived non-advective-diffusive vertical flux at different depths compared with trap-determined POC flux. The box plots represent sediment trap and the green circles are model predictions, with error bars representing ±1σ derived from different model configurations. The box plots summarize the distributions of in situ measurements of POC flux, which show the 25th, 50th and 75th percentiles binned according to the POC flux. The whiskers cover 99.3% of the data, with the remaining points shown as red crosses. In b–e, the sediment-trap data presented are multiyear collections covering a sampling period of 1988–2011 for the BATS station, 1988–2010 for the ALOHA station, 1987–2006 for the OSP and 1995–2012 for the CARIACO station. Because sediment traps are deployed in the water for several months, their measurements represent an average for a relatively extended period instead of a snapshot. The results of a are based on the CbPM NPP product and an e-folding remineralization time of 12 h for labile DOC.

