Abstract
Introduction
Many clinical studies reported the coexistence of Alzheimer’s disease (AD) and multiple sclerosis (MS), but the common molecular signature between AD and MS remains elusive. The purpose of our study was to explore the genetic linkage between AD and MS through bioinformatic analysis, providing new insights into the shared signatures and possible pathogenesis of two diseases.
Methods
The common differentially expressed genes (DEGs) were determined between AD and MS from datasets obtained from Gene Expression Omnibus (GEO) database. Further, functional and pathway enrichment analysis, protein-protein interaction network construction, and identification of hub genes were carried out. The expression level of hub genes was validated in two other external AD and MS datasets. Transcription factor (TF)-gene interactions and gene-miRNA interactions were performed in NetworkAnalyst. Finally, receiver operating characteristic (ROC) curve analysis was applied to evaluate the predictive value of hub genes.
Results
A total of 75 common DEGs were identified between AD and MS. Functional and pathway enrichment analysis emphasized the importance of exocytosis and synaptic vesicle cycle, respectively. Six significant hub genes, including CCL2, CD44, GFAP, NEFM, STXBP1, and TCEAL6, were identified and verified as common hub genes shared by AD and MS. FOXC1 and hsa-mir-16-5p are the most common TF and miRNA in regulating hub genes, respectively. In the ROC curve analysis, all hub genes showed good efficiency in helping distinguish patients from controls.
Conclusion
Our study first identified a common genetic signature between AD and MS, paving the road for investigating shared mechanism of AD and MS.
Keywords: Alzheimer’s disease, Bioinformatics, Differentially expressed genes, Hub gene, Multiple sclerosis
Introduction
Multiple sclerosis (MS) is a chronic inflammatory neurodegenerative disease characterized by demyelination and neuronal degeneration in the central nervous system (CNS). It is estimated that about 2.3 million people are suffered from MS globally [1], and its prevalence increases along with latitude [2]. With the increase in the overall survival of MS patients during past decades, they might be affected by age-related diseases, especially Alzheimer’s disease (AD) [3]. In an internet-based self-report survey study, authors examined comorbidities in MS patients, and they found patients with MS were likely to report coexistence of AD (10/549; 2%) than individuals without MS (77/74,451; 0.1%; p < 0.001) [4]. In a previous study, a proportion of MS patients (11/67) showed evidence of AD with brain lesions including amyloid plaques and neurofibrillary tangles fulfilling the criteria for neuropathological diagnosis [5]. In addition, the coexistence of MS and AD was also reported by other researchers [6, 7]. However, the knowledge gap regarding the molecular association between AD and MS remains elusive. Thus, it is instrumental to uncover the pathophysiological and genetic mechanisms linking AD and MS.
Despite AD and MS being fundamentally different, there are shared cellular and molecular mechanisms between two diseases [3]. First, neuroinflammation is considered as an important part in the pathogenesis of both AD and MS [8–10]. It is well established that inflammation is presented in MS lesions [11]. Similarly, CNS inflammation, especially aberrant microglial activation, plays an essential role in the pathogenesis of AD [12]. Second, mitochondrial injury and energy deficiency are indicated as possible mechanisms in the pathogenesis of both AD and MS [3, 8]. In active MS lesions, mitochondrial injury leads to axonal transportation disturbance [13], oligodendrocyte apoptosis [14], and failure to remyelination [15]. In AD, mitochondrial damage is also presented in neurons, which is caused by reactive oxygen species produced through chronic microglial activation and defective mitochondria themselves [8]. Moreover, reactive astrocytes play positive and negative role in regulating neuronal function and cognition in AD and are closely associated with myelination and oligodendrocyte progenitor cells differentiation in MS [16]. Glial fibrillary acidic protein (GFAP), a classical biomarker of astrocytes, is used for the diagnosis and prognosis of AD and MS [17].
Taken together, it suggests there is a shared pathophysiological and genetic mechanism between AD and MS but requires further investigation. In this study, we selected gene expression datasets of brain tissue samples but not peripheral blood and determined the differentially expressed genes (DEGs) between controls and patients. Biological function and pathway enrichment analysis, protein-protein interaction (PPI) network construction, and hub gene identification plus validation were carried in the present study. Our work aimed at understanding the genetic linkage between AD and MS through bioinformatic analysis and providing novel insights into the comorbid pathogenesis of the disorders. For the first time, we identified common molecular signatures between AD and MS, which might provide new insights into the shared mechanisms of the two diseases.
Methods
Data Collection and Preprocessing
We manually selected related gene expression datasets of brain tissue but not peripheral blood from Gene Expression Omnibus (GEO) (https://www.ncbi.nlm.nih.gov/geo/) database of the National Center for Biotechnology Information (NCBI). One dataset of MS (GSE108000) and 4 datasets (GSE132903, GSE15222, GSE122063, and GSE118553) of AD were included in our study, and detailed information about these datasets is summarized in Table 1. The characteristics of patients of each dataset are summarized in online supplementary Table 1 (for all online suppl. material, see https://doi.org/10.1159/000533397). We used the corresponding annotation document of each dataset to map probes to gene symbols. If multiple probes corresponded to the same gene, the mean expression value was adopted.
Table 1.
Description of included datasets
Identification of DEGs
We identified the DEGs of each dataset using the online analysis tool GEO2R (https://www.ncbi.nlm.nih.gov/geo/geo2r/). GEOquery and Limma R packages are the basis of GEO2R and are used to read data and determine DEGs, respectively. For differential analysis visualization, volcano plots were drawn through ggplot2 package. Then we integrated the DEGs in each dataset of AD using R package “RobustRankAggreg (RRA).” p value <0.05 and |log2 fold change (FC)| > 0.05 were considered as the cutoff criteria for determining DEGs. Heatmap of top 10 upregulated and downregulated genes in RRA analysis was generated using heatmap package. DEGs obtained in AD and MS were intersected through Venn diagram, and the plot presenting common DEGs was generated by a web tool (http://bioinformatics.psb.ugent.be/webtools/Venn/).
Functional and Pathway Enrichment Analysis of Common DEGs
For biological function enrichment analysis, Gene Ontology (GO) analysis including biological processes, cellular component (CC), and molecular function (MF) terms was performed through R package “clusterProfiler.” Kyoto Encyclopedia of Genes and Genomes (KEGG) pathway enrichment analysis was also carried out using “clusterProfiler” package. p value <0.05 was considered as the cutoff criterion. The GO analysis result was divided into three components and visualized in a bubble map. The top 15 significant KEGG pathways were presented in a bar plot drawn by ggplot2 package.
PPI Network Construction and Hub Gene Identification
PPI network was constructed in Search Tool for the Retrieval Interacting Genes (STRING, https://string-db.org), and the minimum interaction score was set above 0.4 (medium confidence). The PPI network was inputted and visualized in Cytoscape (3.9.1) software, and hub genes were identified with CytoHubba plug-in in the software. The top 10 genes were calculated in 5 methods, including maximal clique centrality, the density of maximum neighborhood component, maximum neighborhood component, edge percolated component, and degree. Finally, we intersected the genes of the five algorithms and determined genes common in at least 4 of all 5 algorithms as hub genes. The intersection plot of top genes was generated using a web tool (http://www.bioinformatics.com.cn/plot_basic_upsetR_plot_009).
Validation of Hub Genes in External Datasets
The expression level of identified hub genes was further validated in other external GEO datasets. The GSE109887 dataset [18] consists of 46 samples of middle temporal gyrus from AD patients and 32 middle temporal gyrus samples from age-matched controls. GSE135511 [19] contains brain samples from 20 postmortem MS patients and 10 non-neurological controls. Comparison between each group in two datasets was performed with T test, and p value <0.05 is considered as significantly different.
Transcription Factor-Gene Interactions
The JASPAR database (http://jaspar.genereg.net) was developed to provide an integrative analysis of transcription factor (TF)-gene interactions. We applied JASPAR database through NetworkAnalyst online tool (https://www.networkanalyst.ca) to find TF-gene interaction of verified hub genes.
Gene-miRNA Interactions
To investigate the miRNA-related regulatory mechanism linking AD and MS, gene-miRNA interaction of validated hub gene was performed in TarBase v8 [20] via NetworkAnalyst web tool.
Receiver Operating Characteristic Curve Analysis
To evaluate the predictive value of hub genes, receiver operating characteristic (ROC) curve analysis was performed to judge the potential of validated hub genes as diagnostic biomarkers between disease and control samples. The AD dataset GSE109887 and MS dataset GSE135511 were used for ROC curve analysis. Based on the gene expression values of hub genes, the ROC curves were generated through the pROC package in R. Diagnostic value of each hub gene was measured by the area under curve (AUC).
Results
DEGs Identification and Common DEGs between AD and MS
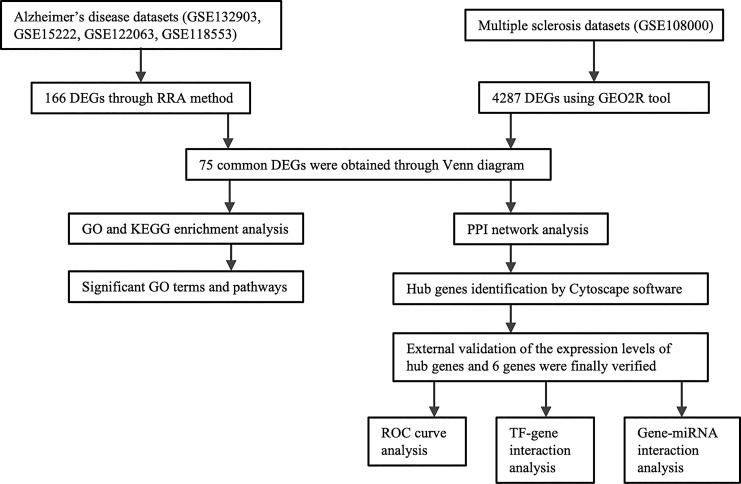
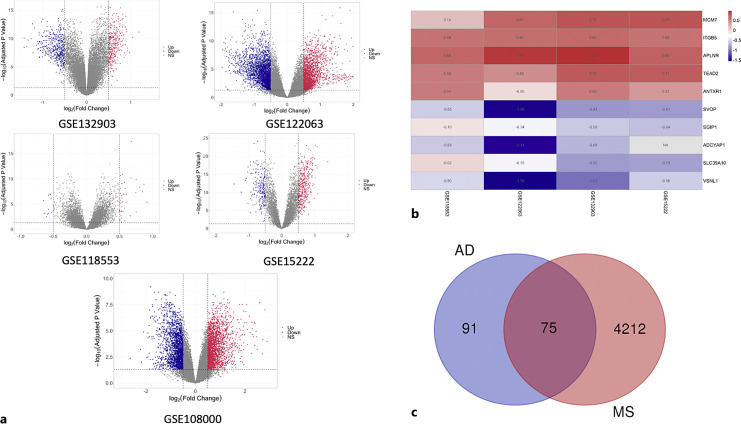
A research flowchart of this study is presented in Figure 1. A total of 59, 6141, 774, and 688 DEGs were identified in AD datasets of GSE118553, GSE122063, GSE132903, and GSE15222, respectively, while a total of 4287 DEGs were identified in the MS dataset, GSE108000. The up- or downregulated genes of each dataset were visualized by volcano plots shown in Figure 2a and summarized in the online supplementary Table 2. Then, we applied the RRA method to integrate four AD datasets (GSE118553, GSE122063, GSE132903, and GSE15222), in which 166 significant DEGs containing 74 up- and 92 downregulated genes were determined through integrative analysis (online suppl. Table 3). The heatmap presenting the top 5 upregulated genes and top 5 downregulated genes is shown in Figure 2b. Further, we identified the overlapping DEGs between significant DEGs of four AD datasets and the MS dataset GSE108000 using Venn plot. As shown in Figure 2c, 75 DEGs were identified in common between AD and MS (online suppl. Table 4).
Fig. 1.
Research flowchart of the current study.
Fig. 2.
DEGs identification in each dataset and common DEGs between AD and MS. a The volcano plots show the expression pattern of DEGs in each dataset. Red: significantly upregulated; blue: significantly downregulated; gray: no significant difference. b Heatmap of the top 5 upregulated (red) and the top 5 downregulated DEGs (blue) determined by RRA method in the four AD datasets. c Venn plot of common DEGs between AD and MS.
Functional and Pathway Enrichment Analysis of Common DEGs
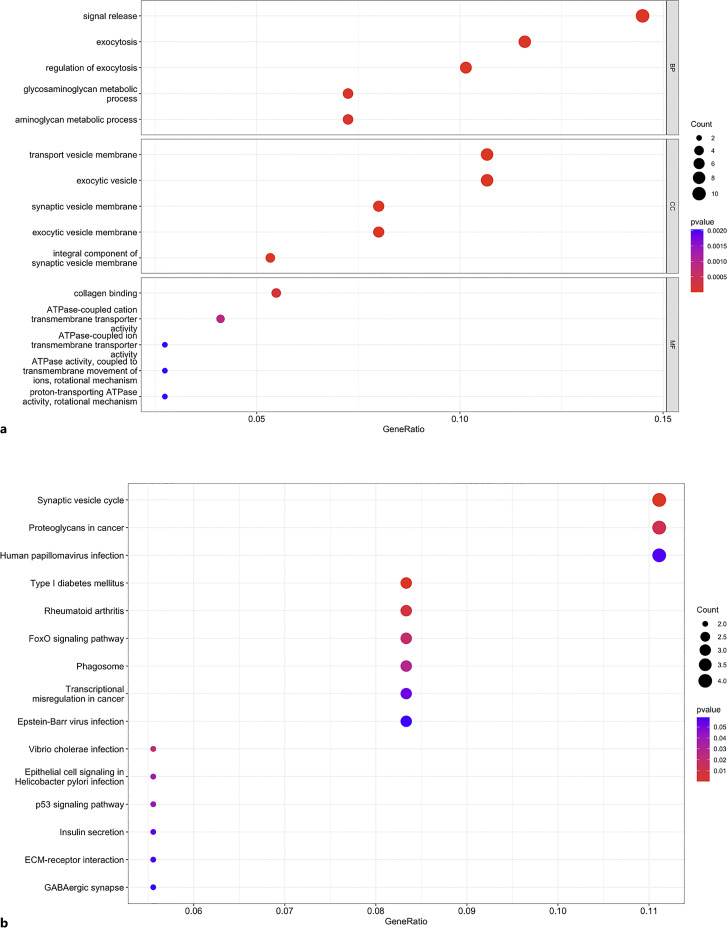
The GO enrichment analysis results were divided into three components (BP, CC, and MF). In the BP category, the DEGs were significantly enriched in signal release, exocytosis, regulation of exocytosis, glycosaminoglycan metabolic process, and aminoglycan metabolic process. For CC, the genes were mainly enriched in transport vesicle membrane, exocytic vesicle, synaptic vesicle membrane, exocytic vesicle membrane, and integral component of the synaptic vesicle membrane. In terms of MF, DEGs were enriched in collagen binding, ATPase-coupled cation transmembrane transporter activity, and ATPase-coupled ion transmembrane transporter activity, etc. (Fig. 3a; online suppl. Table 5).
Fig. 3.
Functional and pathway enrichment analysis of common DEGs. a Top 5 terms in the BP, CC, and MF category of GO enrichment analysis. b Top 15 KEGG pathway enrichment results.
The top 15 KEGG pathways of shared genes between AD and MS were enriched in synaptic vesicle cycle, proteoglycans in cancer, human papillomavirus infection, type I diabetes mellitus (DM), rheumatoid arthritis (RA), FoxO signaling pathway, phagosome, epithelial cell signaling in Helicobacter pylori infection, p53 signaling pathway, transcriptional misregulation in cancer, insulin secretion, Epstein-Barr virus (EBV) infection, vibrio cholera infection, ECM-receptor interaction, and GABAergic synapse (Fig. 3b; online suppl. Table 6).
PPI Network Construction and Hub Gene Identification
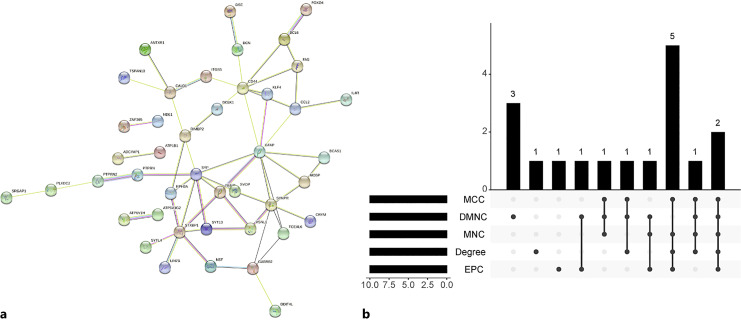
Figure 4a shows the PPI network of the 75 common DEGs between AD and MS. Disconnected nodes in this network were removed. The constructed PPI network comprised 74 nodes and 57 edges, and the PPI enrichment p value is 2.23e−10. We used five algorithms (maximal clique centrality, density of maximum neighborhood component, maximum neighborhood component, degree, and edge percolated component) of plug-in CytoHubba and intersected the top 10 nodes in each algorithm to determine the hub genes (Fig. 4b; online suppl. Table 7). We determined 8 common hub genes contained in at least 4 algorithms of all five algorithms, including CCL2, CD44, GFAP, NEFM, STXBP1, SYNPR, SYP, and TCEAL6.
Fig. 4.
Protein-protein interaction (PPI) construction and hub gene identification through CytoHubba plug-in in Cytoscape software. a PPI network of the common DEGs between AD and MS. b Intersection plot of top 10 hub genes among the five algorithms.
Validation of Hub Genes in External Datasets
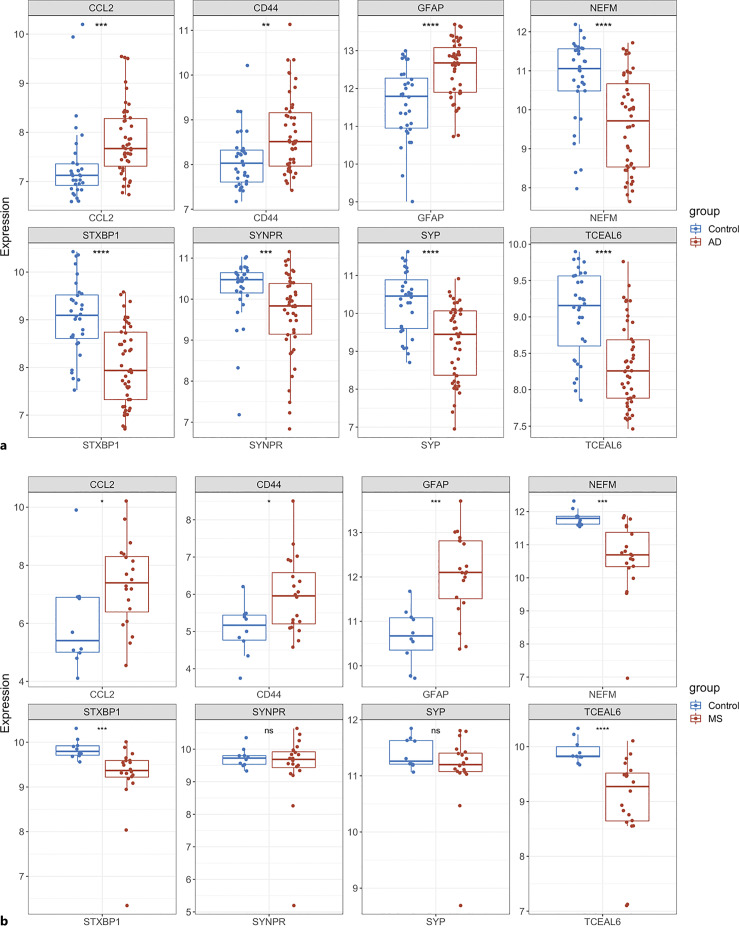
In order to validate the reliability of identified hub genes, we selected two other AD and MS datasets and analyzed the expression level of each hub gene in these datasets. As compared with the control group, CCL2, CD44, and GFAP were significantly upregulated, but NEFM, STXBP1, and TCEAL6 were significantly downregulated in both AD and MS patients, respectively (Fig. 5a, b). SYNPR and SYP were significantly downregulated in the AD group, but they were not significant in the MS group (Fig. 5a, b). Table 2 describes the gene name and its function of each hub gene.
Fig. 5.
Validation of expression of hub genes in two external datasets. a Expression level of hub genes in AD dataset, GSE109887. b Expression level of hub genes in MS dataset, GSE135511. The comparison between the two sets of data uses the T test. p value <0.05 was considered statistically significant. ns, not significant. *p < 0.05; **p < 0.01; ***p < 0.001; ****p < 0.0001.
Table 2.
Details of verified hub genes
| Gene symbol | GeneCards identifier | Full name | Gene-related diseases |
|---|---|---|---|
| CCL2 | GC17P034255 | C-C motif chemokine ligand 2 | Neural tube defects, human immunodeficiency virus type 1, arteriosclerosis, severe acute respiratory syndrome, proliferative glomerulonephritis |
| GFAP | GC17M044917 | Glial fibrillary acidic protein | Alexander disease, central neurocytoma, astroblastoma, myxopapillary ependymoma, gliomatosis cerebri |
| CD44 | GC11P035139 | CD44 molecule | Superficial keratitis, intraductal papilloma, acute monoblastic leukemia, malignant pleural mesothelioma, congenital dyserythropoietic anemia |
| NEFM | GC08P024913 | Neurofilament medium chain | Charcot-Marie-Tooth disease, motor neuron disease, Down syndrome, Wallerian degeneration |
| STXBP1 | GC09P127590 | Syntaxin-binding protein 1 | Developmental and epileptic encephalopathy 4, infantile epilepsy syndrome, tremor, STXBP1-related encephalopathy, West syndrome |
| TCEAL6 | GC0XM102139 | Transcription elongation factor A like 6 | Severe congenital neutropenia 7, Pelizaeus-Merzbacher disease, hypomyelinating leukodystrophy |
Transcription Factor-Gene Interactions
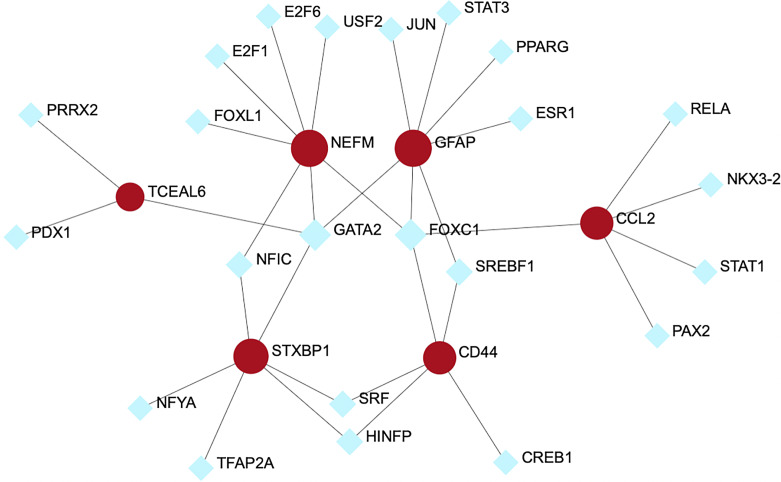
The TF-gene interaction network is presented in Figure 6, which is comprised 23 TFs and 6 verified common hub genes. As shown in Figure 6, NEFM and GFAP were the genes regulated by most TFs, which could be regulated by 7 TFs. On the other hand, FOXC1 is the most common transcriptional regulator for hub genes, including CCL2, CD44, NEFM, and GFAP.
Fig. 6.
TF-gene interaction network of common hub genes shared by AD and MS.
Gene-miRNA Interaction
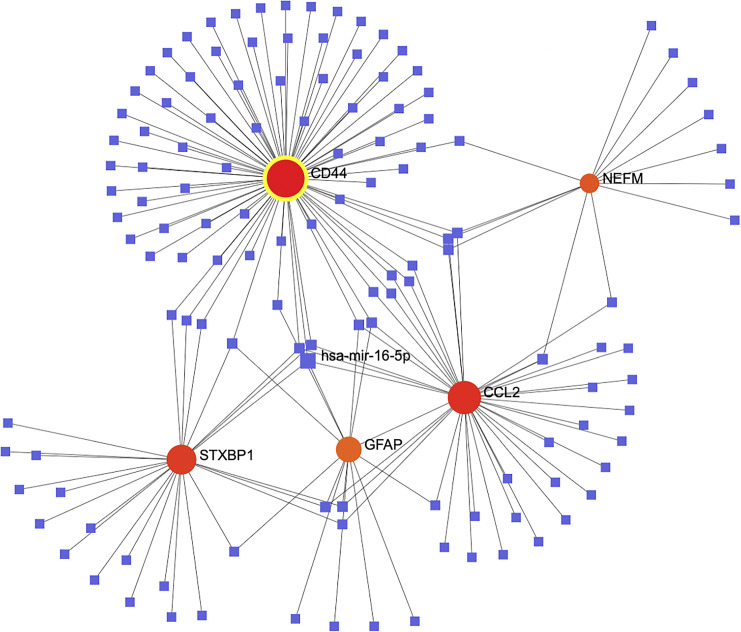
Based on TarBase v8 database, we established a Gene-miRNA interaction network, consisting of 129 miRNAs and 5 of 6 validated common genes (Fig. 7). The topological analysis revealed that CD44 was the gene with the highest degree, which was regulated by 78 miRNAs. In addition, hsa-mir-16-5p is the most common miRNA in regulating hub genes linking AD and MS, including CCL2, CD44, STXBP1, and GFAP.
Fig. 7.
Gene-miRNA interaction network of common hub genes shared by AD and MS.
Receiver Operating Characteristic Curve Analysis
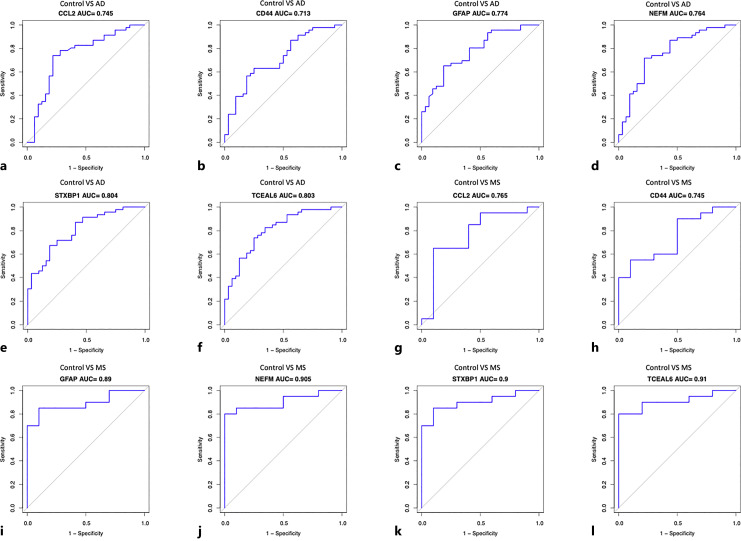
ROC curve analysis was carried out to determine the capacity of hub genes as biomarkers distinguishing AD and MS patients from controls. The AUC values of all the validated hub genes in AD and MS were greater than 0.7, among which STXBP1 and TCEAL6 had the highest AUC in AD and MS, 0.804 and 0.91, respectively (Fig. 8e, l). The results indicate a good efficiency of these validated common genes in helping distinguish patients from controls (Fig. 8a–l). The AUC values of combining two or three hub genes were slightly higher than that of one single hub gene only (online suppl. Fig. 1A–D).
Fig. 8.
ROC curve analysis evaluates the sensitivity and specificity of six hub genes as predictive biomarkers for AD and MS diagnosis. CCL2 in AD (a); CD44 in AD (b); GFAP in AD (c); NEFM in AD (d); STXBP1 in AD (e); TCEAL6 in AD (f); CCL2 in MS (g); CD44 in MS (h); GFAP in MS (i); NEFM in MS (j); STXBP1 in MS (k); TCEAL6 in MS (l).
Discussion
AD and MS are two common neurodegenerative diseases, and the relationship between AD and MS is tightly closed according to previous studies [6, 7]. Yet, many published studies are limited in clinical symptoms and co-disease case reports. Therefore, our study aimed to investigate the pathophysiological and genetic mechanisms linking MS and AD from the perspective in silico. In the present study, we identified 75 common DEGs shared by AD and MS, which were enriched in exocytosis, synaptic vesicle cycle, ATPase-related pathways, etc. Through hub gene identification and validation, six hub genes including CCL2, CD44, GFAP, NEFM, STXBP1, and TCEAL6 were finally determined. TF-gene interaction network and gene-miRNA network were constructed based on these hub genes. Furthermore, we conducted ROC curve analysis for the above hub genes, and all the genes showed a good efficiency in distinguishing patients from controls (AUC > 0.7).
Whether AD is a cause or consequence in MS remains unclear. However, Dal Bianco et al. [6] found that in 8 patients with both MS and AD, the density of β-amyloid plaques and neurofibrillary tangles were not significantly different in demyelinated and non-demyelinated cortical areas, suggesting immune dysfunction in MS does not appear to influence the development of AD. However, Frischer et al. [5] reported that there was significantly more acute axonal injury in the cortex and white matter of pathologically inactive MS patients with AD compared to pathologically inactive MS patients without AD, suggesting that concomitant brain damage due to AD may cause functional deficits even when MS disease progression has stopped. These findings, to some extent, indicate AD may increase the risk of MS progression in patients with pathologically inactive lesions.
Since the lesion sites of both diseases are mainly located in the CNS, we restricted our selection of datasets to brain tissue samples. ATPase-related pathways are the main changes shared by AD and MS through GO enrichment analysis, indicating mitochondrial dysfunction may be an important pathogenetic mechanism for both AD and MS. It was reported that neuronal mitochondrial injury occurred in both AD and MS [8]. Therefore, our study provides a shred of the powerful evidence for the relationship between AD and MS. EBV infection is also one of the top KEGG pathways. It has been suggested that EBV plays an essential role in the progression of MS, which evades the human immune system through latent infection in B memory cells [21]. In theory, CNS-autoreactive T cells may be activated by EBV-infected B cells in the periphery and CNS, which may contribute to persistent neuroinflammation and CNS injury [21]. In mild cognitive impairment (MCI, the pre-stage of AD) patients infected with EBV, elevated EBV antibody level is associated with cognitive dysfunction, suggesting a potential role of chronic EBV infection in the progression of AD [22]. Another potentially related indicator from clinical perspective could be autoimmune comorbidities such as RA and DM, which were found to be related to these two diseases from the KEGG pathway enrichment analysis of our research. It is documented that the presence of RA or DM can increase the risk for MS [23, 24] as well as AD [25, 26], respectively. Thus, risk factor (like EBV infection) and comorbidities (like RA and DM) should be noted in patients with AD or MS.
In TF-gene interaction network, FOXC1 was considered as a central regulatory TF because of its highest degree and betweenness score. Recent studies also identified FOXC1 as an important TF in regulating hub genes in AD based on bioinformatic methods [27, 28], which is consistent with our discovery. In a case report study, a FOXC1 variant in a female patient resulted in clinical and radiological traits resembling MS [29], indicating FOXC1 may play an essential role in the pathogenesis of MS. miRNAs play a critical role in regulating the expression of target genes [30]. We noticed that hsa-mir-16-5p was a central regulatory miRNA in the gene-miRNA network of both AD and MS. It was reported that hsa-mir-16-5p was downregulated in the brain tissue of late-onset AD patients [31].
GFAP is an astrocytic intermediate filament, widely recognized as a biomarker of astrocytes [32]. Astrocytes constitute about 30–40% of cells in the CNS, which provide interactions with other cells and contribute to the establishment and regulation of the blood-brain barrier [16]. In AD patients, GFAP levels were significantly increased as compared with that of cognitively healthy individuals [33]. Interestingly, Asken et al. [34] reported that a linear, positive correlation between the plasma GFAP level and cortical β-amyloid (Aβ) was observed in early AD patients but diverged in more severe disease stages. In a prospective study involving 504 participants, the plasma GFAP is an early biomarker reflecting brain Aβ burden but not tau aggregation, even in the very early stage of AD [35]. Another recent study revealed that serum GFAP could be used as a biomarker to distinguish AD from frontotemporal dementia and predict MCI-to-dementia conversion [36]. Similarly, cerebrospinal fluid (CSF) and peripheral blood GFAP levels were also significantly increased in MS patients as compared with that of the control group, which were correlated closely with inflammatory disease activity [37]. In our current study, the expression level of GFAP in the brain was higher in AD and MS patients than in the control, suggesting GFAP may be a useful biomarker for the diagnosis and prognosis prediction of AD and MS.
CCL2 is a microglial and monocyte chemokine [38]. CCR2, the receptor of CCL2, was closely associated with the progression of AD [38, 39]. In a transgenic mouse model of AD, CCR2 deficiency led to the impairment of mononuclear phagocytes, then promoted early disease progression [39]. Due to the lack of microglial infiltration at lesion sites, the clearance of Aβ is impaired, suggesting that CCR2+ microglia can be protective in AD [39]. In a longitudinal study of MCI-AD cohort, baseline level of CSF CCL2 was correlated to longitudinal cognitive impairment and functional decline in MCI-AD, indicating CCL2 can be used as a biomarker of neurodegeneration and cognitive decline [40]. Conductier et al. [41] reported that the expression of CCL2 was upregulated in acute and chronic MS lesion, which was in agreement with our discovery. In chronic experimental autoimmune encephalomyelitis (EAE, an animal model for MS) mice, low levels of CCL2 attenuated the severity of EAE through downregulation of Th1/Th17 cells and induction of highly functional regulatory T cells [42]. Taken together, CCL2 is very likely to play an essential part in the development of AD and MS.
CD44 is a multifunctional glycoprotein expressed on the surface of various cells, which has been implicated in inflammation, cancer metastasis, and neuronal injuries [43]. In one study, the expression levels of CD44 splice variants, including CD44V3, CD44V6, and CD44V10, were significantly augmented in hippocampal tissues of AD patients as compared to those of non-AD controls [43]. In addition, several bioinformatic studies also identified CD44 as a common hub gene between AD and epilepsy [28] and shared by AD and type 2 diabetes [44]. In the study by Flynn et al. [45], CD44-deficient EAE mice exhibited greater disease severity. Possible mechanisms included proinflammatory cytokine production, decreased number of regulatory T cells, and increased permeability of blood-brain barrier [45]. Taken together, CD44 may be a crucial factor in the progression of AD and MS.
Neurofilament medium polypeptide (NEFM) is a subunit of neurofilament protein. In a multi-cohort study, the level of NEFM was increased in CSF from AD patients as compared with non-AD controls [46]. However, in our study, the expression level of NEFM was significantly lower in brain tissues of AD patients than in those of controls. This discrepancy may attribute to the limited sample size and different sample types. There are no reports concerning the role of NEFM in the pathogenesis of MS yet; thus, further research is required. STXBP1 is a critical protein for presynaptic vesicle release, whose mutation is closely associated with the neurodevelopmental disorder, STXBP1-encephalopathy (STXBP1-E) [47]. Nevertheless, the exact role of STXBP1 in AD and MS was inconclusive. TCEAL6, a member of the transcription elongation factor A like (TCEAL) gene family, was reported to modulate the progression of cervical cancer [48]. However, no studies regarding the impact of TCEAL6 on neurological diseases have been reported so far. Therefore, further investigation on STXBP1 and TCEAL6 involvement in the pathogenesis of AD and MS is requiring. Combined with cognitive dysfunction and pathological changes, the 6 verified hub genes can be considered as biomarkers to predict the occurrence of AD in MS patients.
Several limitations in our current study should also be noted. First, the selected datasets of AD varied in sample size, methodology, and sample preparation, which might cause potential bias. Second, since we selected brain tissue samples other than peripheral blood, the cohort size of MS is relatively small. A larger number of clinical samples are needed to confirm the conclusion. Finally, the conclusion of our study is mainly based on bioinformatic analysis without experimental validation. Therefore, further experimental and clinical studies are necessary in the future.
Conclusion
In our current study, we identified common molecular signatures between AD and MS for the first time, which may be helpful to elucidate the mechanism shared by AD and MS. CCL2, CD44, GFAP, NEFM, STXBP1, and TCEAL6 were identified and verified as hub genes, and they all showed good diagnostic efficiency in ROC curve analysis for both AD and MS. We found these 6 hub genes were not only differentially expressed in AD but also participated in pathogenesis of MS. Therefore, these 6 hub genes may be considered as potential biomarkers for predicting the occurrence and development of AD in MS patients. Our findings may provide a comprehensive understanding of the pathogenesis linking AD and MS, paving the road for investigating shared molecular mechanism of AD and MS in the future.
Statement of Ethics
Ethical approval was not required as this study was based on publicly available data.
Conflict of Interest Statement
The authors declare that they have no conflict of interest.
Funding Sources
This work was supported by grant to Jiang Y. from the National Natural Science Foundation of China (81671182) and the Natural Science Foundation of Guangdong Province (2016A030313228), and grants to Huang B. from the National Natural Science Foundation of China (81971470) and Shenzhen Municipal Science and Technology Innovation Program (JCY20190809143803732).
Author Contributions
Y.J. and F.P. contributed to the conception and design of this study. D.Y., B.H., M.G., B.Q., Z.S., and K.D. collected and organized the data. D.Y., B.H., M.G., F.P., and Y.J. drafted the manuscript. All the authors read and approved the final manuscript.
Funding Statement
This work was supported by grant to Jiang Y. from the National Natural Science Foundation of China (81671182) and the Natural Science Foundation of Guangdong Province (2016A030313228), and grants to Huang B. from the National Natural Science Foundation of China (81971470) and Shenzhen Municipal Science and Technology Innovation Program (JCY20190809143803732).
Data Availability Statement
All data generated or analyzed during this study are included in this article and its online supplementary material. Further inquiries can be directed to the corresponding author.
Supplementary Material
Supplementary Material
Supplementary Material
Supplementary Material
Supplementary Material
Supplementary Material
Supplementary Material
Supplementary Material
References
- 1. Browne P, Chandraratna D, Angood C, Tremlett H, Baker C, Taylor BV, et al. Atlas of Multiple Sclerosis 2013: a growing global problem with widespread inequity. Neurology. 2014;83(11):1022–4. [DOI] [PMC free article] [PubMed] [Google Scholar]
- 2. Dobson R, Giovannoni G. Multiple sclerosis: a review. Eur J Neurol. 2019;26(1):27–40. [DOI] [PubMed] [Google Scholar]
- 3. Luczynski P, Laule C, Hsiung GYR, Moore GRW, Tremlett H. Coexistence of multiple sclerosis and Alzheimer’s disease: a review. Mult Scler Relat Disord. 2019;27:232–8. [DOI] [PubMed] [Google Scholar]
- 4. Stewart M, Phillips A, Gupta S, Edwards N, Goren A. Comorbid illness among individuals with multiple sclerosis. In: Poster presented at the 83rd annual meeting of the American academy of neurology. Honolulu, Hawaii, USA; 2011. [Google Scholar]
- 5. Frischer JM, Bramow S, Dal-Bianco A, Lucchinetti CF, Rauschka H, Schmidbauer M, et al. The relation between inflammation and neurodegeneration in multiple sclerosis brains. Brain. 2009;132(Pt 5):1175–89. [DOI] [PMC free article] [PubMed] [Google Scholar]
- 6. Dal Bianco A, Bradl M, Frischer J, Kutzelnigg A, Jellinger K, Lassmann H. Multiple sclerosis and Alzheimer’s disease. Ann Neurol. 2008;63(2):174–83. [DOI] [PubMed] [Google Scholar]
- 7. Flanagan EP, Knopman DS, Keegan BM. Dementia in MS complicated by coexistent Alzheimer disease: diagnosis premortem and postmortem. Neurol Clin Pract. 2014;4(3):226–30. [DOI] [PMC free article] [PubMed] [Google Scholar]
- 8. Lassmann H. Mechanisms of neurodegeneration shared between multiple sclerosis and Alzheimer’s disease. J Neural Transm. 2011;118(5):747–52. [DOI] [PubMed] [Google Scholar]
- 9. Voet S, Prinz M, van Loo G. Microglia in central nervous system inflammation and multiple sclerosis pathology. Trends Mol Med. 2019;25(2):112–23. [DOI] [PubMed] [Google Scholar]
- 10. Xu L, He D, Bai Y. Microglia-mediated inflammation and neurodegenerative disease. Mol Neurobiol. 2016;53(10):6709–15. [DOI] [PubMed] [Google Scholar]
- 11. Lassmann H, Brück W, Lucchinetti CF. The immunopathology of multiple sclerosis: an overview. Brain Pathol. 2007;17(2):210–8. [DOI] [PMC free article] [PubMed] [Google Scholar]
- 12. Jevtic S, Sengar AS, Salter MW, McLaurin J. The role of the immune system in Alzheimer disease: etiology and treatment. Ageing Res Rev. 2017;40:84–94. [DOI] [PubMed] [Google Scholar]
- 13. Dutta R, McDonough J, Yin X, Peterson J, Chang A, Torres T, et al. Mitochondrial dysfunction as a cause of axonal degeneration in multiple sclerosis patients. Ann Neurol. 2006;59(3):478–89. [DOI] [PubMed] [Google Scholar]
- 14. Veto S, Acs P, Bauer J, Lassmann H, Berente Z, Setalo G Jr, et al. Inhibiting poly(ADP-ribose) polymerase: a potential therapy against oligodendrocyte death. Brain. 2010;133(Pt 3):822–34. [DOI] [PMC free article] [PubMed] [Google Scholar]
- 15. Ziabreva I, Campbell G, Rist J, Zambonin J, Rorbach J, Wydro MM, et al. Injury and differentiation following inhibition of mitochondrial respiratory chain complex IV in rat oligodendrocytes. Glia. 2010;58(15):1827–37. [DOI] [PMC free article] [PubMed] [Google Scholar]
- 16. Planas-Fontánez TM, Sainato DM, Sharma I, Dreyfus CF. Roles of astrocytes in response to aging, Alzheimer’s disease and multiple sclerosis. Brain Res. 2021;1764:147464. [DOI] [PMC free article] [PubMed] [Google Scholar]
- 17. Abdelhak A, Foschi M, Abu-Rumeileh S, Yue JK, D’Anna L, Huss A, et al. Blood GFAP as an emerging biomarker in brain and spinal cord disorders. Nat Rev Neurol. 2022;18(3):158–72. [DOI] [PubMed] [Google Scholar]
- 18. Lardenoije R, Roubroeks JAY, Pishva E, Leber M, Wagner H, Iatrou A, et al. Alzheimer’s disease-associated (hydroxy)methylomic changes in the brain and blood. Clin Epigenetics. 2019;11(1):164. [DOI] [PMC free article] [PubMed] [Google Scholar]
- 19. Magliozzi R, Howell OW, Durrenberger P, Aricò E, James R, Cruciani C, et al. Meningeal inflammation changes the balance of TNF signalling in cortical grey matter in multiple sclerosis. J Neuroinflammation. 2019;16(1):259. [DOI] [PMC free article] [PubMed] [Google Scholar]
- 20. Karagkouni D, Paraskevopoulou MD, Chatzopoulos S, Vlachos IS, Tastsoglou S, Kanellos I, et al. DIANA-TarBase v8: a decade-long collection of experimentally supported miRNA-gene interactions. Nucleic Acids Res. 2018;46(D1):D239–45. [DOI] [PMC free article] [PubMed] [Google Scholar]
- 21. Bar-Or A, Pender MP, Khanna R, Steinman L, Hartung HP, Maniar T, et al. Epstein-barr virus in multiple sclerosis: theory and emerging immunotherapies. Trends Mol Med. 2020;26(3):296–310. [DOI] [PMC free article] [PubMed] [Google Scholar]
- 22. Shim SM, Cheon HS, Jo C, Koh YH, Song J, Jeon JP. Elevated epstein-barr virus antibody level is associated with cognitive decline in the Korean elderly. J Alzheimers Dis. 2017;55(1):293–301. [DOI] [PubMed] [Google Scholar]
- 23. Tettey P, Simpson S Jr, Taylor BV, van der Mei IA. The co-occurrence of multiple sclerosis and type 1 diabetes: shared aetiologic features and clinical implication for MS aetiology. J Neurol Sci. 2015;348(1–2):126–31. [DOI] [PubMed] [Google Scholar]
- 24. Marrie RA, Allegretta M, Barcellos LF, Bebo B, Calabresi PA, Correale J, et al. From the prodromal stage of multiple sclerosis to disease prevention. Nat Rev Neurol. 2022;18(9):559–72. [DOI] [PubMed] [Google Scholar]
- 25. Arnold SE, Arvanitakis Z, Macauley-Rambach SL, Koenig AM, Wang HY, Ahima RS, et al. Brain insulin resistance in type 2 diabetes and Alzheimer disease: concepts and conundrums. Nat Rev Neurol. 2018;14(3):168–81. [DOI] [PMC free article] [PubMed] [Google Scholar]
- 26. Figus FA, Piga M, Azzolin I, McConnell R, Iagnocco A. Rheumatoid arthritis: extra-articular manifestations and comorbidities. Autoimmun Rev. 2021;20(4):102776. [DOI] [PubMed] [Google Scholar]
- 27. Rahman MR, Islam T, Zaman T, Shahjaman M, Karim MR, Huq F, et al. Identification of molecular signatures and pathways to identify novel therapeutic targets in Alzheimer’s disease: insights from a systems biomedicine perspective. Genomics. 2020;112(2):1290–9. [DOI] [PubMed] [Google Scholar]
- 28. Wu J, Zhu S, Zhao C, Xu X. A comprehensive investigation of molecular signatures and pathways linking Alzheimer’s disease and epilepsy via bioinformatic approaches. Curr Alzheimer Res. 2022;19(2):146–60. [DOI] [PubMed] [Google Scholar]
- 29. Avasarala JR, Jones JR, Rogers CR. Forkhead box C1 gene variant causing glaucoma and small vessel angiopathy can mimic multiple sclerosis. Mult Scler Relat Disord. 2018;22:157–60. [DOI] [PubMed] [Google Scholar]
- 30. Michlewski G, Cáceres JF. Post-transcriptional control of miRNA biogenesis. RNA. 2019;25(1):1–16. [DOI] [PMC free article] [PubMed] [Google Scholar]
- 31. Herrera-Espejo S, Santos-Zorrozua B, Álvarez-González P, Lopez-Lopez E, Garcia-Orad Á. A systematic review of MicroRNA expression as biomarker of late-onset Alzheimer’s disease. Mol Neurobiol. 2019;56(12):8376–91. [DOI] [PubMed] [Google Scholar]
- 32. Yang Z, Wang KK. Glial fibrillary acidic protein: from intermediate filament assembly and gliosis to neurobiomarker. Trends Neurosci. 2015;38(6):364–74. [DOI] [PMC free article] [PubMed] [Google Scholar]
- 33. Elahi FM, Casaletto KB, La Joie R, Walters SM, Harvey D, Wolf A, et al. Plasma biomarkers of astrocytic and neuronal dysfunction in early- and late-onset Alzheimer’s disease. Alzheimers Dement. 2020;16(4):681–95. [DOI] [PMC free article] [PubMed] [Google Scholar]
- 34. Asken BM, Elahi FM, La Joie R, Strom A, Staffaroni AM, Lindbergh CA, et al. Plasma glial fibrillary acidic protein levels differ along the spectra of amyloid burden and clinical disease stage. J Alzheimers Dis. 2020;78(1):265–76. [DOI] [PMC free article] [PubMed] [Google Scholar]
- 35. Pereira JB, Janelidze S, Smith R, Mattsson-Carlgren N, Palmqvist S, Teunissen CE, et al. Plasma GFAP is an early marker of amyloid-β but not tau pathology in Alzheimer’s disease. Brain. 2021;144(11):3505–16. [DOI] [PMC free article] [PubMed] [Google Scholar]
- 36. Oeckl P, Anderl-Straub S, Von Arnim CAF, Baldeiras I, Diehl-Schmid J, Grimmer T, et al. Serum GFAP differentiates Alzheimer’s disease from frontotemporal dementia and predicts MCI-to-dementia conversion. J Neurol Neurosurg Psychiatry. 2022;93(6):659–67. [DOI] [PubMed] [Google Scholar]
- 37. Sun M, Liu N, Xie Q, Li X, Sun J, Wang H, et al. A candidate biomarker of glial fibrillary acidic protein in CSF and blood in differentiating multiple sclerosis and its subtypes: a systematic review and meta-analysis. Mult Scler Relat Disord. 2021;51:102870. [DOI] [PubMed] [Google Scholar]
- 38. Guedes JR, Lao T, Cardoso AL, El Khoury J. Roles of microglial and monocyte chemokines and their receptors in regulating Alzheimer’s disease-associated amyloid-β and tau pathologies. Front Neurol. 2018;9:549. [DOI] [PMC free article] [PubMed] [Google Scholar]
- 39. El Khoury J, Toft M, Hickman SE, Means TK, Terada K, Geula C, et al. Ccr2 deficiency impairs microglial accumulation and accelerates progression of Alzheimer-like disease. Nat Med. 2007;13(4):432–8. [DOI] [PubMed] [Google Scholar]
- 40. Pillai JA, Bena J, Bebek G, Bekris LM, Bonner-Jackson A, Kou L, et al. Inflammatory pathway analytes predicting rapid cognitive decline in MCI stage of Alzheimer’s disease. Ann Clin Transl Neurol. 2020;7(7):1225–39. [DOI] [PMC free article] [PubMed] [Google Scholar]
- 41. Conductier G, Blondeau N, Guyon A, Nahon JL, Rovère C. The role of monocyte chemoattractant protein MCP1/CCL2 in neuroinflammatory diseases. J Neuroimmunol. 2010;224(1–2):93–100. [DOI] [PubMed] [Google Scholar]
- 42. Kaushansky N, Bakos E, Becker-Herman S, Shachar I, Ben-Nun A. Circulating picomolar levels of CCL2 downregulate ongoing chronic experimental autoimmune encephalomyelitis by induction of regulatory mechanisms. J Immunol. 2019;203(7):1857–66. [DOI] [PubMed] [Google Scholar]
- 43. Pinner E, Gruper Y, Ben Zimra M, Kristt D, Laudon M, Naor D, et al. CD44 splice variants as potential players in Alzheimer’s disease pathology. J Alzheimers Dis. 2017;58(4):1137–49. [DOI] [PubMed] [Google Scholar]
- 44. Shu J, Li N, Wei W, Zhang L. Detection of molecular signatures and pathways shared by Alzheimer’s disease and type 2 diabetes. Gene. 2022;810:146070. [DOI] [PubMed] [Google Scholar]
- 45. Flynn KM, Michaud M, Madri JA. CD44 deficiency contributes to enhanced experimental autoimmune encephalomyelitis: a role in immune cells and vascular cells of the blood-brain barrier. Am J Pathol. 2013;182(4):1322–36. [DOI] [PMC free article] [PubMed] [Google Scholar]
- 46. Bergström S, Remnestål J, Yousef J, Olofsson J, Markaki I, Carvalho S, et al. Multi-cohort profiling reveals elevated CSF levels of brain-enriched proteins in Alzheimer’s disease. Ann Clin Transl Neurol. 2021;8(7):1456–70. [DOI] [PMC free article] [PubMed] [Google Scholar]
- 47. Stamberger H, Weckhuysen S, De Jonghe P. STXBP1 as a therapeutic target for epileptic encephalopathy. Expert Opin Ther Targets. 2017;21(11):1027–36. [DOI] [PubMed] [Google Scholar]
- 48. Sui X, Wang Y, Liu H. hsa_circ_0101119 facilitates the progression of cervical cancer via an interaction with EIF4A3 to inhibit TCEAL6 expression. Mol Med Rep. 2021;24(3):654. [DOI] [PMC free article] [PubMed] [Google Scholar]
Associated Data
This section collects any data citations, data availability statements, or supplementary materials included in this article.
Supplementary Materials
Data Availability Statement
All data generated or analyzed during this study are included in this article and its online supplementary material. Further inquiries can be directed to the corresponding author.


