

Abstract
Isolation and characterization of anticancer activity guided secondary metabolites of endemic Astragalus leucothrix Freyn& Bornm were aimed. Aerial parts of the plant were extracted by maceration method in the solvent system methanol-chloroform (1 : 1) at room temperature. The obtained crude extract was dissolved in purified water. Then, the extract was partitioned with n-hexane, chloroform, ethyl acetate, and n-butanol, respectively. Anticancer activity tests of all the fractions were performed against HeLa and C6 cancer cells. The chloroform fraction that has highest anticancer activity was subjected to chromatographic methods such as column chromatography and thin layer chromatography. Pentyl tetratetracontanoate (1), alfalone (2), 3,6,8-tribromoquinoline (3), and 3,6,8-tribromochromenium (4) molecules were detected from this plant for the first time. The structure determinations of the isolated molecules were elucidated by methods such as 1D and 2D NMR, HPLC - TOF / MS, and GC - MS analysis. Finally, anticancer and cytotoxic activity tests of the compounds were performed. Literature review showed that 3,6,8-tribromochromenium is a new compound. IC50 values of compound 1–2 and compound 3–4 mix were determined to be 4.50 ± 0.10, 2.81 ± 0.00, 4.33 ± 0.00 μM against C6 cell, respectively. The drug likeness properties of 1–4 were obtained by SwissADME. According to Lipinski’s rule of five; 2–4 could be a new potential anticancer agent.
Keywords: Astragalus leucothrix, anticancer activity, cytotoxic activity, in silico ADME, alfalone, C6 cell
1. Introduction
Cancer is a major global public health problem. In addition, the incidence and mortality rates of cancer continue to increase. There will be an estimated 18.1 million new cancer cases and 9.6 million cancer deaths in 2018 [1]. Various systemic treatments such as surgery, chemotherapy, radiotherapy, and hormone therapy are used in cancer treatment [2,3]. Despite these treatment methods, neither a decrease in the number of patients with this disease nor a decrease in the mortality rate is observed [3]. In addition, cancer drugs cause toxicity in normal cells and tissues, causing serious side effects such as vomiting, nausea, hair loss, and resistance development [3–6]. Potential anticancer activities of many medicinal drugs and plant extracts have been investigated in order to avoid these undesirable side effects [3, 7–12]. Therefore, it is extremely important to develop more effective treatments by plants.
Astragalus L. (Fabaceae) taxon is one of the largest genera in the world with 2500–3000 taxa [13–16]. In the studies conducted on Astragalus taxa in Turkey, it has been reported that there are 425–450 taxa, 201–224 of which are endemic and the rate of endemism varies between 47% and 50% [16,17].
Astragalus ssp. includes saponins, flavonoids, and polysaccharides as main classes of compounds [18]. Also, the species contents anthraquinones, alkaloids, amino acids, β-sitosterol, and metallic elements [19]. Astragalus species are used as hepatoprotective, antioxidative, immunostimulant, antiviral [20], antidiabetic, cardioprotective, antiinflammatory [19], for the treatment of wounds and leukemia [21, 22], and anticancer [23] at folk medicine. Also, immunomodulatory and anticancer activity of Astragalus genus were reported in some studies [24–26]. This pharmacological activity has been determined to be caused by three groups of chemical substances: polyholosites, saponins, and phenolics [20]. To our knowledge, there is no study about the anticancer activity and isolation of endemic A. leucothrix Freyn & Bornm. Thus, the main purpose of the research was to investigate the isolation, structural elucidation, biological activities, and in silico ADME evaluation.
2. Materials and methods
2.1. Chemicals
Fetal bovine serum, penicillin/streptomycin, and Dulbecco’s modified Eagle’s medium-high glucose were purchased from Sigma-Aldrich GmbH. (Germany). Methanol (MeOH), n-hexane, chloroform (CHCl3), ethyl acetate (EtOAc), and n-butanol (BuOH) used in HPLC analysis and extraction were HPLC grade and purchased from Merck. LDH Cell Cytotoxicity Assay (Roche 04 744 926 001, Germany) and BrdU ELISA Assay (Cat. No. 11 647 229 001, Germany) were supplied from Roche.
2.2. Plant material
A. leucothrix Freyn & Bornm was collected from Yapraklı District (Çankırı, Turkey) in June 2016. The identification of the plant samples was confirmed by botanist Melda DÖLARSLAN. The plants were stored in the Herbarium of Biology Department, Ankara University, Turkey (Herbarium number: ANK 60526).
2.3. Extraction and isolation
The dry plant (1 kg) was subjected to maceration method in MeOH-CHCl3 (12 L; 1 : 1) to 2 days extraction at room temperature and the procedure was repeated three times. The resulting mixture was then filtered and the solvent was removed in a rotary evaporator. The crude extract was dissolved in purified water (1 L) and was partitioned with n-hexane, CHCl3, EtOAc, and n-BuOH fraction, respectively, and then the solvents were removed to give n-hexane (9.42 g), CHCl3 (3.73 g), EtOAc (2.40 g), n-Butanol (11.79 g), and water (14.85 g) fractions within in the yield of 5.87%, 0.94%, 0.37%, 0.24%, 1.17%, and 1.48%, respectively. CHCl3 fraction (3.50 g) was chromatographed by using silica gel column chromatography to give 556 fractions (20 mL, each). The n-hexane 1–28 with n-hexane-CHCl3 (10% ), fraction 29–77 with n-hexane-CHCl3 (20%); fraction 78–235 with CHCl3; fraction 236–299 with acetone-CHCl3 (5% ); fraction 300–334 with acetone-CHCl3 (10%); fraction 335–365 with acetone-CHCl3 (15% ); fraction 366–399 with acetone-CHCl3 (50%); fraction 400–423 with acetone-CHCl3 (70%); fraction 424–457 with acetone; fractions 458–556 with methanol (MeOH) were eluted. Tubes 114 to 174 were combined by thin layer chromatography. The fractions were subjected to column chromatography with n-hexane-CHCl3 (50%) again. In the column chromatography was collected 116 fractions. Compound 1 (18 mg), compound 2 (82 mg), and compound 3–4 mix (15.6 mg) were isolated from this column.
2.4. Determination of anticancer assays
The extract, fractions, and pure compounds were investigated for their anticancer activities against human cervical adenocarcinoma (HeLa) and rat glioma cells (C6) by using BrdU ELISA assays. The tested samples and 5-FU were dissolved in dimethyl sulfoxide (DMSO). Then the stock solution was diluted with Dulbecco’s Modified Eagle Medium (DMEM). DMSO concentration is below 0.1% in stock solutions. The anticancer activity tests and cell culture study were performed according to the literature [27,28]. The results are means ± SD of six values.
2.5. Determination of cytotoxic assay
The cytotoxic activities of the test substances were determined according to the manufacturer’s procedure using LDH cell cytotoxicity assay and cytotoxicity % was calculated [29].
2.6. Physicochemical and pharmacokinetic properties for computational methods
The SwissADME website was written in HTML, PHP5, and JavaScript, whereas the backend of computation was mainly coded in Python 2.7. The use of additional libraries or software for specific tasks is mentioned in the corresponding paragraph.
The molecule inputted through the sketcher Marvin JS (version 16.4.18, 2016, www.chemaxon.com) are converted into SMILES by JChem Web Services (version 14.9.29, 2013, www.chemaxon.com) installed on one of our servers. This on-the-fly conversion allows seamless paste of SMILES in the input list. The user has the possibility to edit this list as a standard text, e.g., to modify SMILES or add a name to the molecule.1 Upon calculation submission by clicking the “Run” button, the SMILES of each molecule is canonicalised by OpenBabel (version 2.3.0, 2012, http://openbabel.org) and processed individually [30]. Drug-likenesses and molecular property predictions of compounds are determined by the programme at http://www.molsoft.com/mprop/mprop.cgi.
2.7. Statistical analysis and determination of IC50 values
Statistical analyses were used to evaluate anticancer and cytotoxic activity results by one-way ANOVA test. The results are means ± SD of six values. Differences between groups were determined by ANOVA method (p < 0.01). The IC50 values were determined using ED50 plus v1.0.
3. Results and discussion
3.1. Isolation and characterization
Isolation procedure was started with CHCl3 fraction which showed the highest anticancer activity. Three compounds were isolated and identified by spectroscopic methods from the CHCl3 fraction. After the TLC analysis, combined fractions 66–81 (274.6 mg) gave the compound 1 (pentyl tetratetracontanoate), which was determined by using 1D and 2D Nuclear Magnetic Resonance (NMR) spectroscopy (Figures S1–S3). When the proton (1H) NMR spectrum (600 MHz, CDCl3) was examined, two triplet peaks at 0.89 were observed to belong to the terminal methyl proton. The proton of H-1’ was at δ 4.06 and the H-2 proton was resonated as a triplet at δ 2.28. The proton of H-2’ was signalled at δ 1.62 and the proton of H-3 at δ 1.61. Forty-six CH2 groups were determined by utilizing the 1H NMR spectrum integration values (Figure 1).
Figure 1.

The chemical structure of compound 1 (1st value is proton, 2nd value is carbon values.)
When the heteronuclear multiple-bond correlation (HMBC) NMR spectrum of compound 1 was examined, it was determined that the H-8 proton (shown pink) interacts with C-9 and C-7 (carbonyl carbon) carbons. The H-5 proton (shown in red) was shown to correlate with the C-3, C-4, and C-7 carbons (Figure S1). When the carbon (13C) NMR spectrum and distortionless enhancement by polarization transfer (DEPT; 150 MHz, CDCl3) was examined, the presence of the carbonyl group was determined in δ 173.94 (Figure S2). C-5 carbon was found to be resonance in δ 64.16. The methyl carbons were observed at δ 14.00 (Figures S2 and S3). The compound 1 was isolated from A. leucothrix and Astragalus ssp. for the first time.
After the TLC analysis, fractions 114–174 (82 mg) gave compound 2 (6-hydroxy-7,4’-dimethoxy isoflavone; alfalone; Figure 2) which was determined by the 1D and 2D NMR and HPLC / TOF - MS analysis (Figures S4–S12) [31–33]. Compound 2 was identified as isoflavone (alfalone) that isolated for the first time as a natural product [31]. Alfalone is found in many plants such as Medicago truncatula [34], Trifolium pratense and Machaerium isadelphum [35], and Machaerium isadelphum [36]. However, 2 was isolated for the first time from A. leucothrix and Astragalus ssp. In addition, a large number of isoflavone-type compounds have been isolated from Astragalus species. For example, acicerone [37] from Astragalus cicer, maackiain from Astragalus trojanus [38], diadzen, genisten, and 7-hydroxy-3′,5′-dimethoxyisoflavone from Astragalus peregrines [39], 5,5′-dihydroxy-3′-methoxy-isoflavone-7-O-β-d-glucoside, genistin, sissotrin, and 5,4′-dimethoxy-isoflavone-7-O-β-D-glucopyranoside from Astragalus lycius Boiss [40].
Figure 2.

Key HMBC correlation of compound 2.
HPLC/TOF-MS analysis of compound 2 gave [M]+ peak at 297.0981 (C17H14O5) (Figures S4 and S5). The singlet peak observed at δ 7.91 in the 1H NMR spectrum of compound 2 is characteristic for the H-2 proton in the isoflavone skeleton [39]. The singlet peak in the 1H NMR spectrum (Table S1) that were observed in δ 3.83 and 4.01 indicates the methoxy protons linked to the C-4’ and C-7 carbons, respectively, in HMBC spectrum. Protons in the A2X2 system (δ 6.97, dd, 2H, J = 2.0, 8.0 Hz; δ 7.50, dd, 2H, J = 2.0, 8.0 Hz) are observed to interact with the C-4’ carbon-linked methoxy protons. In the 1H NMR spectrum peak at δ 6.27 (1H, s) belongs to the -OH peak due to the D2O exchange (Figure S8). Peaks at δ 7.65 and 6.97 (1H) assigned to the H-5 and H-8 protons, respectively (Figure S6). When the 13C NMR spectrum of 2 is examined, a signal for the carbonyl group is observed at δ 175.65 and two methoxy peaks at δ 55.46 and 56.66 are observed (Figure S9). When the DEPT of 2 is examined, two CH and five CH signals are observed (Figure S10).
When the HMBC NMR spectrum of compound 2 was examined, it was determined that the H-2 proton (shown green) interacts with C-3, C-4 (carbonyl carbon), and C-9 carbons. The H-5 proton (shown in red) was shown to correlate with the C-4, C-6, C-7, C-9, and C-10 carbons. The H-2’ proton (shown in purple) appears to interact with the C-1’, C-3’, and C-6’ carbons (Figure S7). HSQC spectrum of 2 gave the correlation of peaks; at δ 7.92 with the carbon at δ152.04; δ 7.50 with the carbon at δ 130.58; at δ 7.65 with the carbon at δ 104.96; at δ 6.97 with the carbon at δ 102.74; at δ 6.97 with the carbon at δ 114.38; at δ 4.01 with the carbon at δ 56.66; and at δ 3.83 with the carbon in δ 55.46 (Figure S11). The COSY spectrum of 2 resulted the correlation, H-2’, 6’ at δ 7.50 (2H, J = 2.0, 8.0 Hz) with H-3’, 5’ at δ 6.97 (2H, J = 2.0, 8.0 Hz) (Figure S12). Thus, the spectral evidence resulted that compound 2 was identified as alfalone which is a known compound [33–35], but it was isolated and characterized first time from this plant.
The fractions 114–174 (15.6 mg) were seen as a pure compound in TLC, HPLC/TOF-MS and GC-MS analyses (Figures S13 and S14). However, 3,6,8-tribromoquinoline (3) and 3,6,8-tribromochromenium (4) mix were obtained which were determined by 1D and 2D NMR analysis (Figures S15–S21, Table 1). When the spectra at Figure S16 and S17 are examined; two peaks were observed to overlap at 152.47, 136.64, 130.72, 128.76, 121.22, and 119.31 ppm. In addition, when Figure S17 was examined; another peak was detected at 174.21 ppm. When Kar et al., 2021 was examined, it was determined that the C2 carbon in benzopyrylium ions had a resonance between 169.20 and 179.60 ppm. Also, carbon C9 resonates between 155.90 and 167.00 ppm depending on the substituent at C6 and/or C8 [41]. However, all peaks except carbons C2 and C9 are compatible with compound 3 (3,6,8-tribromoquinoline)[42–43]. Considering the peaks, the structure was determined to be compound 4 (3,6,8-tribromobenzopyryllium, Table 1). In addition, when the spectrums at Figure S16 are examined; nine peaks were determined 152.47, 142.36, 136.64, 136.31, 130.72, 128.76, 126.03, 121.22, and 119.31 ppm. The peaks are compatible with compound 3 [42–43].
Table 1.
NMR data of compounds 3–4 (CDCl3, 600 and 150 MHz); IC50 values and cytotoxicity (%) of the compounds.
| Compound 3 (3,6,8-tribromoquinoline) | |||||
|---|---|---|---|---|---|
| Detected | Literature (ppm) [41–43] | Detected (ppm) | Literature (ppm) [41–43] | Detected/ literature | |
| 2 | 9.00 (1H, bs) | 8.99 (1H,d*) | 152.47 | 153.42 | CH/ CH |
| 3 | - | - | 119.24 | 120.06 | C |
| 4 | 8.24 (1H, bs) | 8.20 (1H, d*) | 136.64 | 137.51 | CH/ CH |
| 5 | - | - | 121.22 | 121.97 | C |
| 6 | 7.88 (1H,bs) | 7.86 (1H,d*) | 128.76 | 129.57 | CH/ CH |
| 7 | - | - | 126.03 | 126.77 | C |
| 8 | 8.15 (1H, bs) | 8.14 (1H, d*) | 136.31 | 137.15 | CH/ CH |
| 9 | - | - | 142.36 | 143.18 | C |
| 10 | - | - | 130.72 | 131.50 | C |
| Compound 4 (3,6,8-tribromobenzopyrylium) | |||||
| Detected (ppm) | Literature [41–43] | Detected (ppm) | Literature (ppm) [41–43] | Detected/ literature | |
| 2 | 9.00 (1H, bs) | 8.99 (1H,d*) | 174.21 | 169.20–179.60 41 | CH/ CH |
| 3 | - | - | 119.31 | 120.06 | C |
| 4 | 8.24 (1H, bs) | 8.20 (1H, d*) | 136.64 | 137.51 | CH/ CH |
| 5 | - | - | 121.27 | 121.97 | C |
| 6 | 7.88 (1H,bs) | 7.86 (1H,d*) | 128.76 | 129.57 | CH/ CH |
| 7 | - | - | 126.03 | 126.77 | C |
| 8 | 8.15 (1H, bs) | 8.14 (1H, d*) | 136.31 | 137.15 | CH/ CH |
| 9 | - | - | 152.47 | 155.90–167.00 41 | C |
| 10 | - | - | 130.72 | 131.50 | C |
| HeLa cell | C6 cell | Cytotoxicity (%) | |||
| Compound 1 | 72.35 ± 0.51a | 4.50 ± 0.10a | 24.25 ± 0.01c | ||
| Compound 2 | 22.07 ± 0.21b | 2.81 ± 0.00b | 43.02 ± 0.02a | ||
| Compound 3+4 | 73.22 ± 0.25a | 4.33 ± 0.00a | 4.05 ± 0.01d | ||
| 5-FU | 16.32 ± 0.11c | 5.8 ± 0.10c | 39.02 ± 0.03b | ||
Signals specified as doublets appear as broad singlets in the article [42].
The quinoline skeleton is found in a variety of natural compounds and synthetic derivatives. It has many biological activities such as antimalarial, antibacterial, antifungal, anthelmintic, cardiotonic, anticonvulsant, anti-inflammatory, and analgesic activity [44]. However, quinolone derivatives were isolated from many plants such as Ephedra pachyclada ssp. sinaica [45], Haplophyllum foliosum, Haplophyllum pedicellatum [46], Solidago canadensis [47], Eremophila microtheca [48], Lunasia amara [49], and Pitaviaster haplophyllus [50].
In addition, the first naturally occurring bromo-quinoline alkaloid was isolated from the marine bryozoan Flustra foliacea (L.) [51].
In 1H NMR spectrum (600 MHz, CDCl3, Figure S15, Table 1) of compound 3–4 mix, H-2 proton peak at δ 9.00 (2H, s), H-4 proton at δ 8.24 (2H, s), H-6 proton at δ 7.88 (2H, s), and H-8 proton at δ 8.15 (2H, s) were determined [42]. In 13C NMR spectrum and HPLC-TOF/MS analysis of compound 3–4 mix, compound 3 was observed as [C9H4Br3N]+ and [M]+ peak m/z at 367.8055 (Figure S20). At the same time, compound 4 was detected as [C9H4Br3O]+, [M]+ peak m/z at 365.8074 (Figure S20). The nitrogen rule in mass spectrometry states that (organic) molecules containing no or an even number of nitrogen atoms will have even masses, and molecules containing an odd number of nitrogen atoms will have odd masses [52]. Thus, the fact that the molecular ion peak in the mass spectrum is a single number supports the presence of nitrogen atom in the structure. In addition, when the mass spectrum was examined, three bromine atoms were observed in both molecules (Figure S20)[53]. 13C and DEPT NMR spectra of compound 3 (150 MHz, CDCl3) gave nine signals at δ 152.47, 119.24, 136.64, 121.22, 128.76, 126.03, 136.31, 142.36, and 130.72, which were assigned to carbons C-2, C-3, C-4, C-5, C-6, C-7, C-8, C-9, and C-10, respectively [42]. In the HMBC spectrum (600 MHz, CDCl3) in Figure 3, the H-2 proton (shown in red) was found to interact with the C-3, C-4, and C-9 carbons. The H-4 proton (shown in green) correlates with the C-2, C-3, C-5, and C-10 carbons. The H-8 proton (shown in pink) interacts with C-6, C-7, C-9, and C-10 carbons (Figures 3 and S21). When the HSQC spectrum (600 MHz, CDCl3) in Figure S19 was examined, the proton in δ 9.00 ppm with carbon at δ152.47 ppm, the proton in δ 8.24 ppm with carbon in δ136.64 ppm, the proton in δ 8.15 ppm with the carbon in δ136.31 ppm, and the proton in δ 7.88 ppm with the carbon in the carbon δ128.66 ppm were seen to be correlated. The interactions overlap with compound 3. Bromine ranks 44th among the elements found in the earth’s crust. There are many organobromine compounds synthesized by living organisms or formed as a result of natural abiotic processes [54]. Because of their similar physical and chemical properties, bromides are commonly found in the environment together with sodium chloride in smaller amounts. Br has been shown to be a new and important trace element for humans and animals [55]. Although various plant species can accumulate high concentrations of Br, to our knowledge, their role in plants has not been established [56]. In marine plants (for example, Bonnemaisonia hamifera, Laurencia species), marine animals (for example, sponges, bryozoans, corals), mammals (for example, cat and rat), abiogenic sources, plants (for example, rapeseed, mustard, cabbage, Chinese cabbage, broccoli, pak-choi, alyssum, wild mustard, turnip, radish), fungi and lichen, bacteria (for example, Bacillus subtilis, Chromobacterium species), and insects are naturally found organobromine compounds [57]. However, the compound 3 and 4 were isolated from A. leucothrix and Astragalus ssp. for the first time.
Figure 3.

Key HMBC correlation of compound 3–4 mix.
3.2. Anticancer activity
The anticancer activities of MeOH: CHCl3 extract, n-hexane, CHCl3, EtOAc, n-Butanol and water fractions and 5-FU that were used as a standard against C6 and HeLa cell were investigated (Figure 4). As a result of the tests performed, an increase in the activity of all extracts due to dose increase was observed. Activity at 100 μg/mL concentration against HeLa cell (Figure 4): CHCl3 fraction > 5-FU > n-hexane fraction > EtOAc fraction > MeOH: CHCl3 extract > n-BuOH fraction > water fraction. When cancer activity results were examined in both cells, the most active fraction was found to be chloroform fraction. The highest activity against C6 cells was observed in n-hexane and chloroform fractions (Figure 4). Activity at 100 μg/mL concentration against C6 cell: n-hexane fraction > CHCl3 fraction > MeOH: CHCl3 extract > 5-FU > EtOAc fraction > water fraction > n-BuOH fraction.
Figure 4.

The anticancer activity of extracts against C6 and HeLa cell (* tests repeated three times and twice).
In cytotoxicity studies on Astragalus chrysochlorus extracts, the highest effect was observed in chloroform extract. This extract was followed by ethyl acetate, ethanol, n-hexane, and aqueous ethanol extracts [58]. Similarly, in our study, the highest effect was observed in chloroform extract. This extract was followed by n-hexane extract. We performed GC-MS analyses of n-hexane and chloroform extracts of A. leucothrix (Table 2). In the n-hexane extract, palmitic acid, linolenic acid, and linoleic acid were main components. Palmitic acid, linolenic acid, and behenic acid were major compounds in chloroform extracts. PUFA fatty acids are used in chemotherapy. They also increase the effectiveness of chemotherapeutic drugs and may reduce chemotherapy or cancer side effects. Linolenic acid in the chloroform extract inhibited various cancer cells such as GOTO, SK-N-DZ, DU145, A-549, PC-3, 36B10 cells [59]. Also, palmitic acid has anticancer activity against human leukemic cell line (MOLT-4), colon 26 murine tumour cells, and human breast cancer (MCF-7). It is also known that the crude extracts are more effective than their pure compounds for pharmacologically. This effect is thought to be due to the synergistic effect of many molecules in the extracts [60].
Table 2.
GC-MS analysis results of the n-hexane and chloroform extracts of A. leucothrix.
| No | RT | Isomer | Compound name | Area% | |
|---|---|---|---|---|---|
| n-Hexane | CHCl3 | ||||
| Saturated Fatty Acids (SFAs) | |||||
| 1 | 19.834 | C12:0 | Lauric acid | - | 0.86 |
| 2 | 22.912 | C14:0 | Myristic acid | 1.36 | 1.04 |
| 3 | 27.650 | C16:0 | Palmitic acid | 19.72 | 18.30 |
| 4 | 32.583 | C18:0 | Stearic acid | 4.41 | 5.02 |
| 5 | 34.854 | C20:0 | Arachidic acid | 3.14 | 3.27 |
| 6 | 37.320 | C22:0 | Behenic acid | 2.56 | 11.27 |
| 7 | 45.577 | C23:0 | Tricosylic acid | - | 2.50 |
| 8 | 40.622 | C24:0 | Lignoceric acid | - | 4.89 |
| Subtotal | 31,19 | 57,15 | |||
| Polyunsaturated Fatty Acids (PUFAs) | |||||
| 9 | 32.193 | C18:2 | Linoleic acid | 11.41 | 4.81 |
| 10 | 32.302 | C18:3 | Linolenic acid | 28.32 | 13.30 |
| Subtotal | 39.73 | 18.11 | |||
| Other Components | |||||
| 11 | 32.445 | 3,7,11,15-Tetramethyl-2-hexadecen-1-ol | 2.42 | 1.53 | |
| 12 | 36.834 | Behenic alcohol | - | 1.76 | |
| 13 | 39.998 | Heptacosane | 2.39 | 2.78 | |
| 14 | 44.616 | Nonacosane | 10.31 | 8.79 | |
| 15 | 51.992 | Hentriacontane | 2.90 | 9.85 | |
| 16 | 64.214 | γ-Sitosterol | 11.06 | - | |
| 17 | 53.336 | Octacosanoic acid, methyl ester | - | 0.36 | |
| Subtotal | 26.18 | 25.07 | |||
| General Total | 97.1 | 100.3 | |||
The anticancer activities of the isolated compound 1–2, compound 3–4 mix, and 5-FU used as standard were examined against the HeLa as a result of the tests (Figure 5), an increase was observed in all molecules (except compound 3–4 mix) due to dose increase. Among the isolated molecules, the highest activity against the HeLa cell was observed in the compound 2.
Figure 5.

The anticancer activity of the compounds against C6 and HeLa cell (* tests repeated three times and twice).
Activity at a concentration of 100 μM is as follows: 5-FU > compound 2 > compound 1 > compound 3–4 mix. As a result of anticancer activity tests of compound 1–2, compound 3–4 mix, and 5-FU against C6 cells (Figure 5), an increase was observed in all molecules due to dose increase. The highest activity against the C6 cell between the isolated molecules and the 5-FU was observed in the compound 2. Cell selective activity against C6 cells was observed in all isolated molecules. The activity at 100 μM concentration is compound 2 > 5-FU > compound 3–4 mix > compound 1. The anticancer activities of the isolated compound 1–2, compound 3–4 mix, and 5-FU used as standard were examined against the HeLa and C6 cells. The IC50 values of these compounds are given in Table 2.
As in this study, the isolated compounds and extracts from Astragalus species such as Astragalus tribuloides [60], Astragalus hamosus [60–62], Astragalus membranaceus [25, 63–64], Astragalus ovinus [65], Astragalus vogelii [66], Astragalus complanatus [67] have anticancer activity.
3.3. Cytotoxic activity
C6 cells were used to determine cytotoxic activity. 100 μg/mL concentration, which is the highest dose used in the anticancer activity tests, was also studied during the experiment. 5-FU was used as a positive control. Test results were given in Table 1. The cytotoxicity values of the samples are relatively small (except compound 2) compared to 5-FU. Especially compound 3–4 mix is less toxic than 5-FU.
3.4. Drug likeness properties
The number of hydrogen bond acceptors (n-ON) and donors (n-OHNH) are within the Lipinski’s rules, n-ON < 10 and n-OHNH < 5. The calculated log P must be smaller than 5. In our study, the log P values of compound 2–4 were smaller than 5. The molecular weight of the compounds is in the range of 298.29 g/mol and 719.30 g/mol, respectively. The blood-brain barrier (BBB) score: 6-High, 0-Low [68]. The BBB score of compound 1–4 ranges from 3.23 to 4.28. Compound 1–4 can cross the BBB. Synthetic accessibility score of the compounds are from 1 (very easy) to 10 (very difficult). Synthetic accessibility of all the compounds is in the range of 1.79 and 6.77. Topological polar surface area (TPSA) must be <70 Å2. TPSA values of all the compounds were smaller than 70 Å2 (Tables 3 and 4).
Table 3.
Physicochemical properties, lipophilicity, solubility, pharmacokinetics, drug likeness, and medicinal chemistry of compound 1–4 predicted using Swiss ADME.
| No | Physicochemical properties | Lipophilicity | Water solubility | Pharmacokinetics | Drug likeness | Medicinal chemistry |
|---|---|---|---|---|---|---|
| 1 | Formula: C49H98O2 Moleculer weight: 719.30 g/ mol Num. heavy atoms: 51 Num. arom.heavy atoms: 0 Fraction Csp3:0.98 Num. rotatable bonds: 47 Num. H-bond acceptors: 2 Num. H-bond donors: 0 Molar Refractivity: 238.94 TPSA: 26.30 Å2 |
Log Po/W (iLOGP): 11.92 Log Po/W (XLOGP3): 24.38 Log Po/W (WLOGP): 18.12 Log Po/W (MLOGP): 10.48 Log Po/W (SILICOS-IT): 19.98 Consensus Log Po/W: 16.98 |
Log S (ESOL): −16.56 Solubility: 1.99e-14 mg/ml ; 2.77e-17 mol/l Class: Insoluble Log S (Ali): −25.40 Solubility: 2.85e-23 mg/ml ; 3.96e-26 mol/l Class: Insoluble Log S(SILICOS-IT): −18.49 Solubility: 2.33e-16 mg/ml ; 3.24e-19 mol/l Class: Insoluble |
GI absorption:Low P-gp substrate: Yes CYP1A2 inhibitor: No CYP2C19 inhibitor:No CYP2C9 inhibitor:No CYP2D6 inhibitor:No CYP3A4 inhibitor:No Log Kp (skin permeation): 6.62 cm/s |
Lipinski: No; 2 violations: MW>500, MLOGP>4.15 Ghose: No; 4 violations: MW>480, WLOGP>5.6, MR>130, #atoms>70 Veber: No; 1 violation: Rotors>10 Egan: No; 1 violation: WLOGP>5.88 Muegge: No; 3 violations: MW>600, XLOGP3>5, Rotors>15 Bioavailability Score: 0.17 |
PAINS: = 0 alert Brenk: 0 alert Leadlikeness: No; 3 violations: MW>350, Rotors>7, XLOGP3>3.5 Synthetic accessibility: 6.77 |
| 2 | Formula: C17H14O5 Moleculer weight: 298.29 g/ mol Num. heavy atoms: 22 Num. arom.heavy atoms: 16 Fraction Csp3:0.12 Num. rotatable bonds: 3 Num. H-bond acceptors: 5 Num. H-bond donors: 1 Molar Refractivity: 82.93 TPSA: 68.90 Å2 |
Log Po/W (iLOGP): 2.95 Log Po/W (XLOGP3): 2.77 Log Po/W (WLOGP): 3.18 Log Po/W (MLOGP): 1.01 Log Po/W (SILICOS-IT): 3.55 Consensus Log Po/W: 2.69 |
Log S (ESOL): −3.77 Solubility: 5.01e-02 mg/ml ; 1.68e-04 mol/l Class: Soluble Log S (Ali): −3.87 Solubility: 4.00e-02 mg/ml ; 1.34e-04 mol/l Class: Soluble Log S(SILICOS-IT): −5.80 Solubility: 4.74e-04 mg/ml ; 1.59e-06 mol/l Class: Moderately soluble |
GI absorption: High P-gp substrate:No CYP1A2 inhibitor: Yes CYP2C19 inhibitor: No CYP2C9 inhibitor: Yes CYP2D6 inhibitor: Yes CYP3A4 inhibitor: Yes Log Kp (skin permeation): −6.15 cm/s |
Lipinski: Yes; 0 violation Ghose: Yes Veber: Yes Egan: Yes Muegge: Yes Bioavailability Score: 0.55 |
PAINS: 0 alert Brenk: 0 alert Leadlikeness: Yes Synthetic accessibility: 3.04 |
| 3 | Formula: C9H4Br3N Moleculer weight: 365.85 g/ mol Num. heavy atoms: 13 Num. arom.heavy atoms: 10 Fraction Csp3:0.00 Num. rotatable bonds: 0 Num. H-bond acceptors: 1 Num. H-bond donors: 0 Molar Refractivity: 64.84 TPSA: 12.89 Å2 |
Log Po/W (iLOGP): 2.79 Log Po/W (XLOGP3): 4.26 Log Po/W (WLOGP): 4.52 Log Po/W (MLOGP): 3.93 Log Po/W (SILICOS-IT): 4.44 Consensus Log Po/W: 3.99 |
Log S (ESOL): −5.36 Solubility: 1.59e-03 mg/ml; 4.35e-06 mol/l Class: Moderately soluble Log S (Ali): −4.24 Solubility: 2.09e-02 mg/ml; 5.72e-05 mol/l Class: Moderately soluble Log S(SILICOS-IT): −6.21 Solubility: 2.28e-04 mg/ml ; 6.22e-07 mol/l Class: Poorly soluble |
GI absorption: High P-gp substrate: No CYP1A2 inhibitor:Yes CYP2C19 inhibitor: Yes CYP2C9 inhibitor: Yes CYP2D6 inhibitor:No CYP3A4 inhibitor:No Log Kp (skin permeation): −5.51 cm/s |
Lipinski: Yes; 0 violation Ghose: No; 1 violation: #atoms<20 Veber: Yes Egan: Yes Muegge: No; 1 violation: Heteroatoms <2 Bioavailability Score: 0.55 |
PAINS: 0 alert Brenk: 0 alert: Leadlikeness: No; 2 violations: MW>350, XLOGP3>3.5 Synthetic accessibility: 1.79 |
| 4 | Formula: C9H4Br3O Moleculer weight:367.84 g/ mol Num. heavy atoms: 13 Num. arom.heavy atoms: 10 Fraction Csp3: 0.00 Num. rotatable bonds: 0 Num. H-bond acceptors: 1 Num. H-bond donors: 0 Molar Refractivity: 63.72 TPSA: 13.14 Å2 |
Log Po/W (iLOGP): −2.05 Log Po/W (XLOGP3): 3.82 Log Po/W (WLOGP): 5.00 Log Po/W (MLOGP): 3.93 Log Po/W (SILICOS-IT): 3.16 Consensus Log Po/W: 2.77 |
Log S (ESOL): −5.10 Solubility2.95e-03 mg/ml ; 8.01e-06 mol/l Class: Moderately soluble Log S (Ali): −3.79 Solubility: 5.95e-02 mg/ml ; 1.62e-04 mol/l Class: Soluble Log S(SILICOS-IT): −5.30 Solubility: 1.83e-03 mg/ml ; 4.98e-06 mol/l Class: Moderately soluble |
GI absorption: High P-gp substrate:Yes CYP1A2 inhibitor:No CYP2C19 inhibitor:No CYP2C9 inhibitor:No CYP2D6 inhibitor:No CYP3A4 inhibitor:No Log Kp (skin permeation): −5.83 cm/s |
Lipinski: Yes; 0 violation Ghose: No; 1 violation: #atoms<20 Veber: Yes Egan: Yes Muegge: No; 1 violation: Heteroatoms <2 Bioavailability Score: 0.55 |
PAINS: 0 alert Brenk: 1 alert: charged_ oxygen_sulfur Leadlikeness: No; 2 violations: MW>350, XLOGP3>3.5 Synthetic accessibility: 2.81 |
Table 4.
SMILES, Lipinski’s rule of five and drug likeness of compound 1–4 predicted using molsoft programme.
| No | SMILES | Moleculer properties | Drug likeness |
|---|---|---|---|
| 1 | CCCCCCCCCCCCCCC CCCCCCCCCCCCCCC CCCCCCCCCCCCCC( =O)OCCCCC | Moleculer formula: C49 H98 O2 Moleculer weight: 718.76 (> 500) Number of HBA: 2 Number of HBD: 0 MolLogP: 23.34 (> 5) MolLogS: −5.79 (in Log(moles/L)) 1.16 (in mg/L) MolPSA: 20.96 A2 MolVol: 901.53 A3 Number of stereo centers: 0 BBB Score: 3.23 |
 Drug-likeness model score: −0.76 |
| 2 | [H]C1=C(C(=O) C2=C(O1) C([H])=C(OC) C(O)=C2[H])C1=C([H]) C([H])=C(OC) C([H])=C1[H] | Moleculer formula:C17 H14 O5 Moleculer weight: 298.08 Number of HBA: 5 Number of HBD: 1 MolLogP: 2.54 MolLogS: −2.91 (in Log(moles/L)) 370.00 (in mg/L) MolPSA: 52.58 A2 MolVol: 304.52 A3 Number of stereo centers: 0 BBB Score: 3.93 |
 Drug-likeness model score: 0.17 |
| 3 | BrC1=CC2=C(C=C(Br) C=C2Br)N=C1 | Moleculer formula:C9 H4 Br3 N Moleculer weight: 362.79 Number of HBA: 1 Number of HBD: 0 MolLogP: 4.91 MolLogS: −5.04 (in Log(moles/L)) 3.34 (in mg/L) MolPSA: 9.86 A2 MolVol: 186.91 A3 Number of stereo centers: 0 BBB Score: 4.28 |
 Drug-likeness model score: −0.97 |
| 4 | BrC1=CC2=C(C=C(Br) C=C2Br)[O+]=C1 | Moleculer formula:C9 H4 Br3 O Moleculer weight: 364.78 Number of HBA: 1 Number of HBD: 0 MolLogP: 4.52 MolLogS: −4.43 (in Log(moles/L)) 13.44 (in mg/L) MolPSA:5.95 A2 MolVol: 201.83 A3 Number of stereo centers: 0 BBB Score: 4.15 |
 Drug-likeness model score: −1.64 |
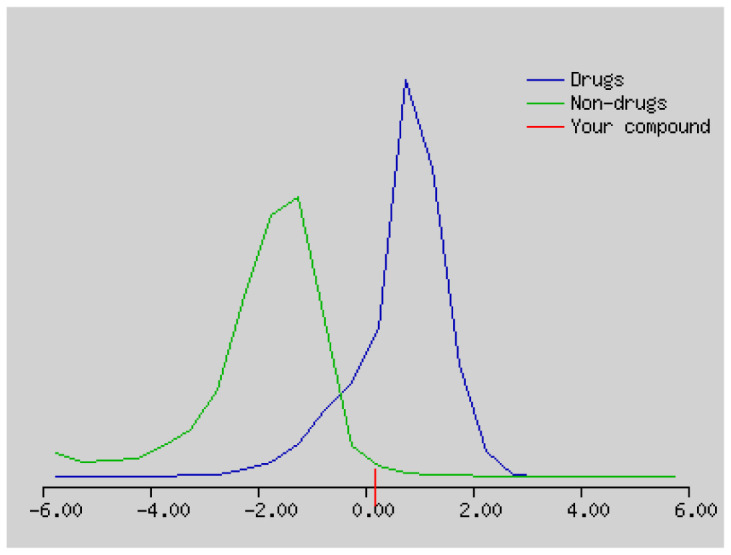
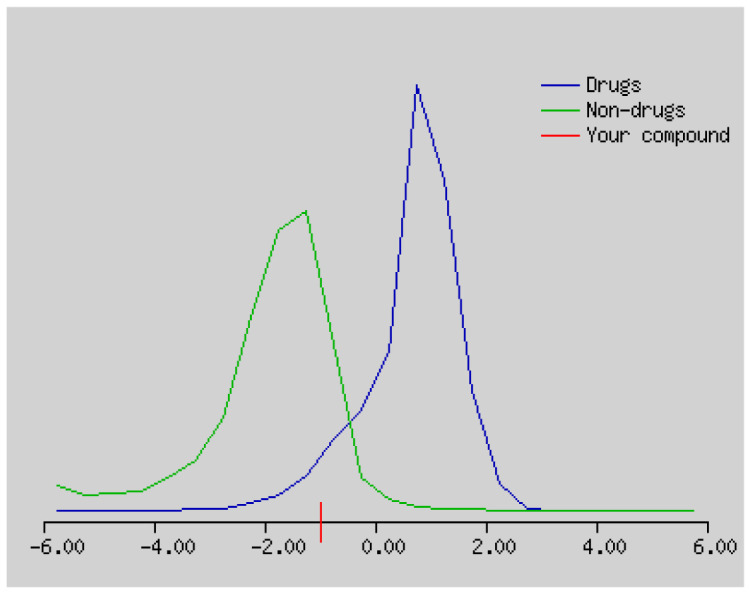
The solubility (log S) scale value ranges between −10 (insoluble), −6 (poorly soluble), −4 (soluble), −2 (very soluble), and 0 (highly soluble). The solubility values of compound 1–4 were −16.56, −3.77, −5.36, and 5.10, which respectively correspond to insoluble, soluble, moderately soluble, and moderately soluble. The more negative the skin permeation (log Kp) the less the skin-permeant the molecule. For example, Diclofenac is a good topic antiinflammatory with a predicted log Kp of −4.96 (cm/s), while Ouabain has little chance to cross skin with a predicted log Kp of −10.94 (cm/s). The log Kp values of compound 1–4 were 6.62, −6.15, −5.51, and −5.83 cm/s, respectively. The Kp values showed that compound 2–4 was good in skin permeability (Tables 3 and 4). According to Lipinski’s rule of five, compound 2–4 could be a new potential anticancer agent according to calculated data (Tables 3 and 4) [69]. The pink area represents the optimal range for each property (lipophilicity: LOGP between −0.7 and +5.0, size: MW between 150 and 500 g/mol, polarity: TPSA between 20 and 130 Å2, solubility: log S not higher than 6, saturation: fraction of carbons in the sp3 hybridization not less than 0.25, and flexibility: no more than 9 rotatable bonds. In this example, compound 2–4 are predicted orally bioavailable, because of being flexible, polar, and small size. Bioavailability radar of compound 1–4 is demonstrated in Figure 6.
Figure 6.

The bioavailability radar of the compounds 1–4.
Suplemantary materials
1H NMR spectrum and HMBC correclations of compound 1 (600 MHz, CDCl3)
13C NMR spectrum of compound 1 (150 MHz, CDCl3)
DEPT NMR spectrum of compound 1 (150 MHz, CDCl3)
HPLC/TOF-MS chromatogram of compound 2
Mass spectrum of compound 2
1H NMR spectrum of compound 2 (600 MHz, CDCl3)
HMBC spectrum of compound 2 (600 MHz, CDCl3)
1H NMR spectrum of compound 2 taken with D2O (600 MHz, CDCl3)
13C NMR spectrum of compound 2 (150 MHz, CDCl3)
DEPT NMR spectrum of compound 2 (150 MHz, CDCl3)
HSQC NMR spectrum of compound 2 (600 MHz, CDCl3)
COSY NMR spectrum of compound 2 (600 MHz, CDCl3)
HPLC/TOF-MS chromatogram of compound 3–4 mix
GC-MS chromatogram of compound 3–4 mix
1H NMR spectrum of compound 3–4 mix (600 MHz, CDCl3)
13C NMR spectrum of compound 3–4 mix (150 MHz, CDCl3)
DEPT NMR spectrum of compound 3–4 mix (150 MHz, CDCl3)
COSY spectrum of compound 3–4 mix (600 MHz, CDCl3)
HSQC spectrum of compound 3–4 mix (600 MHz, CDCl3)
The mass spectra and structure of compound 3–4 mix
HMBC NMR spectrum and correlations of compound 3–4 mix (600 MHz, CDCl3)
Table S1.
1H, 13C NMR, and DEPT data of compound 2
| Position | 1H | 13C | DEPT |
|---|---|---|---|
| Compound 2 | |||
| 2 | 7.92 (1H, s) | 152.04 | CH |
| 3 | - | 124.17 | C |
| 4 | - | 175.65 | C |
| 5 | 7.65 (1H, s) | 104.96 | CH |
| 6 | - | 145.53 | C |
| 7 | - | 152.45 | C |
| 8 | 6.97 (1H, s) | 102.47 | CH |
| 8a | - | 151.15 | C |
| 4a | - | 117.93 | C |
| 1′ | - | 124.31 | C |
| 2′ | 7.50 (2H, dt, J=2.0, 8.0 Hz) | 130.58 | CH |
| 3′ | 6.97 (2H, dt, J=2.0, 8.0 Hz) | 114.38 | CH |
| 4′ | - | 159.49 | C |
| 5′ | 6.97 (2H, dt, J=2.0, 8.0 Hz) | 114.38 | CH |
| 6′ | 7.50 (2H, dt, J=2.0, 8.0 Hz) | 130.58 | CH |
| OMe | 3.83 (3H, s) | 55.46 | CH3 |
| 4.01 (3H, s) | 56.66 | CH3 | |
| OH | 6.27 (1H, s) | - | - |

Highlights.
Four compound were isolated firstly from Astragalus leucothrix.
Two tribromo compound was identified for the first time as a natural product.
According to Lipinski’s rule of five; 2–4 could be a new potential anticancer agent.
Acknowledgement
This study was funded by the Scientific and Technological Research Council of Turkey (TÜBİTAK) [grant number 114Z152].
Funding Statement
This study was funded by the Scientific and Technological Research Council of Turkey (TÜBİTAK) [grant number 114Z152].
Footnotes
www.nature.com/scientificreports/SCientifiC REpOrtS | 7:42717 | DOI: 10.1038/srep42717
References
- 1. Bray F, Ferlay J, Soerjomataram I, Siegel RL, Torre LA, et al. Global cancer statistics 2018: GLOBOCAN Estimates of Incidence and Mortality Worldwide for 36 Cancers in 185 Countries. CA: A Cancer Journal for Clinicians. 2018;68:394–424. doi: 10.3322/caac.21492. [DOI] [PubMed] [Google Scholar]
- 2. Damyanov C, Maslev I, Pavlov V, Avramov L. Conventional treatment of cancer realities and problems. Annals of Complementary and Alternative Medicine. 2018;1:1002–1011. [Google Scholar]
- 3. Singh SP, Mishra A, Shyanti RK, Singh RP, Acharya A. Silver nanoparticles synthesized using Carica papaya leaf extract (AgNPs-PLE) causes cell cycle arrest and apoptosis in human prostate (DU145) cancer cells. Biological Trace Element Research. 2021;199:1316–1331. doi: 10.1007/s12011-020-02255-z. [DOI] [PubMed] [Google Scholar]
- 4. Coates A, Abraham S, Kaye SB, Sowerbutts T, Frewin C, et al. On the receiving end–patient perception of the side-effects of cancer chemotherapy. European Journal of Cancer and Clinical Oncology. 1983;19:203–208. doi: 10.1016/0277-5379(83)90418-2. [DOI] [PubMed] [Google Scholar]
- 5. Szakacs G, Paterson JK, Ludwig JA, Booth-Genthe C, Gottesman MM. Targeting multidrug resistance in cancer. Nature Reviews Drug Discovery. 2006;5:219–234. doi: 10.1038/nrd1984. [DOI] [PubMed] [Google Scholar]
- 6. Karmous I, Pandey A, Haj KB, Chaoui A. Efficiency of the green synthesized nanoparticles as new tools in cancer therapy: insights on plant-based bioengineered nanoparticles, biophysical properties, and anticancer roles. Biological Trace Element Research. 2020;196:330–342. doi: 10.1007/s12011-019-01895-0. [DOI] [PubMed] [Google Scholar]
- 7. Cai Y, Luo Q, Sun M, Corke H. Antioxidant activity and phenolic compounds of 112 traditional Chinese medicinal plants associated with anticancer. Life Sciences. 2004;74(17):2157–2184. doi: 10.1016/j.lfs.2003.09.047. [DOI] [PMC free article] [PubMed] [Google Scholar]
- 8. Cragg GM, Newman DJ. Plants as a source of anticancer agents. Journal of Ethnopharmacology. 2005;100(1–2):72–79. doi: 10.1016/j.jep.2005.05.011. [DOI] [PubMed] [Google Scholar]
- 9. Khan F, Pandey P, Ahmad V, Upadhyay TK. Moringa oleifera methanolic leaves extract induces apoptosis and G0/G1 cell cycle arrest via down regulation of Hedgehog Signaling Pathway in human prostate PC-3 cancer cells. Journal of Food Biochemistry. 2020a;44(8):e13338. doi: 10.1111/jfbc.13338. [DOI] [PubMed] [Google Scholar]
- 10. Ashraf MA. Phytochemicals as potential anticancer drugs: time to ponder nature’s bounty. BioMed Research International. 2020:2020. doi: 10.1155/2020/8602879. [DOI] [PMC free article] [PubMed] [Google Scholar]
- 11. Omara T, Kiprop AK, Ramkat RC, Cherutoi J, Kagoya S, et al. Medicinal plants used in traditional management of cancer in uganda: a review of ethnobotanical surveys, phytochemistry, and anticancer studies. Evidence-Based Complementary and Alternative Medicine. 2020;15:3529081. doi: 10.1155/2020/3529081. [DOI] [PMC free article] [PubMed] [Google Scholar]
- 12. Khan T, Ali M, Khan A, Nisar P, Jan SA, et al. Anticancer plants: a review of the active phytochemicals, applications in animal models, and regulatory aspects. Biomolecules. 2020b;10(1):47. doi: 10.3390/biom10010047. [DOI] [PMC free article] [PubMed] [Google Scholar]
- 13. Chaudhary LB, Rana TS, Anand KK. Current status of the systematics of Astragalus L. (Fabaceae) with special reference to the Himalayan Species in India. Taiwania. 2008;53:338–355. doi: 10.6165/tai.2008.53(4).338. [DOI] [Google Scholar]
- 14.Aytaç Z, Ekici M. Astragalus. In: Güner A, et al., editors. Türkiye Bitkileri Listesi (Damarlı Bitkiler) Turkey: Nezahat Gökyiğit Botanik Bahçesi ve Flora Araştırmaları, Derneği Yayını; 2012. pp. 427–456. [Google Scholar]
- 15.Podlech D, Zarre Sh.[with collaboration of Ekici, M., Maassoumi, A.A. & Sytin, A.] A taxonomic revision of the genus Astragalus L. (Leguminosae) in the Old World. 1–3. Naturhistorisches Museum; Wien: 2013. p. 2439. [Google Scholar]
- 16.Vural M, Subaşı Ü, Ayyıldız G, Samancı İ. Ankara Province Private Geveni (Astragalus bozakmanii) Species Conservation Action Plan, Ministry of Forestry and Water Affairs General Directorate of Nature Conservation and National Parks, IX. Regional Directorate-Ankara Branch Office; 2017. [Google Scholar]
- 17.Kocabaş YZ, İlçim A, Çömlekçioğlu N.Kahramanmaraş Başkonuş Mountain Geven (Astragalus spp.) And Its Importance, III. International Non-Wood Forest Products Symposium; 8–10 May 2014; Kahramanmaraş. [Google Scholar]
- 18. Ibrahim LF, Marzouk MM, Hussein SR, Kawashty SA, Mahmoud K, et al. Flavonoid constituents and biological screening of Astragalus bombycinus Boiss. Natural Product Research. 2013;27:386–393. doi: 10.1080/14786419.2012.701213. [DOI] [PubMed] [Google Scholar]
- 19. Li X, Qu L, Dong Y, Han L, Liu E, et al. A review of recent research progress on the Astragalus genus. Molecules. 2014;19:18850–18880. doi: 10.3390/molecules191118850. [DOI] [PMC free article] [PubMed] [Google Scholar]
- 20. Rios JL, Waterman PG. A Review of the pharmacology and toxicology of Astragalus. Phytotherapy Research. 1998;11:411–418. doi: 10.1002/(SICI)1099-1573(199709)11:6<411::AID-PTR132>3.0.CO;2-6. [DOI] [Google Scholar]
- 21. Calis I, Yuruker A, Tasdemir D, Wright AD, Sticher O, et al. Cycloartane triterpene glycosides from the roots of Astragalus melanophrurius. Planta Medica. 1997;63:183–186. doi: 10.1055/s-2006-957642. [DOI] [PubMed] [Google Scholar]
- 22. Bedir E, Pugh N, Çalış I, Pasco DS, Khan IA. Immunostimulatory effects of cycloartane-type triterpene glycosides from Astragalus species. Biological and Pharmaceutical Bulletin. 2000;23:834–837. doi: 10.1248/bpb.23.834. [DOI] [PubMed] [Google Scholar]
- 23. Zheng Y, Dai Y, Liu W, Wang N, Cai Y, et al. Astragaloside IV enhances taxol chemosensitivity of breast cancer via caveolin-1-targeting oxidant damage. Journal of Cellular Physiology. 2019;234:4277–4290. doi: 10.1002/jcp.27196. [DOI] [PubMed] [Google Scholar]
- 24. Zhou X, Liu Z, Long T, Zhou L, Bao Y. Immunomodulatory effects of herbal formula of Astragalus polysaccharide (APS) and Polysaccharopeptide (PSP) in mice with lung cancer. International Journal of Biological Macromolecules. 2018a;106:596–601. doi: 10.1016/j.ijbiomac.2017.08.054. [DOI] [PubMed] [Google Scholar]
- 25. Zhou R, Chen H, Chen J, Chen X, Wen Y, et al. Extract from Astragalus membranaceus inhibit breast cancer cells proliferation via PI3K/ AKT/mTOR signaling pathway. BMC Complementary and Alternative Medicine. 2018b;18:83–91. doi: 10.1186/s12906-018-2148-2. [DOI] [PMC free article] [PubMed] [Google Scholar]
- 26. Li W, Hu X, Wang S, Jiao Z, Sun T, et al. Characterization and antitumor bioactivity of Astragalus polysaccharides by immunomodulation. International Journal of Biological Macromolecules. 2020;15:985–997. doi: 10.1016/j.ijbiomac.2019.09.189. [DOI] [PubMed] [Google Scholar]
- 27. Isilar O, Bulut A, Sahin Yaglioglu A, Demirtas I, Arat E, et al. Synthesis and biological evaluation of novel urea, thiourea and squaramide diastereomers possessing sugar backbone. Carbohydrate Research. 2020;492:107991. doi: 10.1016/j.carres.2020.107991. [DOI] [PubMed] [Google Scholar]
- 28. Kursun Aktar BS, Sicak Y, Tok TT, Emre EE, Sahin Yaglioglu A, et al. Designing heterocyclic chalcones, benzoyl/sulfonyl hydrazones: An insight into their biological activities and molecular docking study. Journal of Molecular Structure. 2020;1211:128059. doi: 10.1016/j.molstruc.2020.128059. [DOI] [Google Scholar]
- 29. Karakus G, Kaplan Can H, Sahin Yaglioglu A. Synthesis, structural characterization, thermal behavior and cytotoxic/antiproliferative activity assessments of poly(maleic anhydride-alt-acrylic acid)/hydroxyurea polymer/drug conjugate. Journal of Molecular Structure. 2020;1210:127989. doi: 10.1016/j.molstruc.2020.127989. [DOI] [Google Scholar]
- 30. Ceylan M, Erkan S, Sahin Yaglioglu A, Akdogan Uremis N, Koç E. Antiproliferative evaluation of some 2-[2-(2-Phenylethenyl)-cyclopent-3-en-1-yl]-1,3-benzothiazoles: DFT and molecular docking study. Chemistry & Biodiversity. 2020;17(4):e1900675. doi: 10.1002/cbdv.201900675. [DOI] [PubMed] [Google Scholar]
- 31. Chandra JH, Fritz Z, Eberhard B. Carbon-13 chemical shift assignments of chromones and isoflavones. Canadian Journal of Chemistry. 1980;58:1211–1219. doi: 10.1139/v80-189. [DOI] [Google Scholar]
- 32. Kobayashi A, Yata S, Kawazu K. A β-Hydroxychalcone and flavonoids from alfalfa callus stimulated by fungal naphthoquinone, PO-1. Agricultural and Biological Chemistry. 1988;52:223–3227. doi: 10.1080/00021369.1988.10869219. [DOI] [Google Scholar]
- 33. Miyazawa M, Ando H, Okuno Y, Araki H. Biotransformation of isoflavones by Aspergillus niger, as biocatalyst. Journal of Molecular Catalysis B: Enzymatic. 2004;27:91–95. doi: 10.1016/j.molcatb.2003.09.008. [DOI] [Google Scholar]
- 34. Farag MA, Huhman DV, Dixon RA, Sumner LW. Metabolomics reveals novel pathways and differential mechanistic and elicitor-specific responses in phenylpropanoid and isoflavonoid biosynthesis in Medicago truncatula. Cell Cultures1[C][W][OA] Plant Physiology. 2008;146:387–402. doi: 10.1104/pp.107.108431. [DOI] [PMC free article] [PubMed] [Google Scholar]
- 35. Chiriac ER, Chitescu CL, Borda D, Lupoae M, Gird CE, et al. Comparison of the polyphenolic profile of Medicago sativa L. and Trifolium pratense L. sprouts in different germination stages using the UHPLC-Q exactive hybrid quadrupole orbitrap high-resolution mass spectrometry. Molecules. 2020;25(10):149–151. doi: 10.3390/molecules25102321. [DOI] [PMC free article] [PubMed] [Google Scholar]
- 36. Patron-Gonzalez D, Rios-Gomez R, Flores-Morales V, Rios MY. Metabolites of Machaerium isadelphum as chemophenetic markers of Machaerium genus. Biochemical Systematics and Ecology. 2021;94:104202. doi: 10.1016/j.bse.2020.104202. [DOI] [Google Scholar]
- 37. Lenssen AW, Martin SS, Townsend CE, Hawkins B. Acicerone: An Isoflavone From Astragalus cicer. Phtochemistry. 1994;36(5):1185–1187. https://works.bepress.com/andrew_lenssen/67/ [Google Scholar]
- 38. Bedir E, Calıs I, Aquino R, Piacente S, Pizza C. Trojanoside H: a cycloartane-type glycoside from the aerial parts of Astragalus trojanus. Phytochemistry. 1999;51:1017–1020. doi: 10.1016/S0031-9422(99)00035-7. [DOI] [Google Scholar]
- 39. Abd El-Latif RR, Shabana MH, El-Gandour AH, Mansour RM, Sharaf MA. New Isoflavone from Astragalus peregrinus. Chemistry of Natural Compounds. 2003;39:536–537. doi: 10.1023/B:CONC.0000018105.23722.7d. [DOI] [Google Scholar]
- 40.Gülcemal D, Aslanipour B, Bedir E. Secondary Metabolites from Turkish Astragalus Species. In: Ozturk M, Hakeem K, editors. Plant and Human Health. Vol. 2. Springer; Cham: 2019. [DOI] [Google Scholar]
- 41. Kar S, Akhir A, Chopra S, Ohki S, Karanam B, et al. Benzopyrylium salts as new anticancer, antibacterial, and antioxidant agents. Medicinal Chemistry Research. 2021;30:877–885. doi: 10.1007/s00044-020-02685-3. [DOI] [PMC free article] [PubMed] [Google Scholar]
- 42. Sahin A, Cakmak O, Demirtas I, Okten S, Tutar A. Efficient and selective synthesis of quinoline derivatives”. Tetrahedron. 2008;64(43):10068–10074. [Google Scholar]
- 43. Akrawi OA, Mohammed HH, Langer P. Synthesis and Suzuki—Miyaura Reactions of 3,6, 8-Tribromoquinoline: A Structural Revision. ChemInform Abstract. 2013 doi: 10.1002/chin.201339162. [DOI] [Google Scholar]
- 44. Casal JJ, Asis SE. Natural and synthetic quinoline derivatives as antituberculosis. Agents. 2017;2(1):1007–1009. [Google Scholar]
- 45. Starratt AN, Caveney S. Quinoline-2-carboxylic acids from Ephedra species. Phytochemistry. 1996;4(5):1477–1478. [Google Scholar]
- 46. Akhmedzhanova VI, Rasulova KA, Bessonova IA, Shashkov AS, Abdullaev ND, et al. A new type quinoline alkaloid from plants of the Haplophyllum genus. Chemistry of Natural Compounds. 2005;41(1):60–64. [Google Scholar]
- 47. Li YK, Zhao QJ, Hu J, Zou Z, He XY, et al. Two New quinoline alkaloid mannopyranosides from Solidago canadensis. Helvetica. 2009;92(5):928–931. [Google Scholar]
- 48. Kumar R, Duffy S, Avery VA, Carroll AR, Davis RA. Microthecaline a, a quinoline serrulatane alkaloid from the roots of the australian desert plant Eremophila microtheca. Journal of Natural Products. 2018;81(4):1079–1083. doi: 10.1021/acs.jnatprod.7b00992. [DOI] [PubMed] [Google Scholar]
- 49. Yamashita M, Saito Y, Rahim A, Fukuyoshi S, Miyake K, et al. Novel furoquinolinones from an Indonesian Plant, Lunasia amara. Tetrahedron Letters. 2020;61(20):151861. [Google Scholar]
- 50. Robertson LP, Makwana V, Voser TM, Holland DC, Carroll AR. Leptanoine D, a new quinoline alkaloid from the australian tree Pitaviaster haplophyllus (Rutaceae) Australian Journal of Chemistry. 2021;74(3):173–178. [Google Scholar]
- 51. Wulff P, Carle JS, Christophersen C. Marine alkaloids—6. The first naturally occurring bromo-substituted quinoline from Flustra foliacea. Comparative Biochemistry and Physiology Part B: Comparative Biochemistry. 1982;71(3):525–526. [Google Scholar]
- 52. [accessed 16, 09, 2021]. Website https://chemistry.stackexchange.com/questions/103925/exceptions-to-the-nitrogen-rule-in-mass-spectrometry.
- 53.Separation Science. 2021. [accessed 06, 04, 2021]. [online]. Website https://blog.sepscience.com/massspectrometry/the-role-of-isotope-peak-intensities-obtained-using-mass-spectrometry-in-determining-an-elemental-composition-part-2.
- 54. Moreno J, Fatela F, Leorri E, Araujo MF, Moreno F, et al. Bromine enrichment in marsh sediments as a marker of environmental changes driven by Grand Solar Minima and anthropogenic activity (Caminha, NW of Portugal) Science of the Total Environment. 2015;506–507:554–566. doi: 10.1016/j.scitotenv.2014.11.062. [DOI] [PubMed] [Google Scholar]
- 55. McCall AS, Cummings CF, Bhave G, Vanacore R, Page-McCaw A, et al. Bromine is an essential trace element for assembly of collagen IV scaffolds in tissue development and architecture. Cell. 2014;157:1380–1392. doi: 10.1016/j.cell.2014.05.009. [DOI] [PMC free article] [PubMed] [Google Scholar]
- 56. Shtangeeva I, Niemela M, Peramaki P. Effects of bromides of potassium and ammonium on some crops. Journal of Plant Nutrition. 2019;42:2209–2220. doi: 10.1080/01904167.2019.1655037. [DOI] [Google Scholar]
- 57. Gribble GW. The diversity of naturally occurring organobromine compounds. Chemical Society Reviews. 1999;28:335–346. doi: 10.1039/A900201D. [DOI] [Google Scholar]
- 58. Karagöz A, Turgut-Kara N, Çakır Ö, Demirgan R, Arı Ş. Cytotoxic Activity of Crude Extracts from Astragalus chrysochlorus (Leguminosae) Biotechnology & Biotechnological Equipment. 2007;21(2):220–222. [Google Scholar]
- 59. Jozwiak M, Filipowska A, Fiorino F, Struga M. Anticancer activities of fatty acids and their heterocyclic derivatives. European Journal of Pharmacology. 2020;871:172937. doi: 10.1016/j.ejphar.2020.172937. [DOI] [PubMed] [Google Scholar]
- 60. Al-Snafi AE. Chemical constituents and pharmacological effects of Astragalus hamosus and Astragalus tribuloides grown in Iraq. Asian Journal of Pharmaceutical Sciences. 2015;5(4):321–328. [Google Scholar]
- 61. Krasteva I, Platikanov S, Nikolov S, Kaloga M. Flavonoids from Astragalus hamosus. Natural Product Research. 2007;21(5):392–395. doi: 10.1080/14786410701236871. [DOI] [PubMed] [Google Scholar]
- 62. Krasteva I, Momekov G, Zdraveva P, Konstantinov S, Nikolov S. Antiproliferative effects of a flavonoid and saponins from Astragalus hamosus against human tumor cell lines. Pharmacognosy Magazine. 2008;4:269–272. http://www.phcog.com/text.asp?2008/4/16/269/57997 . [Google Scholar]
- 63. Shaikh AM, Shrivastava B, Apte KG, Navale SD. Medicinal plants as potential source of anticancer agents: a review. Journal of Pharmacognosy and Phytochemistry. 2016;5(2):291–295. [Google Scholar]
- 64. Liu C, Wang K, Zhuang J, Gao C, Li H, et al. The modulatory properties of Astragalus membranaceus treatment on triple-negative breast cancer: an integrated pharmacological method. Frontiers in Pharmacology. 2019;10:1171–1184. doi: 10.3389/fphar.2019.01171. [DOI] [PMC free article] [PubMed] [Google Scholar]
- 65. Mehraban F, Mostafazadeh M, Sadeghi H, Azizi A, Toori MA, et al. Anticancer activity of Astragalus ovinus against 7, 12 dimethyl benz (a) anthracene (DMBA)-induced breast cancer in rats. Avicenna Journal of Phytomedicine. 2020;10(5):533–545. [PMC free article] [PubMed] [Google Scholar]
- 66. Al-Harbi NA, Awad NS, Alsberi HM, Abdein MA. Apoptosis Induction, Cell Cycle Arrest and in vitro Anticancer Potentiality of Convolvulus spicatus and Astragalus vogelii. World. 2019;8:69–75. [Google Scholar]
- 67. Zhu J, Zhang H, Zhu Z, Zhang Q, Ma X, et al. Effects and mechanism of flavonoids from Astragalus complanatus on breast cancer growth. Naunyn-Schmiedeberg’s Archives of Pharmacology. 2015;388:965–972. doi: 10.1007/s00210-015-1127-0. [DOI] [PubMed] [Google Scholar]
- 68. Gupta M, Jun Lee H, Barden CJ, Weaver DF. The Blood–Brain Barrier (BBB) Score. Journal of Medicinal Chemistry. 2019;62(21):9824–9836. doi: 10.1021/acs.jmedchem.9b01220. [DOI] [PubMed] [Google Scholar]
- 69. Shweta M, Rashmi D. In vitro ADME studies of TUG-891, a GPR-120 inhibitor using Swiss ADME predictor. Journal of Drug Delivery Science and Technology. 2019;9(2-S):266–369. doi: 10.22270/jddt.v9i2-s.2710. [DOI] [Google Scholar]
Associated Data
This section collects any data citations, data availability statements, or supplementary materials included in this article.
Supplementary Materials
1H NMR spectrum and HMBC correclations of compound 1 (600 MHz, CDCl3)
13C NMR spectrum of compound 1 (150 MHz, CDCl3)
DEPT NMR spectrum of compound 1 (150 MHz, CDCl3)
HPLC/TOF-MS chromatogram of compound 2
Mass spectrum of compound 2
1H NMR spectrum of compound 2 (600 MHz, CDCl3)
HMBC spectrum of compound 2 (600 MHz, CDCl3)
1H NMR spectrum of compound 2 taken with D2O (600 MHz, CDCl3)
13C NMR spectrum of compound 2 (150 MHz, CDCl3)
DEPT NMR spectrum of compound 2 (150 MHz, CDCl3)
HSQC NMR spectrum of compound 2 (600 MHz, CDCl3)
COSY NMR spectrum of compound 2 (600 MHz, CDCl3)
HPLC/TOF-MS chromatogram of compound 3–4 mix
GC-MS chromatogram of compound 3–4 mix
1H NMR spectrum of compound 3–4 mix (600 MHz, CDCl3)
13C NMR spectrum of compound 3–4 mix (150 MHz, CDCl3)
DEPT NMR spectrum of compound 3–4 mix (150 MHz, CDCl3)
COSY spectrum of compound 3–4 mix (600 MHz, CDCl3)
HSQC spectrum of compound 3–4 mix (600 MHz, CDCl3)
The mass spectra and structure of compound 3–4 mix
HMBC NMR spectrum and correlations of compound 3–4 mix (600 MHz, CDCl3)
Table S1.
1H, 13C NMR, and DEPT data of compound 2
| Position | 1H | 13C | DEPT |
|---|---|---|---|
| Compound 2 | |||
| 2 | 7.92 (1H, s) | 152.04 | CH |
| 3 | - | 124.17 | C |
| 4 | - | 175.65 | C |
| 5 | 7.65 (1H, s) | 104.96 | CH |
| 6 | - | 145.53 | C |
| 7 | - | 152.45 | C |
| 8 | 6.97 (1H, s) | 102.47 | CH |
| 8a | - | 151.15 | C |
| 4a | - | 117.93 | C |
| 1′ | - | 124.31 | C |
| 2′ | 7.50 (2H, dt, J=2.0, 8.0 Hz) | 130.58 | CH |
| 3′ | 6.97 (2H, dt, J=2.0, 8.0 Hz) | 114.38 | CH |
| 4′ | - | 159.49 | C |
| 5′ | 6.97 (2H, dt, J=2.0, 8.0 Hz) | 114.38 | CH |
| 6′ | 7.50 (2H, dt, J=2.0, 8.0 Hz) | 130.58 | CH |
| OMe | 3.83 (3H, s) | 55.46 | CH3 |
| 4.01 (3H, s) | 56.66 | CH3 | |
| OH | 6.27 (1H, s) | - | - |