Abstract
Carcinoembryonic antigen (CEA), carbohydrate antigen 19-9 (CA19-9), carbohydrate antigen 125 (CA125), and alpha-fetoprotein (AFP) are widely used tumor markers for colorectal cancer (CRC), but their clinical significance is unknown when the levels of these tumor markers were within the normal range. This retrospective study included 2145 CRC patients. The entire cohort was randomly divided into training and validation datasets. The optimal cut-off values of tumor markers were calculated using X-tile software, and univariate and multivariate analyses were performed to assess its association with overall survival (OS). The nomogram model was constructed and validated. The entire cohort was randomly divided into a training dataset (1502 cases, 70%) and a validation dataset (643 cases,30%). Calculated from the training dataset, the optimal cut-off value was 2.9 ng/mL for CEA, 10.1 ng/mL for CA19-9, 13.4 U/mL for CA125, and 1.8 ng/mL for AFP, respectively. Multivariate analysis revealed that age, tumor location, T stage, N stage, preoperative CA19-9, and CA125 levels were independent prognostic predictors. Even within the normal range, CRC patients with relatively high levels of CA19-9 or CA125 worse OS compared to those with relatively low levels. Then, based on the independent prognostic predictors from multivariate analysis, two models with/without (model I/II) CA19-9 and CA125 were built, model I showed better prediction and reliability than model II. Within the normal range, relatively high levels of preoperative CA19-9 and CA125 were significantly associated with poor OS in CRC patients. The nomogram based on CA19-9 and CA125 levels showed improved predictive accuracy ability for CRC.
Subject terms: Prognostic markers, Colorectal cancer, Cancer models, Tumour biomarkers, Colorectal cancer, Prognostic markers
Introduction
Colorectal cancer (CRC) is currently the third leading cause of cancer globally, and it represents the second highest number of cancer-related deaths worldwide. In recent years, the incidence and mortality rates of CRC are steadily increasing, constituting a substantial menace to public health1. Owing to the absence of distinct symptoms during the initial phases of CRC, the rate of diagnosis remains depressingly low, with most patients presenting themselves for medical evaluation only when the disease has already progressed to advanced stages. Consequently, this delay results in the missed opportunity for optimal therapeutic interventions. Despite combinations of many advanced therapies for CRC have improved early detection and treatment, radical surgery is still the optimal treatment and the prognosis of patients is still not promising2. Moreover, accurate prediction of the prognosis is of great importance for individualized treatment for CRC3.
Tumor markers can indicate the presence of cancer, more importantly, provide information about treatment response or progression4. Carcinoembryonic antigen (CEA)5, carbohydrate antigen 19-9 (CA19-9)6, carbohydrate antigen 125 (CA125)7, and alpha-fetoprotein (AFP)8 can be elevated in CRC patients, making them widely employed in the diagnosis and monitoring of CRC. Previous studies have shown that elevated levels of preoperative CEA, CA19-9, CA125, and AFP were associated with worse prognosis of CRC patients7,9–12. However, the prognostic value of preoperative CEA, CA19-9, CA125, and AFP with the normal range for CRC patients is unknown. Up to date, only two studies investigated the association between normal levels of CEA and the survivals of CRC patients13,14 and found that the prognosis of patients with relatively high levels of preoperative CEA was worse than that with relatively low levels of CEA in CRC patients. Therefore, the purpose of this study was to investigate the association between normal levels of preoperative serum CEA, CA19-9, CA125, and AFP and the prognosis of CRC patients after radical resection.
Patients and methods
From January 2010 to December 2018, a total of 5380 CRC patients treated with radical resection in the Department of Digestive Surgery, Xijing Hospital. Based on the inclusion criteria, a final selection yielded 2145 patients included in this study. The inclusion criteria were listed as follows: (1) histologically confirmed as colorectal adenocarcinoma, (2) without distant metastasis, (3) without other tumors, (4) without preoperative chemoradiotherapy, (5) with R0 resection, (6) levels of preoperative CEA, CA19-9, CA125 and AFP were all within the reference range, (7) with complete follow-up data. And Fig. 1 presents the flowchart of the selection process. The study was approved by the Ethics Committee of Xijing Hospital (ethical code: KY20222260-C-1). Informed consent was obtained from patients before operation.
Figure 1.

Flowchart of the CRC patients with training and validation datasets. CRC, Colorectal cancer; CEA, carcinoembryonic antigen; CA19-9, carbohydrate antigen 19-9; CA125, carbohydrate antigen 125; AFP, alpha-fetoprotein.
Clinicopathological data, including age, gender, tumor size, operative method, tumor location, differentiation status, T stage, N stage, TNM stage and levels of CEA, CA19-9, CA125 and AFP were recorded. The concentrations of CEA, CA19-9, CA125, and AFP were obtained using the Electrochemiluminescence Immunoassay (ECLIA) method. The reference range for tumor markers, considered as the normal range, is as follows: CEA ≤ 5 ng/mL, CA19-9 ≤ 27 U/mL, CA125 ≤ 35 U/mL, AFP ≤ 8.1 ng/mL, and all these markers were measured in Xijing hospital within 3 weeks before surgery. The patients were followed up every 3 months in the first 3 years and every 6 months thereafter. Overall survival (OS) is the time between the date of surgery and death from any cause.
The dataset was randomly divided into a training dataset (70%, n = 1502) and a validation dataset (30%, n = 643) using the “rand” function in Microsoft Excel. Differences in the distribution of variables between the training and validation dataset were analyzed by SPSS software (version 26, SPSS Inc. USA) using chi-square tests. The optimal cut-off values of levels of CEA, CA19-9, CA125 and AFP were calculated using X-Tile software (Yale University, V3.6.1) based on the training dataset. Risk factors with a p-value <0.1 in univariate analysis were included in the Cox model multivariate analysis. Factors with a p-value < 0.05 were considered as independent risk factor in the multivariate analysis. Nomogram was constructed by R software (www.r-project.org, version 4.0.5) based on independent risk factors. The predictive accuracy of nomograms was measured by calibration curve and concordance index (C-index) in the training and validation dataset. The area under curve (AUC) of the receiver operating characteristic (ROC) curve was calculated to compare the predictive accuracy between the two models. OS was assessed by the Kaplan-Meier method through GraphPad Prism 8 (GraphPad Software, Inc., USA). A p-value < 0.05 was considered statistically significant.
Ethical approval and consent to participate, informed consent
The chart review did not personally identifiable data, and its findings were presented as averaged datasets for each center. The study was conducted in accordance with the Declaration of Helsinki, and approved by the Ethics Committee of Xijing Hospital (ethical code: KY20222260-C-1,2022.11.07). Informed consent was obtained from all individual participants included in the study. Informed consent was obtained from all subjects involved in the study.
Results
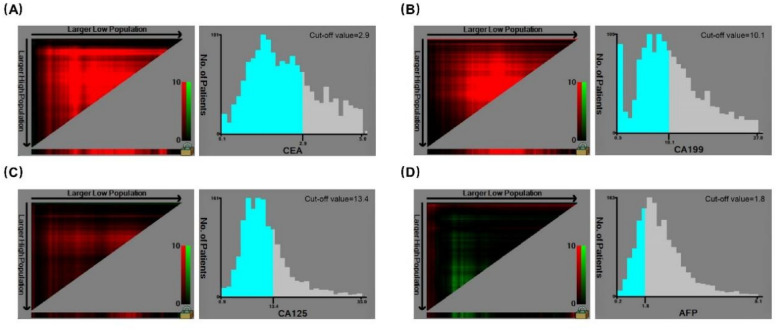
There were 1269 male (59.2%) and 876 (40.8%) female. The median age was 61 years (range 21–93 years). The follow-up period ranged from 2.6 to 144.6 months with a mean of 65.7 months and a median of 64.8 months. During follow-up, 390 patients died, accounting for 18.2% of the entire cohort. The 5-, and 10-year OS rate was 84.6% and 74.4%, respectively. The study cohort was randomly divided into a training dataset (1502 cases, 70%) and a validation dataset (643 cases, 30%). Calculated from the training dataset, the optimal cut-off value was 2.9 ng/mL for CEA, 10.1 ng/mL for CA19-9, 13.4 U/mL for CA125 and 1.8ng/mL for AFP, respectively (Fig 2). All the parameters were comparable between the two datasets (Table 1).
Figure 2.
Cut-off value of serum CEA and CA19-9, CA125, and AFP levels for the OS of CRC as calculated using X-tile. CRC, Colorectal cancer; CEA, carcinoembryonic antigen; CA19-9, carbohydrate antigen 19-9; CA125, carbohydrate antigen 125; AFP, alpha-fetoprotein; OS, overall survival.
Table 1.
Clinicopathological characteristics of the entire cohort and the comparison of variable consistency between training and validation datasets.
| Variables | Total (%) | Training (%) | Validation (%) | P-value |
|---|---|---|---|---|
| N = 2145 | N = 1502 | N = 643 | ||
| Age (years) | 0.713 | |||
| < 70 | 1639 (76.4) | 1151 (76.6) | 488 (75.9) | |
| ≥ 70 | 506 (23.6) | 351 (23.4) | 155 (24.1) | |
| Gender | 0.893 | |||
| Male | 1269 (59.2) | 890 (59.3) | 379 (58.9) | |
| Female | 876 (40.8) | 612 (40.7) | 264 (41.1) | |
| Tumor size (cm) | 0.668 | |||
| < 5 | 1515 (70.6) | 1065 (70.9) | 450 (70.0) | |
| ≥ 5 | 630 (29.4) | 437 (29.1) | 193 (30.0) | |
| Operative method | 0.155 | |||
| Open | 746 (34.8) | 508 (33.8) | 238 (37.0) | |
| Laparoscopic | 1399 (65.2) | 994 (66.2) | 405 (63.0) | |
| Tumor location | 0.359 | |||
| Right-sided colon | 412 (19.2) | 281 (18.7) | 131 (20.4) | |
| Left-sided colon | 434 (20.2) | 315 (21.0) | 119 (18.5) | |
| Rectum | 1299 (60.6) | 906 (60.3) | 393 (61.1) | |
| Differentiation status | 0.619 | |||
| Well | 253 (11.8) | 180 (12.0) | 73 (11.4) | |
| Moderate | 1506 (70.2) | 1062 (70.7) | 444 (69.1) | |
| Poor | 200 (9.3) | 133 (8.9) | 67 (10.4) | |
| Mucinous | 186 (8.7) | 127 (8.5) | 59 (9.2) | |
| T stage | 0.375 | |||
| Tis/T1 | 252 (11.7) | 178 (11.9) | 74 (11.5) | |
| T2 | 505 (23.5) | 353 (23.5) | 152 (23.6) | |
| T3 | 1239 (57.8) | 876 (58.3) | 363 (56.5) | |
| T4 | 149 (6.9) | 95 (6.3) | 54 (8.4) | |
| N stage | 0.935 | |||
| N0 | 1396 (65.1) | 975 (64.9) | 421 (65.5) | |
| N1 | 529 (24.7) | 372 (24.8) | 157 (24.4) | |
| N2 | 220 (10.3) | 155 (10.3) | 65 (10.1) | |
| Stage (AJCC 8th edition) | 0.991 | |||
| I | 621 (29.0) | 436 (29.0) | 185 (28.8) | |
| II | 775 (36.1) | 539 (35.9) | 236 (36.7) | |
| III | 749 (34.9) | 527 (35.1) | 222 (34.5) | |
| Preoperative CEA | 0.816 | |||
| < 2.9 ng/mL | 1522(71.0) | 1068 (71.1) | 454 (70.6) | |
| ≥ 2.9 ng/mL | 623(29.0) | 434 (28.9) | 189 (29.4) | |
| Preoperative AFP | 0.167 | |||
| < 1.8 ng/mL | 613 (28.6) | 416 (27.7) | 197 (30.6) | |
| ≥ 1.8 ng/mL | 1532 (71.4) | 1086 (72.3) | 446 (69.4) | |
| Preoperative CA125 | 0.713 | |||
| < 13.4 U/mL | 1523 (71.0) | 1070 (71.2) | 453 (70.5) | |
| ≥ 13.4 U/mL | 622 (29.0) | 432 (28.8) | 190 (29.5) | |
| Preoperative CA19-9 | 0.696 | |||
| < 10.1 U/mL | 1158 (54.0) | 815 (54.3) | 343 (53.3) | |
| ≥ 10.1 U/mL | 987 (46.0) | 687 (45.7) | 300 (46.7) |
AJCC, American Joint Committee on Cancer; CEA, carcinoembryonic antigen; CA19-9, carbohydrate antigen 19–9; CA125, carbohydrate antigen 125; AFP, alpha-fetoprotein.
Univariate analysis revealed that age, tumor location, differentiation status, T stage, N stage, preoperative CEA, CA19-9 and CA125 levels were associated with the prognosis of patients (p-value < 0.1) (Table 2). Multivariate analysis showed that age, tumor location, T stage, N stage, preoperative CA19-9 and CA125 levels were independent prognostic predictors (p-value < 0.05) (Table 3).
Table 2.
Univariate analyses of OS in the training datasets.
| Variables | β | HR (95%CI) | P-value |
|---|---|---|---|
| Age (years) | |||
| < 70 | Reference | ||
| ≥ 70 | 0.582 | 1.789 (1.382–2.318) | < 0.001 |
| Gender | |||
| Male | Reference | ||
| Female | − 0.027 | 0.973 (0.757–1.251) | 0.832 |
| Tumor size (cm) | |||
| < 5 | Reference | ||
| ≥ 5 | –0.198 | 0.821 (0.619–1.088) | 0.170 |
| Operative method | |||
| Open | Reference | ||
| Laparoscopic | − 0.014 | 0.986 (0.762–1.275) | 0.914 |
| Tumor location | 0.010 | ||
| Right-sided colon | Reference | ||
| Left-sided colon | 0.377 | 1.459 (0.930–2.287) | 0.100 |
| Rectum | 0.579 | 1.784 (1.217–2.615) | 0.003 |
| Differentiation status | 0.004 | ||
| Well | Reference | ||
| Moderate | − 0.018 | 0.982 (0.672–1.436) | 0.927 |
| Poor | 0.649 | 1.914 (1.184–3.093) | 0.008 |
| Mucinous | 0.155 | 1.168 (0.683–1.996) | 0.570 |
| T stage | < 0.001 | ||
| Tis/T1 | Reference | ||
| T2 | 0.420 | 1.523 (0.811–2.858) | 0.191 |
| T3 | 1.073 | 2.924 (1.662–5.142) | < 0.001 |
| T4 | 1.847 | 6.338 (3.360–11.955) | < 0.001 |
| N stage | < 0.001 | ||
| N0 | Reference | ||
| N1 | 0.842 | 2.321 (1.734–3.106) | < 0.001 |
| N2 | 1.684 | 5.384 (3.967–7.308) | < 0.001 |
| Preoperative CEA | |||
| < 2.9 ng/mL | Reference | ||
| ≥ 2.9 ng/mL | 0.459 | 1.582 (1.227–2.041) | < 0.001 |
| Preoperative AFP | |||
| < 1.8 ng/mL | Reference | ||
| ≥ 1.8 ng/mL | − 0.214 | 0.807 (0.622–1.048) | 0.107 |
| Preoperative CA125 | |||
| < 13.4 U/mL | Reference | ||
| ≥ 13.4 U/mL | 0.346 | 1.414 (1.093–1.829) | 0.008 |
| Preoperative CA19-9 | |||
| < 10.1 U/mL | Reference | ||
| ≥ 10.1 U/mL | 0.550 | 1.733 (1.351–2.223) | < 0.001 |
β, Beta; HR, Hazard Ratio; CI, Confidence Interval; CEA, carcinoembryonic antigen; CA19-9, carbohydrate antigen 19–9; CA125, carbohydrate antigen 125; AFP, alpha-fetoprotein.
Table 3.
Multivariate analyses of overall survival (OS) in the training datasets.
| Variables | β | HR (95%CI) | P-value |
|---|---|---|---|
| Age (years) | |||
| < 70 | Reference | ||
| ≥ 70 | 0.609 | 1.838 (1.440–2.397) | < 0.001 |
| Tumor location | < 0.001 | ||
| Right-sided colon | Reference | ||
| Left-sided colon | 0.249 | 1.282 (0.810–2.031) | 0.298 |
| Rectum | 0.730 | 2.074 (1.378–3.122) | < 0.001 |
| Differentiation status | 0.287 | ||
| Well | Reference | ||
| Moderate | -0.196 | 0.822 (0.555–1.218) | 0.329 |
| Poor | 0.157 | 1.170 (0.706–1.939) | 0.541 |
| Mucinous | -0.094 | 0.911 (0.519–1.598) | 0.744 |
| T stage | < 0.001 | ||
| Tis/T1 | Reference | ||
| T2 | 0.286 | 1.331 (0.699–2.532) | 0.384 |
| T3 | 0.847 | 2.334 (1.289–4.224) | 0.005 |
| T4 | 1.381 | 3.979 (1.997–7.930) | < 0.001 |
| N stage | < 0.001 | ||
| N0 | Reference | ||
| N1 | 0.601 | 1.825 (1.344–2.477) | < 0.001 |
| N2 | 1.248 | 3.484 (2.471–4.913) | < 0.001 |
| Preoperative CEA | |||
| < 2.9 ng/mL | Reference | ||
| ≥ 2.9 ng/mL | 0.191 | 1.210 (0.932–1.572) | 0.152 |
| Preoperative CA125 | |||
| < 13.4 U/mL | Reference | ||
| ≥ 13.4 U/mL | 0.363 | 1.437 (1.103–1.872) | 0.007 |
| Preoperative CA19-9 | |||
| < 10.1 U/mL | Reference | ||
| ≥ 10.1 U/mL | 0.396 | 1.486 (1.153–1.915) | 0.002 |
β, Beta; HR, Hazard Ratio; CI, Confidence Interval; CEA, carcinoembryonic antigen; CA19-9, carbohydrate antigen 19-9; CA125, carbohydrate antigen 125.
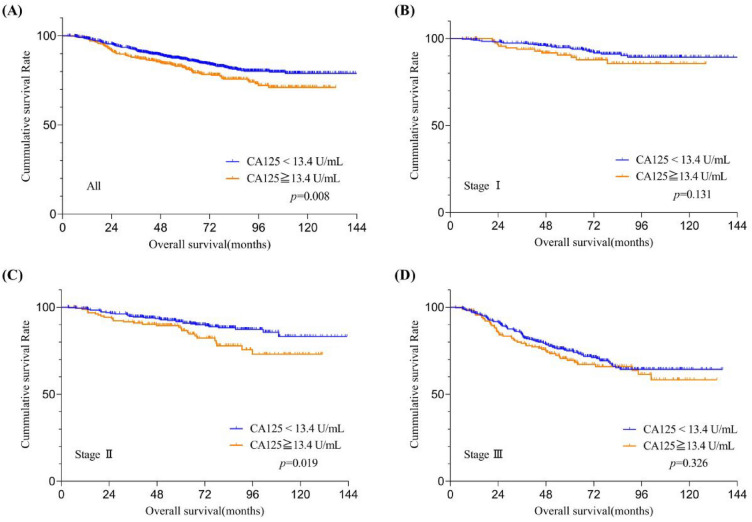
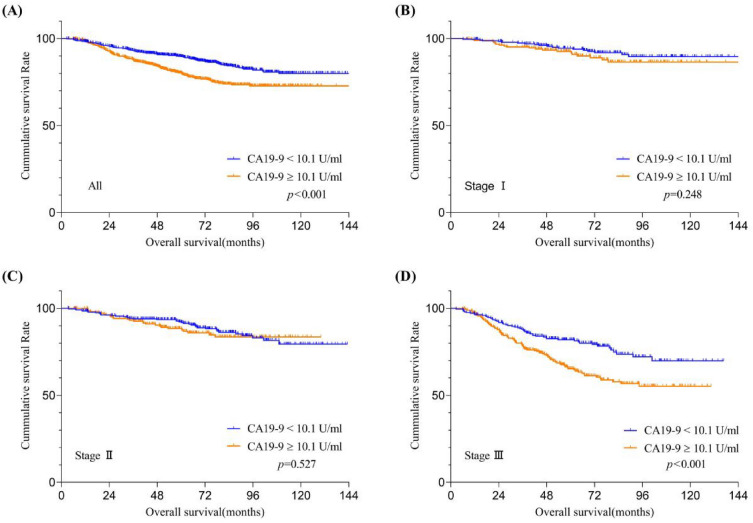
The OS of patients stratified by CA19-9 and CA125 levels were shown in Figs. 3A and 4A. The OS of patients with relatively high CA19-9 or CA125 levels was significantly worse than that with relatively low levels (both p < 0.05). Subgroup analysis based on the TNM stage system reveals that among stage II CRC patients, those with relatively high preoperative serum CA125 levels exhibit a significantly lower OS rate compared to patients that with relatively low levels (Fig. 3C, p = 0.019); however, this phenomenon was not observed in stage I (Fig. 3B, p = 0.131) and stage III (Fig. 3D, p = 0.326) CRC patients. Similarly, in stage III CRC patients, those with relatively high preoperative serum CA19-9 levels exhibit a significantly lower OS rate compared to patients that with relatively low levels (Fig. 4D, p < 0.001); yet, this trend was not discerned in stage I (Fig. 4B, p = 0.248) and stage II (Fig. 4C, p = 0.527) CRC patients.
Figure 3.
Overall survival curves stratifified by preoperative serum CA125 levels according to tumor stage. Patients with (A) all training datasets and American Joint Committee on Cancer 7th stage (B) I, (C) II, and (D) III in the training datasets. CA125,carbohydrate antigen 125.
Figure 4.
Overall survival curves stratifified by preoperative serum CA19-9 levels according to tumor stage. Patients with (A) all training datasets and American Joint Committee on Cancer 7th stage (B) I, (C) II, and (D) III in the training datasets. CA19-9, carbohydrate antigen 19-9.
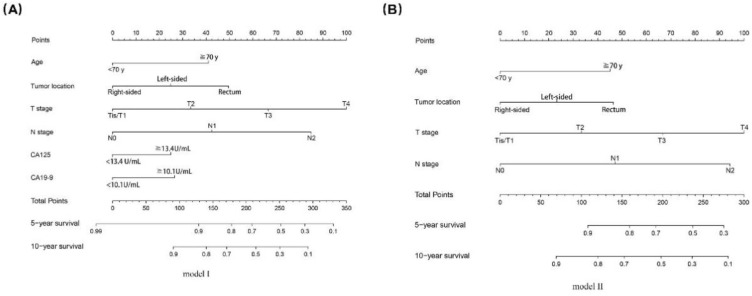
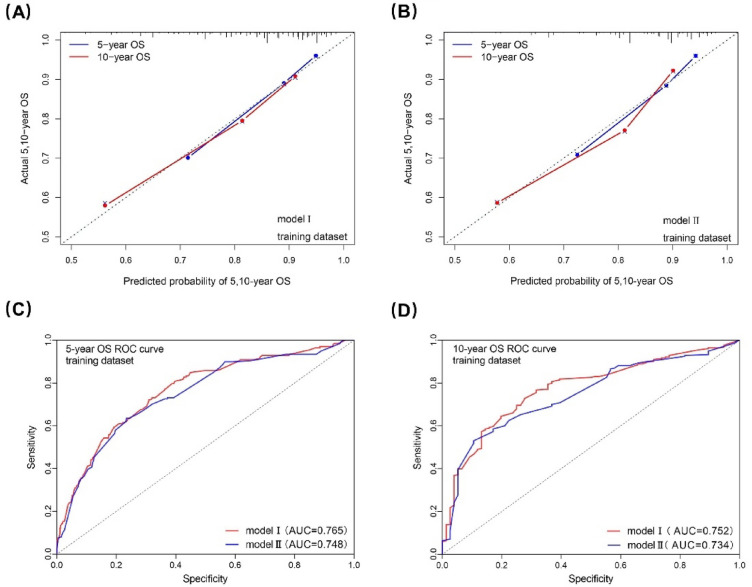
Two nomogram models with/without (model I/II) CA19-9 and CA125 were built based on the independent prognostic predictors from multivariate analysis (Fig. 5). The performance of model I/II were assessed with C-index, calibration curve and AUC. In the training dataset, the C-index was 0.734(0.701-0.766) and 0.729(0.695-0.763) for model I and II, which indicated that both the two models had good predictive discrimination. Furthermore, the calibration curve showed a high consistency between prediction and actual observation in both of the two models (Fig. 6A,B). According to ROC curve analysis, AUC about the 5- and 10-year OS prediction of model I was higher than that of model II (0.765 vs 0.747 and 0.773 vs 0.746, respectively), which indicated that model I was performed better than model II in the training dataset (Fig. 6C,D).
Figure 5.
Two nomograms for predicting the 5- and 10-year OS of the training dataset. CA19-9, carbohydrate antigen 19-9; CA125, carbohydrate antigen 125.
Figure 6.
Calibration curves and ROC curves to model I/II for 5-, and 10-year OS in the training dataset. ROC, receiver operating characteristic; OS, overall survival; AUC, area under curve.
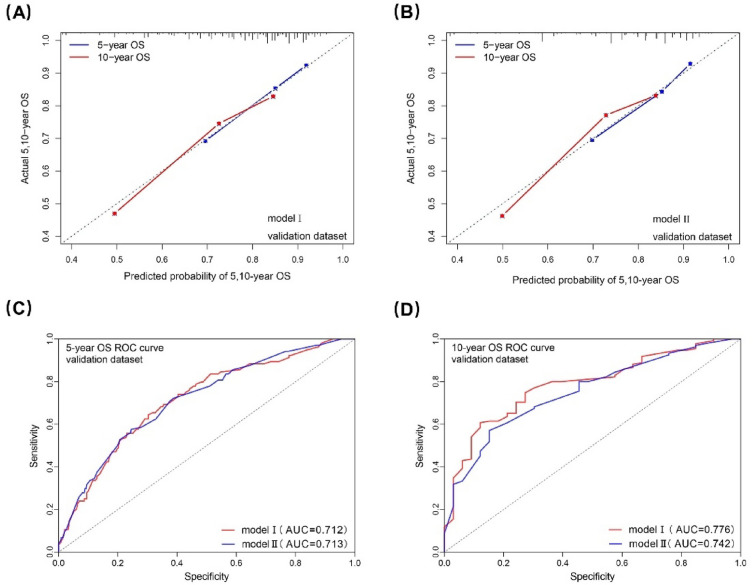
In the validation dataset, the C-index for model I and II was 0.691(0.644-0.739) and 0.699(0.650-0.748). The calibration curve also showed a high consistency between prediction and actual observation in both the two models (Fig. 7A,B). According to the ROC curve analysis, the AUC for the 5-year OS prediction of model I was comparable to that of model II (0.712 vs 0.713), and the AUC for the 10-year OS prediction of model I was higher than that of model II (0.776 vs 0.742), which indicated that model I was still performed better than model II in the validation dataset (Fig. 7C,D).
Figure 7.
Calibration curves and ROC curves to model I/II for 5-, and 10-year OS in the validation dataset. ROC, receiver operating characteristic; OS, overall survival; AUC, area under curve.
Discussion
CEA, CA19-9, CA125 and AFP are cell-surface glycoproteins produced by cancer cells and contributes to the malignant characteristics of tumors15–17. As commonly used serum tumor markers, they are easy to detect and convenient to use in clinical work. They are important for treatment planning because they are closely associated with the prognosis of CRC patients7,10,11. The association between elevated CEA, CA19-9, CA125 and AFP levels and the prognosis of CRC patients have been explored in a series of studies18–20. Only one study examined the prognostic value of preoperative CEA, CA19-9, CA125 and AFP in the normal range for patients with gastric cancer21. However, the prognostic value of these tumor markers within the normal range for CRC patients was unclear. The present study explored the association between normal levels of preoperative CEA, CA19-9, CA125 and AFP and prognosis of CRC patients. We found that relatively high levels of preoperative CA19-9 and CA125 were independent risk factors for OS of CRC patients. In addition, a nomogram based on normal CA19-9 and CA125 levels was built and showed improved predictive accuracy and prognostic discriminatory ability for CRC patients.
Serum CEA is the most common biomarker in CRC, and elevated CEA level is indicative of poor prognosis12. In fact, the preoperative serum CEA levels were within the normal range in approximately 60%-65% of CRC patients14,20. That means the preoperative serum CEA levels could not be used to aid the evaluation of the prognosis of majority of CRC patients. However, two studies investigated the association between the normal preoperative CEA levels and the prognosis of CRC patients recently. One showed that relatively high levels of preoperative serum CEA (2.1 ~ 5 ng/mL) was significantly associated with poor DFS and OS in CRC patients13. The other one also found that relatively high levels of preoperative CEA (2.4 ~ 5 ng/mL) was a significant risk factor for OS of the CRC patients14. However, the levels of AFP, CA19-9 and CA125 were unclear in the two studies. In our present study, patients with normal CEA levels but with elevated AFP, CA19-9 or CA125 levels were excluded, and the maximum follow-up time after surgery has been increased to 12 years, this may partially explain the different findings about the prognostic value of normal CEA levels between the previous and our present studies.
It is well known that no matter whether the preoperative tumor markers were within the normal range or not, the elevated postoperative tumor markers portend a poor prognosis in CRC22,23. However, the clinical significance of postoperative tumor markers within the normal range is unknown.
Univariate and multivariate analyses indicate that preoperative serum levels of CA125 and CA19-9 within the normal range remain significant independent prognostic factors for patients with CRC. This suggests that irrespective of the tumor stage, the overall levels of preoperative serum CA125 and CA19-9 are critical indicators of cancer prognosis. Subgroup analysis based on TNM stage demonstrates a significant relationship between preoperative serum CA125 levels and the prognosis of stage II patients. However, this relationship is not significantly evident in stage I and stage III patients. This could be attributed to the presence of other biological factors that may more profoundly influence the prognosis during the early and later stages of the tumor. Conversely, there is a very strong association between preoperative serum CA19-9 levels and the prognosis of CRC patients, indicating that for patients at a more advanced stage of CRC, CA19-9 might serve as a key biological marker. It can be utilized for prognostic evaluation and potentially constitutes an important consideration for targeted therapy. CA125 and CA19-9 exhibit varying degrees of significance across different tumor stages. When it comes to the treatment and prognostic evaluation of individual patients, it is imperative to make comprehensive judgments on the clinical relevance of these markers, taking into account the specific stage of the tumor and additional clinical information. These disparities also potentially point towards the necessity for further research to comprehensively understand the mechanisms of action and clinical utility values of various biomarkers at different stages.
Due to removal of the tumor, elevated preoperative tumor markers will decline, and the falling of the tumor markers was significantly associated with the prognosis of patients24. However, for patients with preoperative tumor markers within the normal range, it remains unclear whether the tumor markers will decline further after resection of tumor. Furthermore, it is also unclear whether there is a relationship between the extent of decline and prognosis of patients. Further studies are needed to investigate these questions.
Featured by visual and mathematical advantages, nomogram facilitates the clinical implementation and probability calculation of risk factor or other predictor variables. Although several nomograms had been developed to predict the OS for peritoneal metastasis, liver metastasis, and stage IV CRC, etc.25–27, nomogram for predicting the OS of CRC patients with normal levels of preoperative CEA, CA19-9, CA125 and AFP was lacking. In our present study, the nomogram showed good discriminatory capability and prediction accuracy. The variables in the nomogram can be easily obtained from routine clinical practice without extra financial burden on the patients. As a result, clinicians can use it to make a quick assessment of patient’s prognosis. The nomogram we have developed allows for the rapid calculation of a patient's survival time and probability based on several clinical input data. This tool aids physicians in explaining potential disease progression and prognosis to patients. It not only facilitates communication between doctors and patients but also enables patients to better comprehend their health status. Consequently, patients can participate more actively in the decision-making process regarding treatment options, potentially even reducing the waste of medical resources.
Our study posits that preoperative serum levels of CA19-9 and CA125 within the normal range are instrumental in identifying cohorts of high-risk patients who may require closer monitoring or more aggressive treatment approaches. In cases where CA19-9 and CA125 levels are comparatively elevated, we advocate for more frequent follow-up examinations and dynamic assessments. Moreover, we recognize that decision-making based solely on biomarker levels is insufficient. Instead, this should be a multifaceted decision-making process that comprehensively considers various clinical parameters, the patient's overall health status, and individual differences.
This study has several limitations. First, it was a single-center’s experience which may result in selection bias, so multicenter large-scale studies are needed to verify these findings. Second, the sample size was not large enough, especially for the patients with relatively high levels of CEA or CA125, or relatively low levels of AFP, which may also result in some extent of bias during analysis. Third, some risk factors reported in previous studies which was associated with the prognosis of CRC patients, such as perineural invasion28,29, microsatellite stability status30 and gene mutational status31 were not included in this study because of lack of data.
In conclusion, our study showed that, even within the normal range, relatively high levels of preoperative CA19-9 and CA125 were significantly associated with poor OS of CRC patients. The nomogram which based on CA19-9 and CA125 levels showed improved predictive accuracy and prognostic discriminatory ability for CRC. The findings may provide important indications for clinicians in the prognostic evaluation of CRC patients with normal levels of tumor markers.
Author contributions
All authors contributed to the data collection. G.R., R.L., G.Z., F.F., and J.Z. contributed to the study conception and design. The manuscript draft was written by GR. All co-authors commented on previous versions of the manuscript and approved the final version.
Funding
This work was supported by the National Natural Science Foundation of China (Grant No. 82072655).
Data availability
All data described in the manuscript will be freely available to any researcher wishing to use them for non-commercial purposes, without breaching participant confidentiality, and the data can be obtained by contacting the correspondence author.
Competing interests
The authors declare no competing interests.
Footnotes
Publisher's note
Springer Nature remains neutral with regard to jurisdictional claims in published maps and institutional affiliations.
These authors contributed equally: Guangming Ren, Ruikai Li, Gaozan Zheng.
Contributor Information
Jianyong Zheng, Email: zhjy68@163.com.
Fan Feng, Email: surgeonfengfan@163.com.
References
- 1.Sung H, et al. Global cancer statistics 2020: GLOBOCAN estimates of incidence and mortality worldwide for 36 cancers in 185 Countries. CA Cancer J. Clin. 2021;71:209–249. doi: 10.3322/caac.21660. [DOI] [PubMed] [Google Scholar]
- 2.Brown KGM, Solomon MJ, Mahon K, O'Shannassy S. Management of colorectal cancer. BMJ. 2019;366:l4561. doi: 10.1136/bmj.l4561. [DOI] [PubMed] [Google Scholar]
- 3.Benson AB, et al. Colon cancer, version 2.2021, NCCN clinical practice guidelines in oncology. J. Natl. Compr. Cancer Netw. 2021;19:329–359. doi: 10.6004/jnccn.2021.0012. [DOI] [PubMed] [Google Scholar]
- 4.Lech G, Słotwiński R, Słodkowski M, Krasnodębski IW. Colorectal cancer tumour markers and biomarkers: Recent therapeutic advances. World J. Gastroenterol. 2016;22:1745–1755. doi: 10.3748/wjg.v22.i5.1745. [DOI] [PMC free article] [PubMed] [Google Scholar]
- 5.Goldstein MJ, Mitchell EP. Carcinoembryonic antigen in the staging and follow-up of patients with colorectal cancer. Cancer Invest. 2005;23:338–351. doi: 10.1081/CNV-58878. [DOI] [PubMed] [Google Scholar]
- 6.Stiksma J, Grootendorst DC, van der Linden PWG. CA 19-9 as a marker in addition to CEA to monitor colorectal cancer. Clin. Colorectal. Cancer. 2014;13:239–244. doi: 10.1016/j.clcc.2014.09.004. [DOI] [PubMed] [Google Scholar]
- 7.Yang X-Q, et al. Preoperative serum carbohydrate antigen 125 level is an independent negative prognostic marker for overall survival in colorectal cancer. Med. Oncol. 2011;28:789–795. doi: 10.1007/s12032-010-9518-z. [DOI] [PubMed] [Google Scholar]
- 8.Ren F, et al. Clinicopathological features and prognosis of AFP-producing colorectal cancer: A single-center analysis of 20 cases. Cancer Manag. Res. 2019;11:4557–4567. doi: 10.2147/CMAR.S196919. [DOI] [PMC free article] [PubMed] [Google Scholar]
- 9.Webb A, et al. The prognostic value of CEA, beta HCG, AFP, CA125, CA19-9 and C-erb B-2, beta HCG immunohistochemistry in advanced colorectal cancer. Ann. Oncol. Off. J. Eur. Soc. Med. Oncol. 1995;6:581–587. doi: 10.1093/oxfordjournals.annonc.a059248. [DOI] [PubMed] [Google Scholar]
- 10.Li C, et al. Trajectories of perioperative serum tumor markers and colorectal cancer outcomes: A retrospective multicenter longitudinal cohort study. EBioMedicine. 2021;74:103706. doi: 10.1016/j.ebiom.2021.103706. [DOI] [PMC free article] [PubMed] [Google Scholar]
- 11.Dolscheid-Pommerich RC, et al. Clinical performance of CEA, CA19-9, CA15-3, CA125 and AFP in gastrointestinal Cancer using LOCI™-based assays. Anticancer Res. 2017;37:353–359. doi: 10.21873/anticanres.11329. [DOI] [PubMed] [Google Scholar]
- 12.Becerra AZ, et al. Evaluating the prognostic role of elevated preoperative carcinoembryonic antigen levels in colon cancer patients: Results from the national cancer database. Ann. Surg. Oncol. 2016;23:1554–1561. doi: 10.1245/s10434-015-5014-1. [DOI] [PubMed] [Google Scholar]
- 13.Beom SH, et al. Clinical significance of preoperative serum carcinoembryonic antigen within the normal range in colorectal cancer patients undergoing curative resection. Ann. Surg. Oncol. 2020;27:2774–2783. doi: 10.1245/s10434-020-08256-5. [DOI] [PubMed] [Google Scholar]
- 14.Huh JW, Kim CH, Lim SW, Kim HR, Kim YJ. Factors predicting long-term survival in colorectal cancer patients with a normal preoperative serum level of carcinoembryonic antigen. J. Cancer Res. Clin. Oncol. 2013;139:1449–1455. doi: 10.1007/s00432-013-1459-4. [DOI] [PubMed] [Google Scholar]
- 15.Kim NH, et al. Serum CEA and CA 19–9 levels are associated with the presence and severity of colorectal neoplasia. Yonsei Med. J. 2017;58:918–924. doi: 10.3349/ymj.2017.58.5.918. [DOI] [PMC free article] [PubMed] [Google Scholar]
- 16.Sun W, et al. AFP (alpha fetoprotein): Who are you in gastrology? Cancer Lett. 2015;357:43–46. doi: 10.1016/j.canlet.2014.11.018. [DOI] [PubMed] [Google Scholar]
- 17.Charkhchi P, et al. CA125 and ovarian cancer: A comprehensive review. Cancers. 2020 doi: 10.3390/cancers12123730. [DOI] [PMC free article] [PubMed] [Google Scholar]
- 18.Gao Y, et al. Evaluation of serum CEA, CA19-9, CA72-4, CA125 and ferritin as diagnostic markers and factors of clinical parameters for colorectal cancer. Sci. Rep. 2018;8:2732. doi: 10.1038/s41598-018-21048-y. [DOI] [PMC free article] [PubMed] [Google Scholar]
- 19.Shin JK, et al. High preoperative serum CA 19-9 levels can predict poor oncologic outcomes in colorectal cancer patients on propensity score analysis. Ann. Surg. Treatment Res. 2019;96:107–115. doi: 10.4174/astr.2019.96.3.107. [DOI] [PMC free article] [PubMed] [Google Scholar]
- 20.Lin P-C, et al. Carbohydrate antigen 19-9 is a valuable prognostic factor in colorectal cancer patients with normal levels of carcinoembryonic antigen and may help predict lung metastasis. Int. J. Colorectal Dis. 2012;27:1333–1338. doi: 10.1007/s00384-012-1447-1. [DOI] [PubMed] [Google Scholar]
- 21.Feng F, et al. Prognostic values of normal preoperative serum cancer markers for gastric cancer. Oncotarget. 2016;7:58459–58469. doi: 10.18632/oncotarget.11248. [DOI] [PMC free article] [PubMed] [Google Scholar]
- 22.You W, et al. Clinical significances of positive postoperative serum CEA and post-preoperative CEA increment in stage II and III colorectal cancer: A multicenter retrospective study. Front. Oncol. 2020;10:671. doi: 10.3389/fonc.2020.00671. [DOI] [PMC free article] [PubMed] [Google Scholar]
- 23.Konishi T, et al. Association of preoperative and postoperative serum carcinoembryonic antigen and colon cancer outcome. JAMA oncol. 2018;4:309–315. doi: 10.1001/jamaoncol.2017.4420. [DOI] [PMC free article] [PubMed] [Google Scholar]
- 24.Jiao Z, et al. Clinical associations of preoperative and postoperative serum CEA and lung cancer outcome. Front. Mol. Biosci. 2021;8:686313. doi: 10.3389/fmolb.2021.686313. [DOI] [PMC free article] [PubMed] [Google Scholar]
- 25.Yang Z, et al. Development and validation of a prognostic nomogram for colorectal cancer patients with synchronous peritoneal metastasis. Front. Oncol. 2021;11:615321. doi: 10.3389/fonc.2021.615321. [DOI] [PMC free article] [PubMed] [Google Scholar]
- 26.Kawai K, et al. Nomograms for predicting the prognosis of stage IV colorectal cancer after curative resection: A multicenter retrospective study. Eur. J. Surg. Oncol. 2015;41:457–465. doi: 10.1016/j.ejso.2015.01.026. [DOI] [PubMed] [Google Scholar]
- 27.Cheng X, et al. Nomogram predicting the survival of young-onset patients with colorectal cancer liver metastases. Diagnostics (Basel) 2022 doi: 10.3390/diagnostics12061395. [DOI] [PMC free article] [PubMed] [Google Scholar]
- 28.Knijn N, Mogk SC, Teerenstra S, Simmer F, Nagtegaal ID. Perineural invasion is a strong prognostic factor in colorectal cancer: A systematic review. Am. J. Surg. Pathol. 2016;40:103–112. doi: 10.1097/PAS.0000000000000518. [DOI] [PubMed] [Google Scholar]
- 29.Al-Sukhni E, et al. Lymphovascular and perineural invasion are associated with poor prognostic features and outcomes in colorectal cancer: A retrospective cohort study. Int. J. Surg. 2017;37:42–49. doi: 10.1016/j.ijsu.2016.08.528. [DOI] [PubMed] [Google Scholar]
- 30.Gupta R, Sinha S, Paul RN. The impact of microsatellite stability status in colorectal cancer. Curr. Probl. Cancer. 2018;42:548–559. doi: 10.1016/j.currproblcancer.2018.06.010. [DOI] [PubMed] [Google Scholar]
- 31.Luo Q, et al. KRAS and PIK3CA bi-mutations predict a poor prognosis in colorectal cancer patients: A single-site report. Transl. Oncol. 2020;13:100874. doi: 10.1016/j.tranon.2020.100874. [DOI] [PMC free article] [PubMed] [Google Scholar]
Associated Data
This section collects any data citations, data availability statements, or supplementary materials included in this article.
Data Availability Statement
All data described in the manuscript will be freely available to any researcher wishing to use them for non-commercial purposes, without breaching participant confidentiality, and the data can be obtained by contacting the correspondence author.


