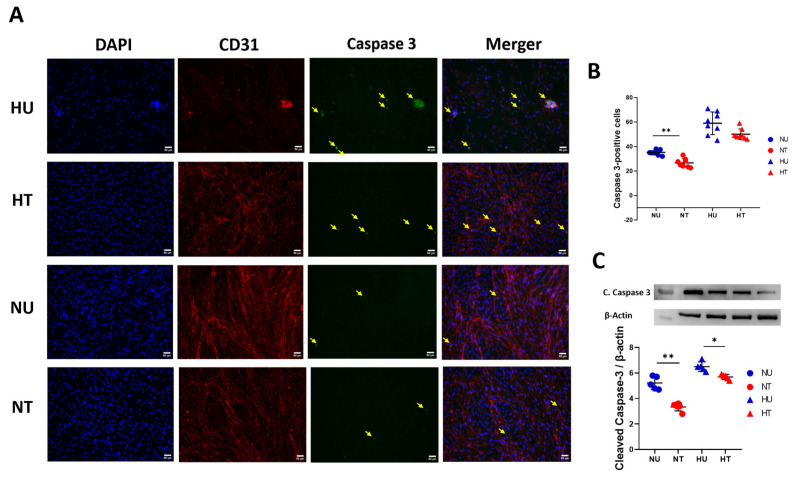
Figure 5.
Treatment effect of LA in reducing PBECs death under oxygen deprivation and raised glucose concentration. (A) Representative fluorescent microscopic images: Hoechst/PI staining; DAPI (blue), PI (red), and merger. More intense cleaved caspase-3 signals were counted for quantification (pointed yellow arrows) in all four groups of cells. (B) Graphic display of quantification data of PI-positive cells in all four groups. Lactate dehydrogenase calorimetric assay quantification, where LA reduced relative absorbance (%) in LA-treated cell medium compared to untreated hyperglycemic and normoglycemic mediums. Statistical significance was assessed by ordinary one-way ANOVA and Tukey’s multiple comparisons test (B,C). Values are given as means ± SD; * p < 0.05; ** p < 0.01.

