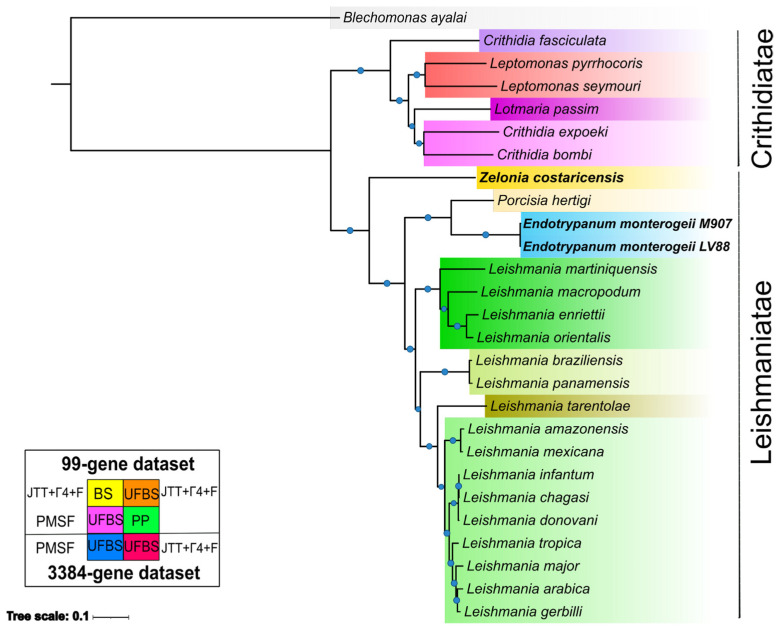
Figure 4.
Maximum likelihood (ML) phylogenomic tree based on a concatenated dataset of 3384 single-copy genes. The tree was reconstructed using 27 species, and 5 different models using ML and 1 model using BI were tested. All analyses recovered the same topological structure. UFBS, BS, and PP values higher than 95%, 75%, and 1 are shown as light blue circles. The horizontal bar depicts 0.01 substitutions per site.

