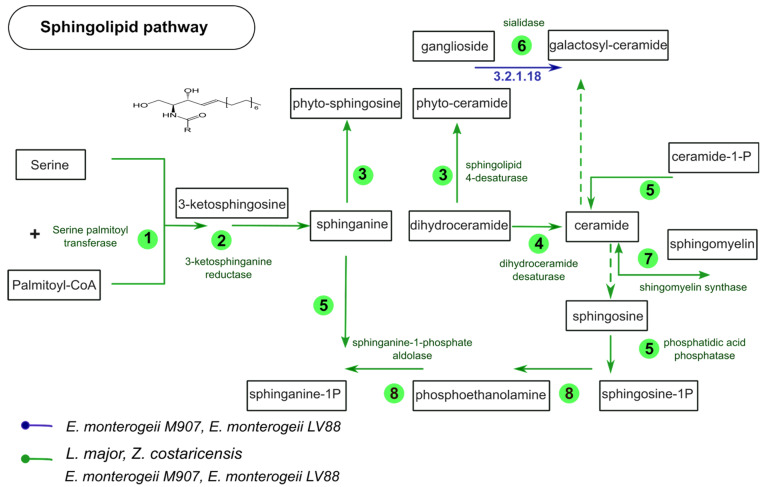
Figure 6.
Schematic representation of sphingolipid metabolism comparing four Leishmaniinae parasites. The numbers in green circles represent the number of predicted enzymes that are present in each pathway and in the four lineages. The blue arrow shows the sialidase enzyme present only in Endotrypanum monterogeii strains but absent in Leishmania (Leishmania) major.

