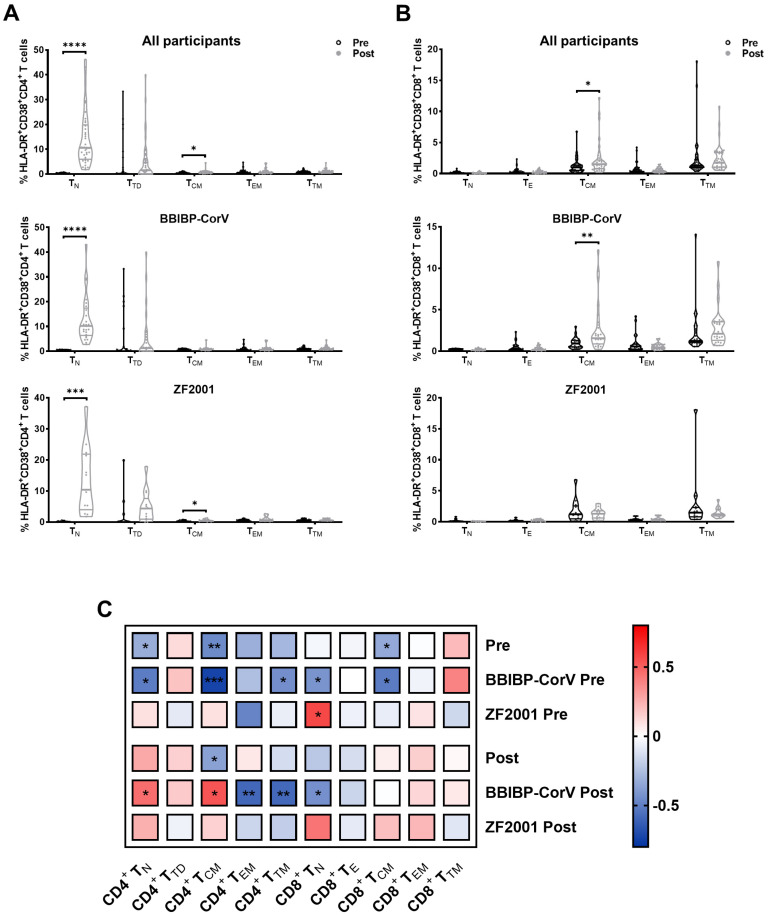
Figure 5.
Dynamics of T-cell subset activation and its association with T-cell recovery during breakthrough infection. (Comparisons of the activation for each CD4+ T-cell subset (A) and CD8+ T-cell subset (B) are shown during breakthrough infection. Correlation between current CD4 counts and levels of T-cell subset activation in all participants, BBIBP-CorV homologous booster group, and ZF2001 heterologous booster group are calculated (C) before and after breakthrough infection, respectively. Data were analyzed using Mann–Whitney U test. * p < 0.05, ** p < 0.005, *** p < 0.001, **** p < 0.0001.

