

Keywords: China, clinical features, costs, epidemiology, methylprednisolone sodium succinate, methylprednisolone, retrospective study, traumatic spinal cord injury, treatment
Abstract
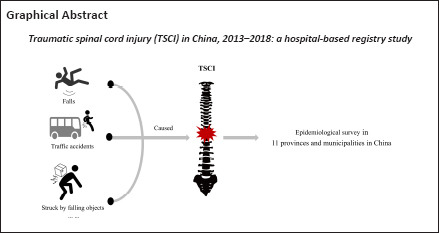
Traumatic spinal cord injury is potentially catastrophic and can lead to permanent disability or even death. China has the largest population of patients with traumatic spinal cord injury. Previous studies of traumatic spinal cord injury in China have mostly been regional in scope; national-level studies have been rare. To the best of our knowledge, no national-level study of treatment status and economic burden has been performed. This retrospective study aimed to examine the epidemiological and clinical features, treatment status, and economic burden of traumatic spinal cord injury in China at the national level. We included 13,465 traumatic spinal cord injury patients who were injured between January 2013 and December 2018 and treated in 30 hospitals in 11 provinces/municipalities representing all geographical divisions of China. Patient epidemiological and clinical features, treatment status, and total and daily costs were recorded. Trends in the percentage of traumatic spinal cord injuries among all hospitalized patients and among patients hospitalized in the orthopedic department and cost of care were assessed by annual percentage change using the Joinpoint Regression Program. The percentage of traumatic spinal cord injuries among all hospitalized patients and among patients hospitalized in the orthopedic department did not significantly change overall (annual percentage change, –0.5% and 2.1%, respectively). A total of 10,053 (74.7%) patients underwent surgery. Only 2.8% of patients who underwent surgery did so within 24 hours of injury. A total of 2005 (14.9%) patients were treated with high-dose (≥ 500 mg) methylprednisolone sodium succinate/methylprednisolone (MPSS/MP); 615 (4.6%) received it within 8 hours. The total cost for acute traumatic spinal cord injury decreased over the study period (–4.7%), while daily cost did not significantly change (1.0% increase). Our findings indicate that public health initiatives should aim at improving hospitals’ ability to complete early surgery within 24 hours, which is associated with improved sensorimotor recovery, increasing the awareness rate of clinical guidelines related to high-dose MPSS/MP to reduce the use of the treatment with insufficient evidence.
Introduction
Traumatic spinal cord injury (TSCI) can lead to permanent disability or even death (Jain et al., 2015; National Spinal Cord Injury Statistical Center, 2016; Li and Jia, 2023). Treatment includes surgery, glucocorticoids, or other nonsurgical treatments which are followed by a period of rehabilitation (Hansebout, 2022). These treatments cause a heavy financial burden to patients and their families, with direct costs in the United States ranging from 1.1 to 4.7 million United Stated dollars (USD) per patient over a lifetime (National Spinal Cord Injury Statistical Center, 2016). Over the past three decades, understanding of the global burden of TSCI has increased thanks to epidemiological studies such as the Global Burden of Disease (GBD) Study (GBD 2016 Traumatic Brain Injury and Spinal Cord Injury Collaborators, 2019), which concluded that the number of people with TSCI around the world will increase in the future (The Institute for Health Metrics and Evaluation, 2022). However, the study did note some limitations with the accuracy of its data in some regions and did not collect injury severity data, which limited its estimates of disease burden (Badhiwala et al., 2019). The authors recommended further research in developing countries and collection of more comprehensive TSCI data (Badhiwala et al., 2019).
As one of the most populous countries in the world, China is an important developing nation that can significantly influence the global rate of TSCI (The Institute for Health Metrics and Evaluation, 2022). Furthermore, the current data available from China is largely regional in nature and has significant methodological limitations (Yuan et al., 2018). National epidemiological and clinical studies have been rare. Although Hao et al. (2021) reported epidemiological characteristics of TSCI in China, their study did not examine treatment status or economic burden. This study aimed to identify modern epidemiological and clinical features of TSCI in China, particularly treatment status and economic burden.
Methods
The study was conducted in accordance with the principles of the Declaration of Helsinki and was approved by the Medical Research Ethics Committee of Tianjin Medical University General Hospital (approval No. IRB2021-WZ-189) and the other participating centers. Data were collected from January to June 2019. The requirement for informed consent was waived because of the retrospective nature of the study. Reporting is in accordance with the STrengthening the Reporting of OBservational studies in Epidemiology (STROBE) statement (von Elm et al., 2007).
Study population
The Chinese multicenter TSCI registry project (CMTSCIRP, ChiCTR1800019691) is a nationally representative, hospital-based retrospective study that registered individuals over 15 years of age who sustained a TSCI between January 2013 and December 2018 and were cared for in a large general hospital or orthopedic specialty center. The sites included 30 hospitals from seven geographical regions (central China, northern China, eastern China, southern China, northwest China, southwest China, and northeast China) and four municipalities (Beijing, Shanghai, Tianjin, and Chongqing). The complete list of hospitals is shown in Additional Table 1. For each region or municipality, we selected between two and four hospitals that were either large general hospitals or orthopedic specialty centers (Figure 1). Patients who died at the injury site or in the emergency department or who sustained a non-traumatic spinal cord injury (e.g., tumor or degenerative compression) were excluded.
Additional Table 1.
List of 30 hospitals included in this study
| Number | Name of hospitals | Province/municipality |
|---|---|---|
| 1 | TianjinMedical UniversityGeneral Hospital | Tianjin city |
| 2 | TianjinUnion Medical Center | Tianjin city |
| 3 | TianjinHospital | Tianjin city |
| 4 | Beijing Xuanwu Hospital | Beijing city |
| 5 | Beijing LuheHospital | Beijing city |
| 6 | The Third Hospital of Hebei Medical University | Hebei province |
| 7 | Hospital of JingxingCounty | Hebei province |
| 8 | Henan ProvincialPeople’s Hospital | Henanprovince |
| 9 | The First Affiliated Hospital of Zhengzhou University | Henanprovince |
| 10 | Zhengzhou Orthopaedics Hospital | Henanprovince |
| 11 | People’s Hospital of Wuzhi County | Henanprovince |
| 12 | The First Affiliated Hospital of China Medical University | Liaoningprovince |
| 13 | The Eighth People’s Hospital of Shenyang | Liaoningprovince |
| 14 | Shanghai NinthPeople’s Hospital | Shanghaicity |
| 15 | Shanghai Jiao TongUniversityAffiliated Sixth People’s Hospital | Shanghaicity |
| 16 | EastHospital Affiliated to Tongji University School of Medicine | Shanghaicity |
| 17 | Shanghai General Hospital, Shanghai Jiao Tong University School of Medicine | Shanghaicity |
| 18 | The First Affiliated Hospital of NanjingMedical University | Jiangsuprovince |
| 19 | The First Affiliated Hospital of Soochow University | Jiangsuprovince |
| 20 | JinhuCounty People’s Hospital | Jiangsuprovince |
| 21 | The Third Affiliated Hospital of Southern Medical University | Guangzhouprovince |
| 22 | SunYat-Sen Memorial Hospital | Guangzhouprovince |
| 23 | Shenzhen Second People’s Hospital | Guangzhouprovince |
| 24 | West ChinaHospital of Sichuan Universityy | Sichuanprovince |
| 25 | Affiliated Hospital of ChengduUniversity | Sichuanprovince |
| 26 | XinqiaoHospital of Army Medical University | Chongqing city |
| 27 | Xiushan People’s Hospital | Chongqing city |
| 28 | The First Affiliated Hospital of Xi’anJiaotong University | Shaanxi province |
| 29 | Honghui Hospital, Xi’an JiaotongUniversity | Shaanxi province |
| 30 | Yanliang141 Hospital | Shaanxi province |
Figure 1.

Study flow chart.
EXCL: Excluded; MP: methylprednisolone; MPSS: methylprednisolone sodium succinate; TSCI: traumatic spinal cord injury.
Justification of sample size
Our study only described status and did not perform any statistical inferences. Thus, no formal sample size calculation was needed. It also fits with a recently published guideline regarding the framework for descriptive epidemiology (Lesko et al., 2022).
Identification of TSCI
SCI is defined as damage to the spinal cord that temporarily or permanently causes functional change. TSCI occurs when the damage is caused by acute external physical impact (Ahuja et al., 2017). TSCI cases were identified mainly using medical terms in Chinese (“spinal fractures”, “cervical fractures”, “thoracic fractures”, “lumbar fractures”, “sacral fractures”, “spinal cord injury”, “cervical spine fracture with spinal cord injury”, “thoracic spine fracture with spinal cord injury”, “lumbar spine fracture with spinal cord injury”, “cervical spinal cord injury”, “thoracic spinal cord injury”, “lumbar spinal cord injury”, “cauda equina injury”, “nerve injury”, “quadriplegia”, “paraplegia”, “incomplete quadriplegia”, and “incomplete paraplegia”), as it was difficult to unify case codes because of diversities in codes used by different hospitals. The Tenth Revision of the International Classification of Diseases codes (Clark and Marshall, 2022) involving TSCI from the International Spinal Cord Injury Community Survey Group was also used to complement and refine the medical terms [S12 (fracture of the neck), S12.0 (fracture of first cervical vertebra), S12.2 (fracture of other specified cervical vertebra), S13.0 (traumatic rupture of cervical intervertebral disk), S13.2 (dislocation of other and unspecified parts of neck), S13.4 (sprain and strain of cervical spine), S14 (injury of nerves and spinal cord at neck level), S14.0 (concussion and edema of cervical spinal cord), S14.1 (other and unspecified injuries of cervical spinal cord), S17 (crushing injury of neck), S19 (other and unspecified injuries of neck), S22 (fracture of ribs, sternum and thoracic spine), S22.0 (fracture of thoracic vertebra), S23.1 (dislocation of thoracic vertebra), S24 (injury of nerves and spinal cord at thorax level), S24.0 (concussion and edema of thoracic spinal cord), S24.1 (other and unspecified injuries of thoracic spinal cord), S28 (crushing injury of thorax and traumatic amputation of part of thorax), S29 (other and unspecified injuries of thorax), S32 (fracture of lumbar spine and pelvis), S32.0 (fracture of lumbar vertebra), S33.1 (dislocation of lumbar vertebra), S34.0 (concussion and edema of lumbar spinal cord), S34.1 (other injury of lumbar spinal cord), S34.3 (injury of cauda equina), S38 (crushing injury and traumatic amputation of part of abdomen, lower back and pelvis), S39 (other and unspecified injuries of abdomen, lower back and pelvis), T02.0 (fractures involving head with neck), T02.1 (fractures involving thorax with lower back and pelvis), T04.1 (crushing injuries involving thorax with abdomen, lower back and pelvis), T04.2 (crushing injuries involving multiple regions of upper limbs), T06.0 (injuries of brain and cranial nerves with injuries of nerves and spinal cord at neck level), T06.1 (injuries of nerves and spinal cord involving other multiple body regions), T09.3 (injury of spinal cord, level unspecified), T09.4 (injury of unspecified nerve, spinal nerve root and plexus of trunk), T91.1 (sequelae of fracture of spine), T91.3 (sequelae of injury of spinal cord), G82 (paraplegia and tetraplegia), G82.0 (flaccid paraplegia), G82.1 (spastic paraplegia), G82.2 (paraplegia, unspecified), G82.3 (flaccid tetraplegia), G82.4 (spastic tetraplegia), G82.5 (tetraplegia, unspecified), G83.4 (cauda equina syndrome)] (Gross-Hemmi et al., 2017). All cases were checked by trained investigators.
Covariates
Age groups included 15–24, 25–34, 35–44, 45–54, 55–64, and ≥ 65 years. Occupations included farmer, worker, retired, office clerk, student, self-employed, civil servant, driver, and other (e.g., teacher, unemployed, or freelancer) based on the medical records. Injury cause was grouped as low fall (< 1 m), high fall (≥ 1 m), traffic accident, struck by falling object, sport-related, and other (e.g., work-related injury, sharp injury, massage-related injury, electric shock injury, gunshot, crush injury, or iatrogenic injury). Level of injury comprised cervical, thoracic, lumbosacral, multi-site, and cauda equina. Multi-site referred to at least two different segments of injury (Selvarajah et al., 2014). Injury severity was classified as complete quadriplegia, complete paraplegia, incomplete quadriplegia, and incomplete paraplegia based on the degree and extent of neurological damage (Rodakowski et al., 2014). The American Spinal Injury Association Impairment Scale (AIS) (Wecht et al., 2021), which is based on motor and sensory function and divided into grades A, B, C, D, and E, was used to evaluate neurological function (Additional file 1 (79.7KB, pdf) and Additional Table 2; Roberts et al., 2017). Groups with less than 1% of the total number of patients were categorized as “other” to increase the reproducibility of the results (Harrell Jr, 2015). Timing of surgery was classified as < 24 hours, < 4.0 days, 4.0–11.9 days, and > 11.9 days based on a previous study (Badhiwala et al., 2021) and the interquartile distribution of the data in this study. Off-label use of methylprednisolone sodium succinate (MPSS)/methylprednisolone (MP) for TSCI remains contentious (Hansebout, 2022); therefore, we defined 500 mg of MPSS/MP as a threshold, based on the user guide (DXY Drugs Information, 2022). The starting time of MPSS/MP administration was classified as ≤ 1.6 days, 1.7–9.0 days, and > 9.0 days. The length of accumulated use time was classified as ≤ 2 days, 3–5 days, and ≥ 6 days (details are shown in Additional file 2 (108.2KB, pdf) ).
Additional Table 2.
American Spinal Injury Association Impairment 1 Scale (AIS) grade
| AIS grade | Category | Description |
|---|---|---|
| A | Complete | No motor or sensory function is preserved in thesacral segments S4–S5. |
| B | Incomplete | Sensory function rather than motor function is preserved below the neurological level at which the sacral segments S4–S5 are included. |
| C | Incomplete | Motor function is preserved below the neurological level, and more than half of key muscles below theneurological level have a muscle grade less than3. |
| D | Incomplete | Motor function is preserved below the neurological level, and at least half of key muscles below the neurological level have a muscle gradeof 3 or more. |
| E | Normal | Motor and sensory function are normal, but still may have abnormal reflexes or other neurologic phenomena a. |
aAIS grade E refers to the international standards and classifications (Kirshblum et al., 2011; Roberts et al., 2017).
References
Kirshblum SC, Burns SP, Biering-Sorensen F, Donovan W, Graves DE, Jha A, Johansen M, Jones L, Krassioukov
A, Mulcahey MJ, Schmidt-Read M, Waring W (2011) International standards for neurological classification of spinal cord injury (revised 2011). J Spinal Cord Med 34:535-546.
Roberts TT, Leonard GR, Cepela DJ (2017) Classifications in brief: American Spinal Injury Association (ASIA)
Impairment Scale. Clin Orthop Relat Res 475:1499-1504.
Study data
The primary data recorded included percentage of TSCIs among all hospitalized patients and among hospitalized patients in the orthopedic department, rate of surgery, timing of surgery, rate of MPSS/MP use, timing of MPSS/MP use, and total and daily costs. Secondary data included measurements of the above in individual hospitals and different subgroups, length of MPSS/MP use, and length of hospital stay. Percentage of TSCIs among all hospitalized patients was calculated as the number of TSCI patients/the number of total hospital admissions. Percentage of TSCIs among hospitalized patients in the orthopedic department was calculated as the number of TSCI patients/the number of total orthopedic department admissions. Trends in data over time were examined. As exploratory analyses, we calculated data trends for each participating hospital and performed subgroup analyses based on hospital type (general hospital vs. orthopedic hospital) and economic level (Additional file 3 (99.2KB, pdf) ). Because the number of annual TSCI admissions varied considerably between hospitals, we explored the relationship between number of annual TSCI admissions and trends in percentages (Additional file 4 (78.7KB, pdf) ). MPSS/MP use was classified as continuous or intermittent. Intermittent use was defined as two or more dose administrations during hospitalization, with at least 1 day between. The length of MPSS/MP use was defined as the total number of days that MPSS/MP was used. Details for time-point cut-offs of MPSS/MP are shown in Additional file 2 (108.2KB, pdf) . The total and daily costs were the costs incurred during hospitalization for acute TSCI and were identified from the medical record. Acute TSCI was defined as hospital admission within 14 days of the injury. The total and daily costs were converted to 2013 Chinese Yuan (CNY), discounted at an annual rate of 5%, as recommended by the 202 Chinese Guidelines for Pharmacoeconomic Evaluations (Liu, 2020). The exchange rate used to convert 2013 CNY to USD was 619.32 to 100. Costs are presented in both CNY and USD (National Bureau of Statistics, 2022). Non-acute TSCI patients were not included in the economic analysis because they are treated differently than acute TSCI patients and their inclusion would have introduced bias (Hansebout, 2022).
Statistical analysis
Continuous variables are presented as means with standard deviation. Categorical variables are presented as numbers with percentage. Trends in percentages and costs were assessed by annual percentage change (APC) (Additional file 5 (75.9KB, pdf) ; Zhao et al., 2008) using the regression model log (rt) = a + bt, where log denotes the natural logarithm and t represents the calendar year (Salomaa et al., 1992); trend (b) was estimated using ordinary regression and 100 × b represents the estimated APC (Salomaa et al., 1992). The Joinpoint Regression Program version 4.8.0.1 (Statistical Methodology and Applications Branch, Surveillance Research Program, National Cancer Institute, Bethesda, MD, USA) was used to calculate APC (National Cancer Institute, 2022). Analysis of demographic and clinical features, treatment status, and economic burden was performed using SPSS Statistics Grad Pack 27.0 (IBM Corp., Armonk, NY, USA). Simple linear regression and figure drawing were performed using Prism version 9.0.2 (GraphPad Software, San Diego, CA, USA). Statistical significance was defined as two-tailed P < 0.05.
Results
Epidemiological and clinical features
A total of 13,465 TSCI patients were included and 10,196 were men (75.7%). Mean age overall was 50.0 years. Patient demographic and clinical features are shown in Table 1. Among the six age groups, the proportion of patients in the 45–54 years group was highest (27.7%). Most patients were farmers (38.8%). The top three causes of TSCI were: low falls (30.1%), high falls (29.4%), and traffic accidents (24.1%). Most injuries were in the cervical spine (61.3%) and most presented as incomplete quadriplegia (44.2%). Almost half (48.0%) were classified as AIS grade D on admission, followed by grade A (25.5%).
Table 1.
The demographic and clinical features among TSCI patients from 2013 to 2018
| Categories | Men | Women | Total |
|---|---|---|---|
| N | 10196 (75.7) | 3269 (24.3) | 13465 (100.0) |
| Age (yr) | 49.3±14.4 | 52.2±15.2 | 50.0±14.6 |
| Age groups | |||
| 15–24 yr | 549 (5.4) | 156 (4.8) | 705 (5.2) |
| 25–34 yr | 1169 (11.5) | 289 (8.8) | 1458 (10.8) |
| 35–44 yr | 1848 (18.1) | 494 (15.1) | 2342 (17.4) |
| 45–54 yr | 2872 (28.2) | 861 (26.3) | 3733 (27.7) |
| 55–64 yr | 2301 (22.6) | 739 (22.6) | 3040 (22.6) |
| ≥ 65 yr | 1457 (14.3) | 730 (22.3) | 2187 (16.2) |
| Occupations | |||
| Farmers | 3973 (39.0) | 1245 (38.1) | 5218 (38.8) |
| Workers | 1291 (12.7) | 223 (6.8) | 1514 (11.2) |
| Retired | 562 (5.5) | 339 (10.4) | 901 (6.7) |
| Office clerks | 451 (4.4) | 162 (5.0) | 613 (4.6) |
| Students | 204 (2.0) | 104 (3.2) | 308 (2.3) |
| Self-employed | 197 (1.9) | 65 (2.0) | 262 (1.9) |
| Civil servants | 131 (1.3) | 64 (2.0) | 195 (1.4) |
| Drivers | 118 (1.2) | 28 (0.9) | 146 (1.1) |
| Others† | 2653 (26.0) | 845 (25.8) | 3498 (26.0) |
| Missing|| | 616 (6.0) | 194 (5.9) | 810 (6.0) |
| Etiological groups | |||
| Low falls | 2853 (28.0) | 1196 (36.6) | 4049 (30.1) |
| High falls | 3141 (30.8) | 812 (24.8) | 3953 (29.4) |
| Traffic accidents | 2459 (24.1) | 783 (24.0) | 3242 (24.1) |
| Struck by falling objects | 697 (6.8) | 103 (3.2) | 800 (5.9) |
| Sport related injuries | 93 (0.9) | 55 (1.7) | 148 (1.1) |
| Others‡ | 610 (6.0) | 222 (6.8) | 832 (6.2) |
| Missing|| | 343 (3.4) | 98 (3.0) | 441 (3.3) |
| Level of injury | |||
| Cervical | 6580 (64.5) | 1674 (51.2) | 8254 (61.3) |
| Thoracic | 1554 (15.2) | 606 (18.5) | 2160 (16.0) |
| Lumbosacral | 1751 (17.2) | 850 (26.0) | 2601 (19.3) |
| Multi-site | 119 (1.2) | 56 (1.7) | 175 (1.3) |
| Cauda equina | 21 (0.2) | 8 (0.2) | 29 (0.2) |
| Missing|| | 171 (1.7) | 75 (2.3) | 246 (1.8) |
| Severity | |||
| Complete quadriplegia | 1412 (13.8) | 277 (8.5) | 1689 (12.5) |
| Complete paraplegia | 2061 (20.2) | 609 (18.6) | 2670 (19.8) |
| Incomplete quadriplegia | 4653 (45.6) | 1303 (39.9) | 5956 (44.2) |
| Incomplete paraplegia | 1905 (18.7) | 1027 (31.4) | 2932 (21.8) |
| Missing|| | 165 (1.6) | 53 (1.6) | 218 (1.6) |
| AIS grade§ | |||
| A | 2 744 (26.9) | 684 (20.9) | 3428 (25.5) |
| B | 758 (7.4) | 196 (6.0) | 954 (7.1) |
| C | 1819 (17.8) | 473 (14.5) | 2292 (17.0) |
| D | 4637 (45.5) | 1820 (55.7) | 6457 (48.0) |
| E | 134 (1.3) | 63 (1.9) | 197 (1.5) |
| Missing|| | 104 (1.0) | 33 (1.0) | 137 (1.0) |
† “Others” included “Teachers”, “Unemployed” and “Freelances”. ‡ “Others” included “Injuries caused by others”, “Work related injuries”, “Sharp injuries”, “Massage related injuries”, “Electric shock injuries”, “Gunshot wounds”, “Crush injuries”, and “Iatrogenic injuries”. § AIS grade A represents complete impairment with no motor or sensory function below the level of injury; grades B–D represent progressively less severe impairment; AIS grade E represents normal motor and sensory examinations, but still may have abnormal reflexes or other neurologic phenomena. || “Missing” represented those patients for whom the exact classification of the subgroup could not be confirmed. Data are expressed as number (percentage) with the exception of age (mean ± SD). AIS: American Spinal Injury Association (ASIA) Impairment Scale; SD: standard deviation; TSCI: traumatic spinal cord injury.
From 2013 to 2018, the percentage of TSCIs among all hospitalized patients (APC, −0.5%; 95% confidence interval [CI], −3.8−2.9%) and among patients hospitalized in the orthopedic department (APC, 2.1%; 95% CI, −4.1−8.6%) did not significantly change overall; however, APCs varied among the individual hospitals (Figure 2 and Additional Figure 1 (392.5KB, tif) ). The percentage of TSCIs among all hospitalized patients and among patients hospitalized in the orthopedic department did not significantly change in the different subgroups (Additional Table 3). However, the percentage of TSCIs among all hospitalized patients (APC, 8.4%; 95% CI, 3.4–13.7%, P = 0.009) and among patients hospitalized in the orthopedic department (APC, 7.5%; 95% CI, 2.4–12.9%; P = 0.015) increased when the number of annual TSCI admissions was greater than 140 (Additional Figure 2 (314.3KB, tif) ).
Figure 2.
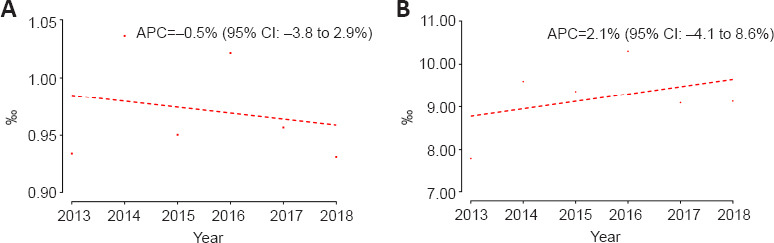
Trends in the percentage of traumatic spinal cord injuries among all hospitalized patients (A) and among patients hospitalized in the orthopedic department (B) in 20 hospitals from 2013 to 2018.
APC: Annual percentage change; CI: confidence interval.
Additional Table 3.
Trends in percentage of different subgroups among TSCI patients from 2013 to 2018
| Category | 2013 | 2014 | 2015 | 2016 | 2017 | 2018 | APC (95% CI) | P value fortrend |
|---|---|---|---|---|---|---|---|---|
| TSCI patients/hospitalized patients | ||||||||
| Hospital type | ||||||||
| General hospital | 0.000629630 | 0.000736889 | 0.000652126 | 0.000639075 | 0.000562163 | 0.000546370 | -4.3 (-9.2, 0.8) | 0.080 |
| Orthopedichospital | 0.003979312 | 0.004130452 | 0.003728387 | 0.004694836 | 0.004813272 | 0.004606018 | 4.1 (-1.1, 9.7) | 0.095 |
| Economic level | . | |||||||
| Above the PCDI | 0.000747094 | 0.000865911 | 0.000864381 | 0.000836637 | 0.000832369 | 0.000846180 | 1.4 (-2.2, 5.1) | 0.358 |
| Below the PCDI | 0.002225435 | 0.002288856 | 0.001643776 | 0.002612902 | 0.002083825 | 0.001704871 | -3.2 (-14.6, 9.6) | 0.505 |
| TSCI patients/Orthopedic patients | ||||||||
| Hospital type | ||||||||
| General hospital | 0.008506195 | 0.010947151 | 0.010741562 | 0.011469459 | 0.009495934 | 0.009673554 | 0.8 (-7.1, 9.4) | 0.798 |
| Orthopedichospital | 0.005818276 | 0.006048928 | 0.005816793 | 0.005816793 | 0.008052800 | 0.007792869 | 6.9 (-0.3, 14.6) | 0.057 |
| Economic level | ||||||||
| Above the PCDI | 0.007429018 | 0.009541510 | 0.009941288 | 0.010289077 | 0.009283629 | 0.009615729 | 3.6 (-3.4, 11.2) | 0.233 |
| Below the PCDI | 0.009432695 | 0.009862986 | 0.006477616 | 0.010366081 | 0.008070989 | 0.006527707 | -5.5 (-17.2,7.9) | 0.304 |
APC: Annual percentage change; CI: confidence interval; PCDI: per capita disposable income; TSCI: traumatic spinal cord injury.
Treatment status
Surgery
Surgery after TSCI was performed in 10,053 patients overall (74.7%). Table 2 shows the treatment methods and timing of surgery. The surgery rate was highest in patients aged 15–24 years (77.7%). Among the different etiological groups, the surgery rate was highest in the high falls group (81.3%). Patients with cauda equina had the highest surgery rate among the different levels of injury (93.1%). Patients with complete paraplegia (80.5%) and AIS grade B (82.0%) had the highest surgery rates among the different injury severities and AIS grades, respectively. Timing of surgery data was available in 10,020 patients; among these, 284 (2.8%) underwent surgery in less than 24 hours of injury and 2471 (24.7%) underwent surgery in less than 4.0 days. In the remaining patients, 5030 patients (50.2%) underwent surgery within 4.0 to 11.9 days and 2519 (25.1%) underwent surgery more than 11.9 days after injury.
Table 2.
The treatment methods and surgery timing among TSCI patients
| Categories | Treatment methods | Surgery timing * | ||||
|---|---|---|---|---|---|---|
|
|
|
|||||
| Surgery | Conservative therapies | Section 1 | Section 2 | |||
|
|
|
|||||
| < 24 h | < 4.0 d | 4.0–11.9 d | > 11.9 d | |||
| Gender | ||||||
| Men | 7662 (75.1) | 2534 (24.9) | 211 (2.8) | 1865 (24.4) | 3911 (51.2) | 1866 (24.4) |
| Women | 2391 (73.1) | 878 (26.9) | 73 (3.1) | 606 (25.5) | 1119 (47.1) | 653 (27.5) |
| Total | 10053 (74.7) | 3412 (25.3) | 284 (2.8) | 2471 (24.7) | 5030 (50.2) | 2519 (25.1) |
| Age groups | ||||||
| 15–24 yr | 548 (77.7) | 157 (22.3) | 23 (4.2) | 161 (29.4) | 277 (50.6) | 109 (19.9) |
| 25–34 yr | 1116 (76.5) | 342 (23.5) | 46 (4.1) | 333 (29.9) | 544 (48.9) | 237 (21.3) |
| 35–44 yr | 1801 (76.9) | 541 (23.1) | 44 (2.5) | 452 (25.2) | 908 (50.6) | 433 (24.1) |
| 45–54 yr | 2845(76.2) | 888 (23.8) | 87 (3.1) | 708 (25.0) | 1451 (51.2) | 677 (23.9) |
| 55–64 yr | 2279 (75.0) | 761 (25.0) | 61 (2.7) | 528 (23.3) | 1138 (50.1) | 604 (26.6) |
| ≥ 65 yr | 1464 (66.9) | 723 (33.1) | 23 (1.6) | 289 (19.8) | 712 (48.8) | 459 (31.4) |
| Occupations | ||||||
| Farmers | 3966 (76.0) | 1252 (24.0) | 126 (3.2) | 1069 (27.0) | 1981 (50.1) | 905 (22.9) |
| Workers | 1152 (76.1) | 362 (23.9) | 44 (3.8) | 331 (28.8) | 572 (49.7) | 248 (21.5) |
| Retired | 627 (69.6) | 274 (30.4) | 8 (1.3) | 120 (19.3) | 300 (48.2) | 203 (32.6) |
| Office clerks | 435 (71.0) | 178 (29.0) | 23 (5.3) | 133 (30.7) | 212 (49.0) | 88 (20.3) |
| Students | 236 (76.6) | 72 (23.4) | 13 (5.5) | 69 (29.2) | 114 (48.3) | 53 (22.5) |
| Self-employed | 190 (72.5) | 72 (27.5) | 8 (4.2) | 55 (28.9) | 96 (50.5) | 39 (20.5) |
| Civil servants | 129 (66.2) | 66 (33.8) | 1 (0.8) | 35 (27.3) | 62 (48.4) | 31 (24.2) |
| Drivers | 107 (73.3) | 39 (26.7) | 3 (2.8) | 32 (29.9) | 52 (48.6) | 23 (21.5) |
| Others† | 2568 (73.4) | 930 (26.6) | 48 (1.9) | 458 (17.9) | 1293 (50.6) | 806 (31.5) |
| Missing | 643 (79.4) | 167 (20.6) | 10 (1.6) | 169 (26.4) | 348 (54.4) | 123 (19.2) |
| Etiological groups | ||||||
| Low falls | 2965 (73.2) | 1084 (26.8) | 56 (1.9) | 587 (19.9) | 1541 (52.2) | 823 (27.9) |
| High falls | 3214 (81.3) | 739 (18.7) | 120 (3.7) | 973 (30.3) | 1595 (49.7) | 641 (20.0) |
| Traffic accidents | 2328 (71.8) | 914 (28.2) | 57 (2.5) | 532 (22.9) | 1158 (49.9) | 631 (27.2) |
| Struck by falling objects | 621 (77.6) | 179 (22.4) | 36 (5.8) | 178 (28.8) | 289 (46.7) | 152 (24.6) |
| Sport related injuries | 100 (67.6) | 48 (32.4) | 1 (1.0) | 20 (20.0) | 40 (40.0) | 40 (40.0) |
| Others‡ | 527 (63.3) | 305 (36.7) | 12 (2.3) | 89 (16.9) | 248 (47.1) | 189 (35.9) |
| Missing|| | 298 (67.6) | 143 (32.4) | 2 (0.7) | 92 (31.3) | 159 (54.1) | 43 (14.6) |
| Level of injury | ||||||
| Cervical | 5952 (72.1) | 2302 (27.9) | 118 (2.0) | 1145 (19.3) | 3163 (53.3) | 1628 (27.4) |
| Thoracic | 1732 (80.2) | 428 (19.8) | 65 (3.8) | 509 (29.5) | 764 (44.3) | 452 (26.2) |
| Lumbosacral | 2078 (79.9) | 523 (20.1) | 91 (4.4) | 745 (36.0) | 951 (45.9) | 376 (18.1) |
| Multi-site | 156 (89.1) | 19 (10.9) | 7 (4.5) | 47 (30.3) | 74 (47.7) | 34 (21.9) |
| Cauda equina | 27 (93.1) | 2 (6.9) | 0 (0.0) | 3 (11.1) | 18 (66.7) | 6 (22.2) |
| Missing|| | 108 (43.9) | 138 (56.1) | 3 (2.9) | 22 (21.0) | 60 (57.1) | 23 (21.9) |
| Severity | ||||||
| Complete quadriplegia | 1208 (71.5) | 481 (28.5) | 62 (5.1) | 378 (31.3) | 601 (49.8) | 227 (18.8) |
| Complete paraplegia | 2149 (80.5) | 521 (19.5) | 114 (5.3) | 757 (35.3) | 959 (44.8) | 426 (19.9) |
| Incomplete quadriplegia | 4309 (72.3) | 1647 (27.7) | 43 (1.0) | 641 (14.9) | 2334 (54.3) | 1323 (30.8) |
| Incomplete paraplegia | 2284 (77.9) | 648 (22.1) | 64 (2.8) | 678 (29.8) | 1086 (47.7) | 512 (22.5) |
| Missing|| | 103 (47.2) | 115 (52.8) | 1 (1.0) | 17 (17.3) | 50 (51.0) | 31 (31.6) |
| AIS grade§ | ||||||
| A | 2642 (77.1) | 786 (22.9) | 143 (5.4) | 956 (36.3) | 1173 (44.5) | 507 (19.2) |
| B | 782 (82.0) | 172 (18.0) | 41 (5.3) | 233 (29.9) | 401 (51.5) | 145 (18.6) |
| C | 1789 (78.1) | 503 (21.9) | 47 (2.6) | 364 (20.4) | 986 (55.3) | 432 (24.2) |
| D | 4672 (72.4) | 1785 (27.6) | 48 (1.0) | 889 (19.1) | 2378 (51.0) | 13963 (29.9) |
| E | 117 (59.4) | 80 (40.6) | 5 (4.3) | 21 (18.1) | 71 (61.2) | 24 (20.7) |
| Missing|| | 51 (37.2) | 86 (62.8) | 0 (0.0) | 8 (17.0) | 21 (44.7) | 18 (38.3) |
* “Surgery timing” represented the time from injury to surgery (h=hours, d=days). † “Others” included "Teachers”, “Unemployed” and “Freelances”. ‡ “Others” included “Injuries caused by others”, “Work related injuries”, “Sharp injuries”, “Massage related injuries”, “Electric shock injuries”, “Gunshot wounds”, “Crush injuries”, and “Iatrogenic injuries”. § AIS grade A represents complete impairment with no motor or sensory function below the level of injury; grades B–D represent progressively less severe impairment; AIS grade E represents normal motor and sensory examinations, but still may have abnormal reflexes or other neurologic phenomena. || “Missing” represented those patients for whom the exact classification of the subgroup could not be confirmed. Data are expressed as number (percentage). AIS: American Spinal Injury Association (ASIA) Impairment Scale; TSCI: traumatic spinal cord injury.
Glucocorticoids
High-dose MPSS/MP (≥ 500 mg) was administered in 2005 patients overall (14.9%); among these, 615 (30.7%) received it within 8 hours. Regular-dose MPSS/MP (< 500 mg) was administered in 4994 patients (37.1%); among these, 4665 (93.4%) received continuous dosing and 329 (6.6%) received intermittent dosing (Figure 3 and Additional Table 4).
Figure 3.
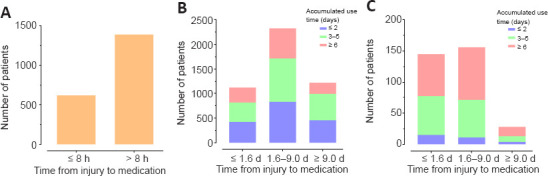
Use of methylprednisolone sodium succinate (MPSS)/methylprednisolone (MP) among traumatic spinal cord injury patients during hospitalization.
(A) High-dose MPSS/MP (≥ 500 mg). (B) Continuous normal-dose MPSS/MP (< 500 mg). (C) Intermittent normal-dose.
Additional Table 4.
The use of MPSS/MP among TSCI patients during hospitalization
| Category1 | Accumulated time ≤ 2 d | 3 d ≤ accumulated time ≤ 5 d | Accumulated time ≥ 6 d | No accumulated ti 2 | Total |
|---|---|---|---|---|---|
| Use of MPSS/MPat over-instruction dose (≥ 500 mg) | |||||
| ≤ 8 h | -- | -- | -- | 615 | 615 |
| > 8 h | -- | -- | -- | 1 390 | 1 390 |
| Total | -- | -- | -- | 2 005 | 2 005 |
| Use of MPSS/MPwithnormal instruction dose(< 500mg) | |||||
| Total | 4 994 | ||||
| Continuous use of MPSS/MPwithnormal instruction dose | |||||
| ≤ 1.6d | 421 | 393 | 302 | -- | 1 116 |
| 1.7-9.0 d | 827 | 889 | 607 | -- | 2 323 |
| ➢ 9.0 d | 454 | 533 | 239 | -- | 1 226 |
| Total | 1 702 | 1 815 | 1 148 | -- | 4 665 |
| Intermittentuse of MPSS/MPwith normal instruction dose | |||||
| ➢ 1.6d | 15 | 62 | 68 | -- | 145 |
| 1.7-9.0 d | 11 | 60 | 85 | -- | 156 |
| ¬ 9.0 d | 4 | 9 | 15 | -- | 28 |
| Total | 30 | 131 | 168 | -- | 329 |
1 The rows represent the start time of using MPSS/MP (h: hours, d: days), the columns represent the accumulated time of medication (d: days), and the figures represent the number of TSCI patients. 2 There is no accumulated time about use of MPSS/MP at over-instruction dose (≥ 500 mg). MPSS/MP: Methylprednisolone sodium succinate/methylprednisolone; TSCI: traumatic spinal cord injury.
Neurotrophic drugs, dehydrants, and cathartics
Neurotrophic drugs were administered in 8727 patients overall (64.8%); the most common ones administered were ganglioside (4650 patients, 53.3%), mouse nerve growth factor (2504 patients, 28.7%), and mecobalamin (2364 patients, 27.1%). A dehydrant was administered in 8095 patients (60.1%); mannitol was the most commonly used dehydrant (6814 patients, 84.2%). Cathartics were administered in 1236 patients (9.2%); glycerin/glycerine enema was the most commonly used agent (1164 patients, 94.2%; Additional Table 5).
Additional Table 5.
The use of neurotrophic drugs, dehydrants and cathartics among TSCI patients during hospitalization
| Category | Numberof patients, n (%)1 |
|---|---|
| Neurotrophic drugs | 8727 (64.8) |
| Ganglioside | 4650 (53.5) |
| Mouse nerve growth factor | 2504 (28.7) |
| Mecobalamin | 2364 (27.1) |
| Neurotropin | 1786 (20.5) |
| Cattle encephalon glycoside and ignotin | 358 (4.1) |
| Cobamamide | 192 (2.2) |
| Others2 | 65(0.7) |
| Dehydrants | 8095 (60.1) |
| Mannitol | 6814 (84.2) |
| Glycerin fructose | 1464 (18.1) |
| Sodium aescinate | 336 (4.2) |
| Cathartics | 1236 (9.2) |
| Glycerin or glycerine enemas | 1164(94.2) |
| Lactulose oral solution | 123 (10.0) |
| Maren soft capsule | 25 (2.0) |
1 The overall use rate of neurotrophic drugs, dehydrants and cathartics was calculated by the proportion among TSCI patients.
The utilization rate of each drug was calculated by the proportion among patients who used neurotrophic drugs, dehydrants or
cathartics. 2 "others" included "Muscular amino acids and nucleosides" and/or "Deproteinized calf blood extractive". TSCI:
Traumatic spinal cord injury.
Economic burden and length of hospital stay
Mean total cost among the 10,945 acute TSCI patients was 71,300 CNY/11,500 USD. Mean daily cost was 4400 CNY/700 USD. Both mean total and daily costs decreased gradually with age. Among the occupational categories, mean total and daily costs were highest in workers (80,700 CNY/13,000 USD total and ¥4400, $ 700 daily). Among the etiological groups, mean total cost was highest in patients struck by falling objects (97,300 CNY/15,700 USD) while mean daily cost was highest in high falls (4800 CNY/800 USD). Among the levels of injury, mean total cost was highest in cauda equina (94,100 CNY/15,200 USD) and mean daily cost was highest in the multi-site group (5200 CNY/800 USD). Both mean total and daily costs increased as AIS grade increased from E to A. The mean length of hospital stay was 20.0 ± 26.5 days (Table 3 and Additional Table 6).
Table 3.
The costs among acute traumatic spinal cord injury patients during hospitalization
| Categories | Number of patients | Total costs (CNY/USD, thousand) | Daily costs (CNY/USD, thousand) |
|---|---|---|---|
| Gender | |||
| Men | 7919 | 73.9±73.0/11.9±11.8 | 4.4±3.4/0.7±0.5 |
| Women | 2490 | 63.1±65.7/10.2±10.6 | 4.3±3.5/0.7±0.6 |
| Total | 10409 | 71.3±71.4/11.5±11.5 | 4.4±3.4/0.7±0.6 |
| Age groups | |||
| 15–24 yr | 572 | 83.5±102.7/ 13.5±16.6 | 4.5±3.5/0.7±0.6 |
| 25–34 yr | 1164 | 78.6±70.9/12.7±11.4 | 4.5±3.5/0.7±0.6 |
| 35–44 yr | 1824 | 76.1±80.9/12.3±13.1 | 4.5±3.3/0.7±0.5 |
| 45–54 yr | 2909 | 73.4±65.7/11.9±10.6 | 4.4±3.5/0.7±0.6 |
| 55–64 yr | 2322 | 66.6±59.0/10.7±9.5 | 4.3±3.6/0.7±0.6 |
| ≥ 65 yr | 1618 | 59.5±71.2/9.6±11.5 | 4.1±3.2/0.7±0.5 |
| Occupations | |||
| Farmers | 4136 | 64.5±54.5/10.4±8.8 | 4.2±3.3/0.7±0.6 |
| Workers | 1260 | 80.7±77.9/13.0±12.6 | 4.4±4.0/0.7±0.6 |
| Retired | 699 | 56.5±52.9/9.1±8.5 | 4.0±3.1/0.7±0.5 |
| Office clerks | 483 | 70.0±73.6/11.3±11.9 | 4.4±4.2/0.7±0.7 |
| Students | 275 | 80.2±125.8/13.0±20.3 | 4.2±3.8/0.7±0.6 |
| Self-employed | 219 | 61.0±52.6/9.9±8.5 | 3.8±3.0/0.6±0.5 |
| Civil servants | 163 | 64.5±61.7/10.4±10.0 | 3.9±4.0/0.6±0.6 |
| Drivers | 129 | 75.1±98.7/12.1±15.9 | 3.7±2.6/0.6±0.4 |
| Others† | 2599 | 79.8±86.5/12.9±14.0 | 4.5±3.1/0.7±0.5 |
| Missing|| | 446 | 84.1±60.9/13.6±9.8 | 5.6±3.4/0.9±0.5 |
| Etiological groups | |||
| Low falls | 3102 | 55.1±49.3/8.9±8.0 | 3.9±3.3/0.6±0.5 |
| High falls | 3284 | 81.7±74.5/13.2±12.0 | 4.8±3.5/0.8±0.6 |
| Traffic accidents | 2567 | 73.7±75.0/11.9±12.1 | 4.2±3.2/0.7±0.5 |
| Struck by falling objects | 624 | 97.3±113.0/15.7±18.2 | 4.8±4.0/0.8±0.6 |
| Sport related injuries | 105 | 44.9±43.0/7.3±6.9 | 4.3±4.4/0.7±0.7 |
| Others‡ | 554 | 64.8±68.8/10.5±11.1 | 3.6±2.7/0.6±0.4 |
| Missing|| | 173 | 74.6±51.2/12.0±8.3 | 5.4±3.3/0.9±0.5 |
| Level of injury | |||
| Cervical | 6335 | 66.3±69.0/10.7±11.1 | 4.2±3.2/0.7±0.5 |
| Thoracic | 1696 | 93.4±91.4/15.1±14.8 | 5.0±3.7/0.8±0.6 |
| Lumbosacral | 2071 | 69.0±58.1/11.1±9.4 | 4.4±3.7/0.7±0.6 |
| Multi-site | 124 | 74.7±43.0/12.1±6.9 | 5.2±2.6/0.8±0.4 |
| Cauda equina | 37 | 94.1±39.6/15.2±6.4 | 5.1±1.7/0.8±0.3 |
| Missing|| | 146 | 55.3±60.2/8.9±9.7 | 3.7±2.6/0.6±0.4 |
| Severity | |||
| Complete quadriplegia | 1356 | 93.2±103.2/15.1±16.7 | 4.8±3.3/0.8±0.5 |
| Complete paraplegia | 2137 | 94.0±90.8/15.2±14.7 | 5.0±4.2/0.8±0.7 |
| Incomplete quadriplegia | 4499 | 58.4±49.9/9.4±8.1 | 4.0±3.1/0.6±0.5 |
| Incomplete paraplegia | 2308 | 63.4±54.8/10.2±8.8 | 4.2±3.0/0.7±0.5 |
| Missing|| | 109 | 56.8±51.6/9.2±8.3 | 3.6±2.8/0.6±0.5 |
| AIS grade§ | |||
| A | 2821 | 96.3±102.9/15.6±16.6 | 5.1±4.0/0.8±0.6 |
| B | 721 | 92.6±72.0/14.9±11.6 | 5.1±3.8/0.8±0.6 |
| C | 1726 | 76.6±56.4/12.4±9.1 | 4.4±2.9/0.7±0.5 |
| D | 4930 | 52.8±43.7/8.5±7.1 | 3.9±3.1/0.6±0.5 |
| E | 165 | 49.9±54.5/8.1±8.8 | 3.3±2.8/0.5±0.5 |
| Missing|| | 46 | 70.4±76.7/11.4±12.4 | 4.1±2.3/0.7±0.4 |
† "Others“ included "Teachers“, "Unemployed“ and "Freelances“. ‡ "Others“ included "Injuries caused by others“, "Work related injuries“, "Sharp injuries“, "Massage related injuries“, "Electric shock injuries“, "Gunshot wounds“, "Crush injuries“, and "Iatrogenic injuries“. § AIS grade A represents complete impairment with no motor or sensory function below the level of injury; grades B–D represent progressively less severe impairment; AIS grade E represents normal motor and sensory examinations, but still may have abnormal reflexes or other neurologic phenomena. ||"Missing“ represented those patients for whom the exact classification of the subgroup could not be confirmed. Values are reported as means ± standard deviation or numbers of patients (%). AIS: American Spinal Injury Association (ASIA) Impairment Scale; CNY: Chinese Yuan; USD: USA dollar; SD: standard deviation.
Additional Table 6.
Trends in the length of hospital stay among acute TSCI patients 1 from 2013 to 20181
| Category | Overall | 2013 | 2014 | 2015 | 2016 | 2017 | 2018 | APC (95% CI) |
|---|---|---|---|---|---|---|---|---|
| Gender, Mean (SD) | ||||||||
| Men | 20.5 (27.4) | 22.1 (21.0) | 23.3 (40.8) | 20.3 (24.0) | 21.3 (25.9) | 19.7 (28.9) | 17.5 (17.9) | -4.5 (-8.0, -0.9) |
| Women | 18.4 (23.5) | 19.7 (16.9) | 20.2 (19.6) | 20.4 (26.8) | 20.0 (25.8) | 18.1 (30.7) | 14.2 (14.4) | -5.5 (-11.7, 1.1) |
| Total | 20.0 (26.5) | 21.5 (20.1) | 22.6 (37.1) | 20.3 (24.7) | 21.0 (25.9) | 19.3 (29.3) | 16.6 (17.2) | -4.8 (-8.7, -0.8) |
| Age groups, Mean(SD) | ||||||||
| 15-24years | 22.5 (32.3) | 21.6 (15.3) | 24.9 (26.3) | 20.4 (24.3) | 23.6 (23.1) | 26.8 (67.2) | 19.1 (16.4) | -0.7 (-9.6, 9.1) |
| 25-34years | 21.7 (25.8) | 26.3 (30.1) | 25.6 (30.6) | 22.1 (30.7) | 20.1 (19.3) | 20.0 (22.7) | 18.8 (22.1) | -6.9 (-9.4, -4.4) |
| 35-44years | 21.2 (35.8) | 22.2 (22.7) | 24.4 (64.2) | 21.9 (29.1) | 21.0 (28.0) | 18.6 (22.0) | 18.7 (23.4) | -4.8 (-8.4, -1.0) |
| 45-54years | 20.9 (26.0) | 20.3 (14.3) | 22.3 (23.7) | 22.4 (27.8) | 22.0 (29.3) | 20.8 (32.3) | 17.9 (18.5) | -2.4 (-7.5, 3.0) |
| 55-64years | 18.6 (20.2) | 20.9 (19.6) | 22.0 (28.2) | 17.0 (14.6) | 20.8 (22.9) | 16.6 (20.1) | 16.1 (12.4) | -5.4 (-11.6, 1.2) |
| ≥ 65 years | 17.0 (20.4) | 19.9 (19.4) | 17.1 (14.6) | 18.1 (17.8) | 19.2 (26.0) | 18.4 (27.5) | 12.3 (8.8) | -5.9 (-14.7, 3.8) |
1 Length of hospital stay was measured in days. APC: Annual percentage change; CI: confidence interval; SD: standard deviation.
Between 2013 and 2018, the total cost for TSCI significantly decreased (APC, −4.7%; 95% CI, −6.3–−3.1%; P = 0.001). Daily cost did not significantly change overall (APC, 1.0%; 95% CI, −1.4–3.5%; P = 0.300) nor in men (APC, 0.5%; 95% CI, −2.0–3.1%; P = 0.602) or women (APC, 1.5%; 95% CI, −1.5–4.7%, P = 0.240). Daily cost did not significantly change in any age group except for the ≥ 65 years group (APC, 2.9%; 95% CI, 0.1–5.9%; P = 0.045). Mean length of hospital stay decreased (APC, −4.8%; 95% CI, −8.7 to −0.8%; P = 0.030; Additional Tables 6 and 7).
Additional Table 7.
Trends in the costs among acute TSCI patients 1 from 2013 to 2018
| Category | 2013 | 2014 | 2015 | 2016 | 2017 | 2018 | APC (95% CI) |
|---|---|---|---|---|---|---|---|
| Total costs (CNY ¥ , thousand), Mean (SD) | |||||||
| Gender | |||||||
| Men | 84.5 (80.2) | 81.9 (85.9) | 73.2 (62.7) | 71.9 (64.5) | 68.9 (76.7) | 68.7 (68.4) | -4.4 (-6.3, -2.4) |
| Women | 69.2 (58.4) | 73.7 (110.3) | 67.4 (69.2) | 62.5 (54.6) | 57.7 (45.8) | 54.8 (46.4) | -5.5 (-8.3, -2.6) |
| Total | 80.8 (75.8) | 80.1 (90.8) | 71.9 (64.2) | 69.7 (62.4) | 66.1 (70.6) | 65.1 (63.8) | -4.7 (-6.3, -3.1) |
| Age groups | |||||||
| 15-24years | 83.1 (58.0) | 104.8 (204.7) | 79.7 (70.4) | 75.9 (51.1) | 80.1 (99.1) | 79.1 (60.7) | -3.0 (-9.8, 4.2) |
| 25-34years | 97.7 (101.8) | 96.5 (94.8) | 72.0 (66.9) | 74.7 (59.4) | 72.8 (55.4) | 68.8 (46.6) | -7.1 (-12.1, -1.7) |
| 35-44years | 84.6 (91.8) | 81.7 (100.7) | 74.4 (53.8) | 74.6 (71.2) | 69.7 (51.3) | 72.4 (100.8) | -3.5 (-5.7, -1.2) |
| 45-54years | 84.7 (67.5) | 75.4 (61.2) | 78.8 (69.8) | 70.1 (70.1) | 68.4 (62.1) | 69.9 (62.7) | -3.8 (-6.6, -0.9) |
| 55-64years | 73.6 (66.4) | 77.3 (75.8) | 64.0 (55.7) | 68.7 (54.6) | 56.9 (46.6) | 62.9 (53.8) | -4.6 (-9.4, 0.5) |
| ≥ 65 years | 63.2 (57.8) | 64.8 (65.1) | 63.4 (69.2) | 59.0 (50.5) | 63.3 (112.8) | 50.5 (42.8) | -3.5 (-8.1, 1.2) |
| Daily costs (CNY ¥ , thousand), Mean (SD) | |||||||
| Gender | |||||||
| Men | 4.4 (3.3) | 4.3 (3.4) | 4.4 (3.0) | 4.1 (2.7) | 4.5 (4.0) | 4.5 (3.6) | 0.5 (-2.0, 3.1) |
| Women | 4.0 (3.7) | 4.4 (3.9) | 4.2 (3.5) | 4.1 (3.4) | 4.2 (3.2) | 4.6 (3.5) | 1.5 (-1.5, 4.7) |
| Total | 4.3 (3.4) | 4.3 (3.5) | 4.3 (3.2) | 4.1 (2.8) | 4.4 (3.8) | 4.6 (3.6) | 1.0 (-1.4, 3.5) |
| Age groups | |||||||
| 15-24years | 4.1 (2.5) | 5.1 (5.7) | 4.3 (2.7) | 4.4 (3.3) | 4.6 (3.0) | 4.8 (3.0) | 1.4 (-4.0, 7.2) |
| 25-34years | 4.6 (3.6) | 4.6 (3.4) | 4.5 (3.8) | 4.3 (2.7) | 4.6 (4.7) | 4.5 (2.7) | -0.4 (-2.3, 1.4) |
| 35-44years | 4.5 (4.2) | 4.4 (3.8) | 4.4 (2.9) | 4.3 (2.9) | 4.7 (3.0) | 4.4 (2.7) | 0.2 (-2.1, 2.5) |
| 45-54years | 4.5 (3.1) | 4.2 (3.2) | 4.5 (3.5) | 4.0 (2.6) | 4.5 (4.5) | 4.6 (3.1) | 0.6 (-3.3, 4.6) |
| 55-64years | 4.1 (2.9) | 4.3 (3.1) | 4.1 (2.7) | 4.1 (3.3) | 4.2 (3.3) | 4.6 (5.0) | 1.5 (-1.3, 4.2) |
| ≥ 65 years | 3.8 (3.9) | 3.9 (2.9) | 4.0 (3.1) | 3.8 (2.5) | 4.2 (3.1) | 4.5 (3.5) | 2.9 (0.1, 5.9) |
APC: Annual percentage change; CI: confidence interval; CNY: Chinese Yuan; SD: standard deviation; TSCI: traumatic spinal cord injury.
Discussion
In this retrospective, multicenter, hospital-based, nationwide study of the epidemiological and clinical features, treatment status, and economic burden of TSCI in China from 2013 to 2018, we found that the percentages of TSCIs among all hospitalized patients and among patients hospitalized in the orthopedic department did not significantly change overall; however, the percentage of TSCIs among both groups increased when the number of TSCIs per year was greater than 140. We also described the various treatments (surgery, MPSS/MP, neurotrophic drugs, dehydrants, and cathartics) in detail. Total cost for acute TSCI decreased over the study period, while daily cost did not significantly change.
Our epidemiological features, such as gender (75.7% men) and mean age (50.0 years) were consistent with those reported in previous studies of TSCI in China (Wang et al., 2013; Ning et al., 2016; Yuan et al., 2018; Li et al., 2019; Liu et al., 2022). In previous studies conducted in other countries, men also accounted for between 70% and 80% of all TSCI patients (National Spinal Cord Injury Statistical Center, 2016; Smith et al., 2018; Halvorsen et al., 2019; Miyakoshi et al., 2021). This male predominance might be explained by the fact that men are more likely to work in high-risk jobs (falls from working at heights) or be exposed to other causes of SCI (e.g., sports-related accidents, violent injuries) (Abbas et al., 2019; Furlan et al., 2019; Zhang et al., 2021). The mean age of TSCI patients in previous studies from Norway, Ireland, and Japan was also similar to ours (Smith et al., 2018; Tafida et al., 2018). However, our mean age was significantly higher than that reported in a 2016 study from the United States (42 years), which might be related to differences in SCI cause (National Spinal Cord Injury Statistical Center, 2016). From 2010 to 2016, China had the highest number of SCIs caused by low falls (approximately 30%) and high falls (29.4%), whereas the United States had the highest number of SCIs caused by vehicle crashes (approximately 38%) and a significant proportion of violent injuries (13.5%). Both of which were more likely to occur in a younger age group (National Spinal Cord Injury Statistical Center, 2016). In our study, a high proportion of TSCI patients were farmers (38.8%), which differs from epidemiological studies in Turkey and Mexico (Güzelküçük et al., 2015; Zárate-Kalfópulos et al., 2016). This may reflect the type of work that workers in China are undertaking. Injuries caused by high-risk construction, which increases the risk of a fall from an elevated height, made up 29.4% of all TSCIs (National Bureau of Statistics, 2022).
From 2013 to 2018, the percentage of TSCIs among all hospitalized patients and patients hospitalized in the orthopedic departments did not significantly change overall. This finding is similar to the trend of age-standardized incidence rates of SCI in China reported in the GBD study (GBD 2016 Traumatic Brain Injury and Spina Cord Injury Collaborators, 2019). Moreover, the trend of these percentages in our study is similar to the percentage change in age-standardized rates in the United States (3.7%), Canada (–2.5%), and the United Kingdom (–0.4%) from 1990 to 2016 (GBD 2016 Traumatic Brain Injury and Spinal Cord Injury Collaborators, 2019). The percentage of TSCI among all hospitalized patients and among patients hospitalized in the orthopedic department increased when the number of TSCIs per year was greater than 140. This might reflect a changing trend in China of TSCI patients being treated in hospitals with more TSCI expertise. Transferring TSCI patients to hospitals that specialize in TSCI is likely to improve the quality of care and may reduce the burden on large non-specialty hospitals. In China, the over-burdening of large non-specialty hospitals has prevented the provision of optimal TSCI care such as early treatment (National Health Commission of the People’s Republic of China, 2019).
Early surgery is generally recommended for patients with TSCI (Hansebout, 2022). A recent pooled analysis of 1548 patients showed that surgical decompression within 24 hours of acute SCI is associated with improved sensorimotor recovery (Badhiwala et al., 2021). In our study, approximately 2.8% of patients who underwent surgery did so within 24 hours of injury. Irrespective of the preference of clinicians for the use of early surgery, most hospitals do not have the capacity to perform early surgery because they lack experienced surgeons, imaging and laboratory equipment, and pre-anesthetic assessments (Thompson et al., 2018).
Another key area of TSCI management is pharmacological interventions (Qian et al., 2022; Yang et al., 2022). Current pharmacological treatment principally relies on the off-label use of MPSS/MP, which remains contentious (Roquilly et al., 2020; Takami et al., 2020; Hansebout, 2022; Guan et al., 2023). Based upon the available evidence, the most recent guidelines of the American Association of Neurological Surgeons and Congress of Neurological Surgeons do not currently recommend administration of MP for the treatment of acute SCI and state that there is insufficient evidence to make a recommendation of using MP for treatment of patients with thoracolumbar spine trauma (Hurlbert et al., 2013; Arnold et al., 2019). In contrast, the AOSpine organization has suggested high-dose MPSS/MP within 8 hours of acute SCI as a treatment option in their 2017 guidelines (Fehlings et al., 2017). Guan et al. (2023) performed a critical appraisal of eight different clinical practice guidelines regarding pharmacological treatments for SCI and found that three recommended for MP (one evidence-based and two consensus-based), three recommended against (all evidence-based), and two recommended neither for nor against. A retrospective population-based cohort study in South Korea from 2007 to 2017 showed that 61.5% of patients received high-dose MPSS/MP within 8 hours of injury (Choi et al., 2020). In our study, we used 500 mg of MPSS/MP as the threshold for high-dose and found that 14.9% of TSCI patients received high-dose MPSS/MP; however, only 4.6% of patients received it within 8 hours. The low rate of MPSS/MP use might reflect the conflicting guideline recommendations, ongoing controversy in clinical management, limited resources in Chinese hospitals, or a lack of awareness of best practices among health professionals (Arnold et al., 2019; Hansebout, 2022). Future high-quality randomized controlled trials or comprehensive observational studies are needed to explore the benefits and harms of glucocorticoid treatment and help inform clinical care (Liu et al., 2019).
In addition to low rates of early surgery and glucocorticoid use, we also found common usage of treatments not considered a part of usual care, such as neurotrophic drugs, dehydrants, and cathartics. The American Association of Neurological Surgeons and Congress of Neurological Surgeons guidelines do not recommend administration of GM-1 ganglioside for the treatment of acute SCI and state that there is insufficient evidence to make a recommendation for its use in patients with thoracolumbar spine trauma (Hurlbert et al., 2013; Arnold et al., 2019). In our study, 64.8% of patients received neurotrophic drugs, just over half of which received ganglioside. The high rate of neurotrophic drug use in China may reflect the insufficient high-quality evidence to recommend for or against it.
The average total cost of care for an acute TSCI patient was 71,300 CNY/11,500 USD, which represents 3.9 times the 2013 per capita disposable income in China of 18,300 CNY (National Bureau of Statistics, 2022). Such a cost is not only a large burden for a patient and family but also for health providers. China has the largest number of spinal cord injuries (3,739,610, prevalence, 2016 counts) and the second highest number of new cases (98,226, incidence, 2016 counts) worldwide based on the 2016 GBD study (GBD 2016 Traumatic Brain Injury and Spinal Cord Injury Collaborators, 2019). We also found that total cost decreased but daily costs did not significantly change during the same period, which was consistent with the reduction in mean length of hospital stay. On one hand, the cause of the reduction in length of hospital stay may be related to improvements in diagnosis and treatment and/or simplifications of the diagnosis/treatment process (National Health Commission of the People’s Republic of China, 2019). On the other hand, it may be a result of patients leaving the hospital earlier because of cost considerations rather than improvements in care. Early discharge from the hospital may also lead to deep wound infection, wound dehiscence, and deep venous thrombosis (Otero et al., 2016).
Although this study is the largest known study of TSCI in China, it has several limitations. First, it was not population-based, so we could not calculate the incidence and prevalence rates of TSCI from the entire population. Second, some data were missing; however, the proportion of missing data in most characteristics was less than 5.0%. Third, we only described the use of MPSS/MP, not other glucocorticoids such as hydrocortisone and dexamethasone, because these agents may have been used to treat other conditions. Fourth, our study did not span a longer time frame or include data before 2012 or after 2018 for two reasons. Data were collected by sending professionals to various hospitals for collection; however, to increase the number of representative hospitals in each region and the completeness of the indicator for representative hospitals, we had to discard data before 2012 because some of the hospitals did not have sufficient data owing to significant differences in case system turnover, case retention periods, and access rights to historical cases. We would have added data from 2018 onwards, but this was precluded by the COVID-19 pandemic. The 6-year time frame from 2013 to 2018 may have limited our dataset to be more representative. Future studies with higher quality and more recent data and a longer time frame are urgently needed.
Conclusion
This study revealed the epidemiological profile and features of TSCI in China from 2013 to 2018. Our findings indicate that public health initiatives should aim at improving hospitals’ ability to perform early surgery within 24 hours, which is associated with improved sensorimotor recovery; increasing the awareness rate of clinical guidelines related to high-dose MPSS/MP to reduce the use of the treatment with insufficient evidence.
Additional files:
Additional file 1 (79.7KB, pdf) : American Spinal Injury Association Impairment Scale (AIS).
American Spinal Injury Association Impairment Scale (AIS)
Additional file 2 (108.2KB, pdf) : Continuous and intermittent use, and time-point cut-offs of MPSS/MP.
Continuous and intermittent use, and time-point cut-offs of MPSS/MP
Additional file 3 (99.2KB, pdf) : The subgroup about trends of the percentages.
The subgroup about trends in percentages
Additional file 4 (78.7KB, pdf) : The exploration for trends between hospitals’ TSCI number and the percentage change.
The exploration for trends between hospitals' TSCI number 1 and the percentage
Additional file 5 (75.9KB, pdf) : Calculation of annual percentage change (APC).
Calculation of annual percentage change (APC)
Additional Table 1: List of 30 hospitals included in this study.
Additional Table 2: American Spinal Injury Association Impairment Scale (AIS) grade.
Additional Table 3: Trends in the percentage of different subgroups among TSCI patients from 2013 to 2018.
Additional Table 4: The use of MPSS/MP among TSCI patients during hospitalization.
Additional Table 5: The use of neurotrophic drugs, dehydrants and cathartics among TSCI patients during hospitalization.
Additional Table 6: Trends in the length of hospital stay among acute TSCI patients from 2013 to 2018.
Additional Table 7: Trends in the costs among acute TSCI patients from 2013 to 2018.
Additional Figure 1 (392.5KB, tif) : Trends in the percentage among TSCI patients of 20 hospitals from 2013 to 2018.
Trends in the percentage among TSCI patients of 20 hospitals from 2013 to 2018.
(A) Trends in percentages of TSCI in hospitalized patients of each hospital. (B) Trends in percentage of TSCI in hospitalized patients in orthopedic departments of each hospital. APC: Annual percentage change; CI: confidence interval; TSCI: traumatic spinal cord injury.
Additional Figure 2 (314.3KB, tif) : The trends of APC in the percentage among TSCI patients from 20 hospitals.
The trends of APC in percentages among TSCI patients from 20 hospitals.
(A) The trend of APC in percentage in different number of hospitalized patients with TSCI per year. (B) The trend of APC in percentage in different numbers of patients with TSCI from the orthopedic departments per year. The value of the horizontal axis represents the annual number of TSCI patients admitted. The APC corresponding to the points refers to the comprehensive calculation of APC from 2013 to 2018 of all eligible hospitals whose annual number of TSCI patients was higher than the corresponding number of horizontal axis in 20 hospitals. Shaded regions represent 95% confidence interval. APC: Annual percentage change; TSCI: traumatic spinal cord injury.
Funding Statement
Funding: This study was supported by the National Key Research and Development Project, No. 2019YFA0112100 (to SF).
Footnotes
Conflicts of interest: The authors declare that there are no conflicts of interest associated with this manuscript.
Data availability statement: All data generated or analyzed during this study are included in this published article and its Additional files.
Author statement: This paper has been posted as a preprint on medRxiv with doi: https://doi.org/10.1101/2021.09.27.21264179, which is available from https://www.medrxiv.org/content/10.1101/2021.09.27.21264179v1.full-text.
C-Editor: Zhao M; S-Editor: Li CH; L-Editors: Wetzel M, Song LP; T-Editor: Jia Y
References
- 1.Abbas A, Aziz HF, Rizvi R, Rehaman L, Javeed F, Afzal A. Gunshot acquired spinal cord injury in civilians. Turk Neurosurg. (2019);29:506–512. doi: 10.5137/1019-5149.JTN.24121-18.2. [DOI] [PubMed] [Google Scholar]
- 2.Ahuja CS, Wilson JR, Nori S, Kotter MRN, Druschel C, Curt A, Fehlings MG. Traumatic spinal cord injury. Nat Rev Dis Primers. (2017);3:17018. doi: 10.1038/nrdp.2017.18. [DOI] [PubMed] [Google Scholar]
- 3.Arnold PM, Anderson PA, Chi JH, Dailey AT, Dhall SS, Eichholz KM, Harrop JS, Hoh DJ, Qureshi S, Rabb CH, Raksin PB, Kaiser MG, O'Toole JE. Congress of neurological surgeons systematic review and evidence-based guidelines on the evaluation and treatment of patients with thoracolumbar spine trauma:pharmacological treatment. Neurosurgery. (2019);84:E36–38. doi: 10.1093/neuros/nyy371. [DOI] [PubMed] [Google Scholar]
- 4.Badhiwala JH, Wilson JR, Fehlings MG. Global burden of traumatic brain and spinal cord injury. Lancet Neurol. (2019);18:24–25. doi: 10.1016/S1474-4422(18)30444-7. [DOI] [PubMed] [Google Scholar]
- 5.Badhiwala JH, Wilson JR, Witiw CD, Harrop JS, Vaccaro AR, Aarabi B, Grossman RG, Geisler FH, Fehlings MG. The influence of timing of surgical decompression for acute spinal cord injury:a pooled analysis of individual patient data. Lancet Neurol. (2021);20:117–126. doi: 10.1016/S1474-4422(20)30406-3. [DOI] [PubMed] [Google Scholar]
- 6.Choi SH, Sung CH, Heo DR, Jeong SY, Kang CN. Incidence of acute spinal cord injury and associated complications of methylprednisolone therapy:a national population-based study in South Korea. Spinal Cord. (2020);58:232–237. doi: 10.1038/s41393-019-0357-2. [DOI] [PubMed] [Google Scholar]
- 7.Clark JM, Marshall R. Utilising International Statistical Classification of Diseases and Related Health Conditions (ICD)-10 Australian Modification Classifications of “Health Conditions”to Achieve Population Health Surveillance in an Australian Spinal Cord Injury Cohort. Spinal Cord. (2022);60:746–756. doi: 10.1038/s41393-022-00761-6. [DOI] [PMC free article] [PubMed] [Google Scholar]
- 8.DXY Drugs Information. Medication instructions for methylprednisolone sodium succinate for injection. (2022). [Accessed March 23, 2022]. http://drugs.dxy.cn/ drug/ 93535.htm.
- 9.Fehlings MG, Wilson JR, Tetreault LA, Aarabi B, Anderson P, Arnold PM, Brodke DS, Burns AS, Chiba K, Dettori JR, Furlan JC, Hawryluk G, Holly LT, Howley S, Jeji T, Kalsi-Ryan S, Kotter M, Kurpad S, Kwon BK, Marino RJ, et al. A clinical practice guideline for the management of patients with acute spinal cord injury:recommendations on the use of methylprednisolone sodium succinate. Global Spine J. (2017);7:203S–211S. doi: 10.1177/2192568217703085. [DOI] [PMC free article] [PubMed] [Google Scholar]
- 10.Furlan JC, Craven BC, Fehlings MG. Sex-related discrepancies in the epidemiology, injury characteristics and outcomes after acute spine trauma:a retrospective cohort study. J Spinal Cord Med. (2019);42:10–20. doi: 10.1080/10790268.2019.1607055. [DOI] [PMC free article] [PubMed] [Google Scholar]
- 11.GBD 2016 Traumatic Brain Injury and Spinal Cord Injury Collaborators (2019) Global, regional, and national burden of traumatic brain injury and spinal cord injury, 1990-2016:a systematic analysis for the Global Burden of Disease Study. Lancet Neurol. (2016);18:56–87. doi: 10.1016/S1474-4422(18)30415-0. [DOI] [PMC free article] [PubMed] [Google Scholar]
- 12.Gross-Hemmi MH, Post MW, Ehrmann C, Fekete C, Hasnan N, Middleton JW, Reinhardt JD, Strøm V, Stucki G. International Spinal Cord Injury Community Survey (InSCI) Group. Study Protocol of the International Spinal Cord Injury (InSCI) Community survey. Am J Phys Med Rehabil. (2017);96:S23–34. doi: 10.1097/PHM.0000000000000647. [DOI] [PubMed] [Google Scholar]
- 13.Guan B, Fan Y, Zheng R, Fu R, Yao L, Wang W, Li G, Chen L, Zhou H, Feng S. A critical appraisal of clinical practice guidelines on pharmacological treatments for spinal cord injury. Spine J. (2023);23:392–402. doi: 10.1016/j.spinee.2022.09.009. [DOI] [PubMed] [Google Scholar]
- 14.Güzelküçük Ü, Kesikburun S, Demir Y, Aras B, Özyörük E, Yılmaz B, Tan AK. Demographic and clinical characteristics of patients with traumatic cervical spinal cord injury:a Turkish hospital-based study. Spinal Cord. (2015);53:441–445. doi: 10.1038/sc.2014.211. [DOI] [PubMed] [Google Scholar]
- 15.Halvorsen A, Pettersen AL, Nilsen SM, Halle KK, Schaanning EE, Rekand T. Epidemiology of traumatic spinal cord injury in Norway in 2012-2016:a registry-based cross-sectional study. Spinal Cord. (2019);57:331–338. doi: 10.1038/s41393-018-0225-5. [DOI] [PubMed] [Google Scholar]
- 16.Hansebout RR. Acute traumatic spinal cord injury. In: Janet LW, editor. UpToDate. Waltham, MA: UpToDate Inc; (2022). [Accessed on March 23, 2022]. https://www.uptodate.com. [Google Scholar]
- 17.Hao D, Du J, Yan L, He B, Qi X, Yu S, Zhang J, Zheng W, Zhang R, Huang DG, Yang J, Zhu M, Ouyang J, Zhao H, Ding K, Shi H, Cao Y, Zhang Y, Tang Q, Liu Y, et al. Trends of epidemiological characteristics of traumatic spinal cord injury in China, 2009-2018. Eur Spine J. (2021);30:3115–3127. doi: 10.1007/s00586-021-06957-3. [DOI] [PubMed] [Google Scholar]
- 18.Harrell Jr FE. Cham, Switzerland: Springer; (2015). Regression modeling strategies:with applications to linear models, logistic and ordinal regression, and survival analysis. [Google Scholar]
- 19.Hurlbert RJ, Hadley MN, Walters BC, Aarabi B, Dhall SS, Gelb DE, Rozzelle CJ, Ryken TC, Theodore N. Pharmacological therapy for acute spinal cord injury. Neurosurgery. (2013);72(Suppl 2):93–105. doi: 10.1227/NEU.0b013e31827765c6. [DOI] [PubMed] [Google Scholar]
- 20.Jain NB, Ayers GD, Peterson EN, Harris MB, Morse L, O'Connor KC, Garshick E. Traumatic spinal cord injury in the United States 1993-2012. JAMA. (2015);313:2236–2243. doi: 10.1001/jama.2015.6250. [DOI] [PMC free article] [PubMed] [Google Scholar]
- 21.Lesko CR, Fox MP, Edwards JK. A framework for descriptive epidemiology. Am J Epidemiol. (2022);191:2063–2070. doi: 10.1093/aje/kwac115. [DOI] [PMC free article] [PubMed] [Google Scholar]
- 22.Li HL, Xu H, Li YL, Sun SW, Song WY, Wu Q, Ai J, Sun JC, Ning GZ, Feng SQ. Epidemiology of traumatic spinal cord injury in Tianjin, China:an 18-year retrospective study of 735 cases. J Spinal Cord Med. (2019);42:778–785. doi: 10.1080/10790268.2017.1415418. [DOI] [PMC free article] [PubMed] [Google Scholar]
- 23.Li QS, Jia YJ. Ferroptosis:a critical player and potential therapeutic target in traumatic brain injury and spinal cord injury. Neural Regen Res. (2023);18:506–512. doi: 10.4103/1673-5374.350187. [DOI] [PMC free article] [PubMed] [Google Scholar]
- 24.Liu GG. Discounting.In:China guidelines for pharmacoeconomic evaluations. In: Liu GG, editor. Beijing: China Market Press; (2020). pp. 117–119. [Google Scholar]
- 25.Liu J, Liu HW, Gao F, Li J, Li JJ. Epidemiological features of traumatic spinal cord injury in Beijing, China. J Spinal Cord Med. (2022);45:214–220. doi: 10.1080/10790268.2020.1793505. [DOI] [PMC free article] [PubMed] [Google Scholar]
- 26.Liu Z, Yang Y, He L, Pang M, Luo C, Liu B, Rong L. High-dose methylprednisolone for acute traumatic spinal cord injury:A meta-analysis. Neurology. (2019);93:e841–850. doi: 10.1212/WNL.0000000000007998. [DOI] [PubMed] [Google Scholar]
- 27.Miyakoshi N, Suda K, Kudo D, Sakai H, Nakagawa Y, Mikami Y, Suzuki S, Tokioka T, Tokuhiro A, Takei H, Katoh S, Shimada Y. A nationwide survey on the incidence and characteristics of traumatic spinal cord injury in Japan in 2018. Spinal Cord. (2021);59:626–634. doi: 10.1038/s41393-020-00533-0. [DOI] [PubMed] [Google Scholar]
- 28.National Bureau of Statistics (2022) Data. [Accessed March 23, 2022]. https://data.stats.gov.cn.
- 29.National Cancer Institute. Joinpoint Regression Program. (2022). [Accessed April 4, 2022]. https://surveillance.cancer.gov/joinpoint/
- 30.National Health Commission of the People's Republic of China (2019) National Report on the Services, Quality and Safety in medical care system. Beijing: Science and Technical Literature Press; (2018). [Google Scholar]
- 31.National Spinal Cord Injury Statistical Center (2016) Spinal Cord Injury (SCI) 2016 facts and figures at a glance. J Spinal Cord Med. 39:493–494. doi: 10.1080/10790268.2016.1210925. [DOI] [PMC free article] [PubMed] [Google Scholar]
- 32.Ning GZ, Mu ZP, Shangguan L, Tang Y, Li CQ, Zhang ZF, Zhou Y. Epidemiological features of traumatic spinal cord injury in Chongqing, China. J Spinal Cord Med. (2016);39:455–460. doi: 10.1080/10790268.2015.1101982. [DOI] [PMC free article] [PubMed] [Google Scholar]
- 33.Otero JE, Gholson JJ, Pugely AJ, Gao Y, Bedard NA, Callaghan JJ. Length of hospitalization after joint arthroplasty:does early discharge affect complications and readmission rates. J Arthroplasty. (2016);31:2714–2725. doi: 10.1016/j.arth.2016.07.026. [DOI] [PubMed] [Google Scholar]
- 34.Qian ZY, Kong RY, Zhang S, Wang BY, Chang J, Cao J, Wu CQ, Huang ZY, Duan A, Li HJ, Yang L, Cao XJ. Ruxolitinib attenuates secondary injury after traumatic spinal cord injury. Neural Regen Res. (2022);17:2029–2035. doi: 10.4103/1673-5374.335165. [DOI] [PMC free article] [PubMed] [Google Scholar]
- 35.Roberts TT, Leonard GR, Cepela DJ. Classifications In Brief:American Spinal Injury Association (ASIA) Impairment Scale. Clin Orthop Relat Res. (2017);475:1499–1504. doi: 10.1007/s11999-016-5133-4. [DOI] [PMC free article] [PubMed] [Google Scholar]
- 36.Rodakowski J, Skidmore ER, Anderson SJ, Begley A, Jensen MP, Buhule OD, Boninger ML. Additive effect of age on disability for individuals with spinal cord injuries. Arch Phys Med Rehabil. (2014);95:1076–1082. doi: 10.1016/j.apmr.2014.01.022. [DOI] [PMC free article] [PubMed] [Google Scholar]
- 37.Roquilly A, Vigué B, Boutonnet M, Bouzat P, Buffenoir K, Cesareo E, Chauvin A, Court C, Cook F, de Crouy AC, Denys P, Duranteau J, Fuentes S, Gauss T, Geeraerts T, Laplace C, Martinez V, Payen JF, Perrouin-Verbe B, Rodrigues A, et al. French recommendations for the management of patients with spinal cord injury or at risk of spinal cord injury. Anaesth Crit Care Pain Med. (2020);39:279–289. doi: 10.1016/j.accpm.2020.02.003. [DOI] [PubMed] [Google Scholar]
- 38.Salomaa V, Arstila M, Kaarsalo E, Ketonen M, Kuulasmaa K, Lehto S, Miettinen H, Mustaniemi H, Niemelä M, Palomäki P, Pvörätä K, Torppa J, Tuomilehto J, Vuorenmaa T. Trends in the incidence of and mortality from coronary heart disease in Finland, 1983-1988. Am J Epidemiol. (1992);136:1303–1315. doi: 10.1093/oxfordjournals.aje.a116442. [DOI] [PubMed] [Google Scholar]
- 39.Selvarajah S, Hammond ER, Haider AH, Abularrage CJ, Becker D, Dhiman N, Hyder O, Gupta D, Black JH, 3rd, Schneider EB. The burden of acute traumatic spinal cord injury among adults in the united states:an update. J Neurotrauma. (2014);31:228–238. doi: 10.1089/neu.2013.3098. [DOI] [PubMed] [Google Scholar]
- 40.Smith E, Fitzpatrick P, Murtagh J, Lyons F, Morris S, Synnott K. Epidemiology of traumatic spinal cord injury in Ireland, 2010-2015. Neuroepidemiology. (2018);51:19–24. doi: 10.1159/000488146. [DOI] [PubMed] [Google Scholar]
- 41.Tafida MA, Wagatsuma Y, Ma E, Mizutani T, Abe T. Descriptive epidemiology of traumatic spinal injury in Japan. J Orthop Sci. (2018);23:273–276. doi: 10.1016/j.jos.2017.10.013. [DOI] [PubMed] [Google Scholar]
- 42.Takami T, Shimokawa N, Parthiban J, Zileli M, Ali S. Pharmacologic and regenerative cell therapy for spinal cord injury:WFNS spine committee recommendations. Neurospine. (2020);17:785–796. doi: 10.14245/ns.2040408.204. [DOI] [PMC free article] [PubMed] [Google Scholar]
- 43.The-Institute-for-Health-Metrics-and-Evaluation. Global Health Data Exchange. (2022). [Accessed March 23, 2022]. http://ghdx.healthdata.org/gbd-results-tool.
- 44.Thompson C, Feldman DE, Mac-Thiong JM. Surgical management of patients following traumatic spinal cord injury:Identifying barriers to early surgery in a specialized spinal cord injury center. J Spinal Cord Med. (2018);41:142–148. doi: 10.1080/10790268.2016.1165448. [DOI] [PMC free article] [PubMed] [Google Scholar]
- 45.von Elm E, Altman DG, Egger M, Pocock SJ, Gøtzsche PC, Vandenbroucke JP. The Strengthening the Reporting of Observational Studies in Epidemiology (STROBE) statement:guidelines for reporting observational studies. Ann Intern Med. (2007);147:573–577. doi: 10.7326/0003-4819-147-8-200710160-00010. [DOI] [PubMed] [Google Scholar]
- 46.Wang HF, Yin ZS, Chen Y, Duan ZH, Hou S, He J. Epidemiological features of traumatic spinal cord injury in Anhui Province, China. Spinal Cord. (2013);51:20–22. doi: 10.1038/sc.2012.92. [DOI] [PubMed] [Google Scholar]
- 47.Wecht JM, Krassioukov AV, Alexander M, Handrakis JP, McKenna SL, Kennelly M, Trbovich M, Biering-Sorensen F, Burns S, Elliott SL, Graves D, Hamer J, Krogh K, Linsenmeyer TA, Liu N, Hagen EM, Phillips AA, Previnaire JG, Rodriguez GM, Slocum C, et al. International Standards to document Autonomic Function following SCI (ISAFSCI):Second Edition. Top Spinal Cord Inj Rehabil. (2021);27:23–49. doi: 10.46292/sci2702-23. [DOI] [PMC free article] [PubMed] [Google Scholar]
- 48.Yang CH, Quan ZX, Wang GJ, He T, Chen ZY, Li QC, Yang J, Wang Q. Elevated intraspinal pressure in traumatic spinal cord injury is a promising therapeutic target. Neural Regen Res. (2022);17:1703–1710. doi: 10.4103/1673-5374.332203. [DOI] [PMC free article] [PubMed] [Google Scholar]
- 49.Yuan S, Shi Z, Cao F, Li J, Feng S. Epidemiological features of spinal cord injury in China:a systematic review. Front Neurol. (2018);9:683. doi: 10.3389/fneur.2018.00683. [DOI] [PMC free article] [PubMed] [Google Scholar]
- 50.Zárate-Kalfópulos B, Jiménez-González A, Reyes-Sánchez A, Robles-Ortiz R, Cabrera-Aldana EE, Rosales-Olivarez LM. Demographic and clinical characteristics of patients with spinal cord injury:a single hospital-based study. Spinal Cord. (2016);54:1016–1019. doi: 10.1038/sc.2016.41. [DOI] [PubMed] [Google Scholar]
- 51.Zhang ZR, Wu Y, Wang FY, Wang WJ. Traumatic spinal cord injury caused by low falls and high falls:a comparative study. J Orthop Surg Res. (2021);16:222. doi: 10.1186/s13018-021-02379-5. [DOI] [PMC free article] [PubMed] [Google Scholar]
- 52.Zhao D, Liu J, Wang W, Zeng Z, Cheng J, Liu J, Sun J, Wu Z. Epidemiological transition of stroke in China:twenty-one-year observational study from the Sino-MONICA-Beijing Project. Stroke. (2008);39:1668–1674. doi: 10.1161/STROKEAHA.107.502807. [DOI] [PubMed] [Google Scholar]
Associated Data
This section collects any data citations, data availability statements, or supplementary materials included in this article.
Supplementary Materials
American Spinal Injury Association Impairment Scale (AIS)
Continuous and intermittent use, and time-point cut-offs of MPSS/MP
The subgroup about trends in percentages
The exploration for trends between hospitals' TSCI number 1 and the percentage
Calculation of annual percentage change (APC)
Trends in the percentage among TSCI patients of 20 hospitals from 2013 to 2018.
(A) Trends in percentages of TSCI in hospitalized patients of each hospital. (B) Trends in percentage of TSCI in hospitalized patients in orthopedic departments of each hospital. APC: Annual percentage change; CI: confidence interval; TSCI: traumatic spinal cord injury.
The trends of APC in percentages among TSCI patients from 20 hospitals.
(A) The trend of APC in percentage in different number of hospitalized patients with TSCI per year. (B) The trend of APC in percentage in different numbers of patients with TSCI from the orthopedic departments per year. The value of the horizontal axis represents the annual number of TSCI patients admitted. The APC corresponding to the points refers to the comprehensive calculation of APC from 2013 to 2018 of all eligible hospitals whose annual number of TSCI patients was higher than the corresponding number of horizontal axis in 20 hospitals. Shaded regions represent 95% confidence interval. APC: Annual percentage change; TSCI: traumatic spinal cord injury.