

Summary
Computations that are performed by the cerebellar cortex are transmitted via simple spikes of Purkinje cells (P-cells) to downstream structures, but because P-cells are many synapses away from muscles, we do not know the relationship between modulation of simple spikes and control of behavior. Here, we recorded spiking activities of hundreds of P-cells in the oculomotor vermis of marmosets during saccadic eye movements and found that following the presentation of a visual stimulus, the olivary input to a P-cell coarsely described the direction and amplitude of the visual stimulus as well as the upcoming movement. Occasionally, the complex spike occurred just before saccade onset, suppressing the P-cell’s simple spikes and disrupting its output during that saccade. Remarkably, this brief suppression of simple spikes altered the saccade’s trajectory by pulling the eyes toward the part of the visual space that was preferentially encoded by the olivary input to that P-cell. Thus, there is an alignment between the sensory space encoded by the complex spikes and behavior conveyed by the simple spikes: a reduction in simple spikes is a signal to bias the ongoing movement toward the part of the sensory space preferentially encoded by the olivary input to that P-cell.
eTOC blurb
Muller, Pi, et al. show that a brief suppression of cerebellar Purkinje-cell output by a complex spike consistently perturbs saccade eye-movement by pulling the eye toward the part of the sensory space encoded by the olivary input to that Purkinje-cell. These results reveal how a P-cell is affecting downstream behaviors.
Graphical Abstract
Introduction
To understand the computations that are performed by a neuron, it is useful to quantify how the change in its output is translated into change in behavior. For example, a network of neurons in the cerebellar cortex makes predictions that are critical for control of a behavior, then transmits that information to the cerebellar nucleus via the simple spikes (SS) of Purkinje cells (P-cells). But what is the contribution of a P-cell’s SSs to the control of that behavior?
To answer this question, we might probe the behavioral effects of SSs through optogenetics, silencing or activating P-cells to study their downstream behavioral effects. However, there exists a different path: the input from the inferior olive to a P-cell produces a complex spike (CS) that briefly suppresses the SS 1,2. Does this suppression affect behavior? If so, what does the behavioral change imply regarding the information that is normally transmitted by that P-cell?
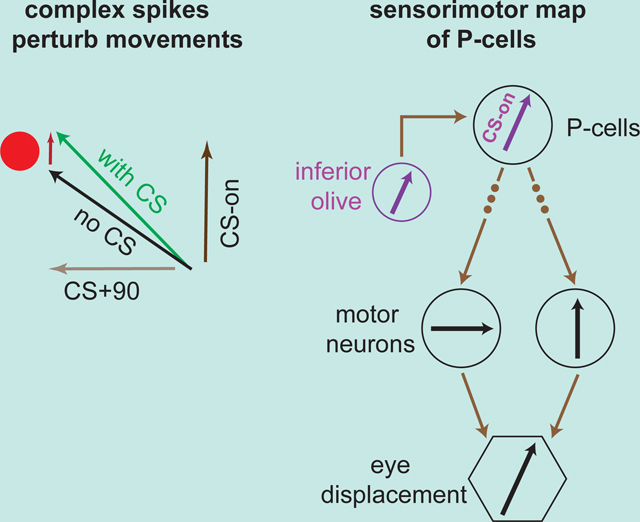
Anatomical and stimulation studies have hinted that the climbing fiber input of a P-cell likely plays a central role in defining the downstream projections of that P-cell 3,4. This input encodes sensory, reward 5–10 and motor events 11–15, and transmits that information to a handful of P-cells, which anatomically converge onto the same or nearby nucleus neurons 16–18. Stimulation of that region of the cerebellar nucleus produces a movement that appears related to the climbing fiber input to the P-cells 19. For example, optogenetic excitation of P-cells in a region of the oculomotor vermis that receives climbing fiber inputs which mostly encode for visual events to the right of the fovea produce movements of the eyes toward the left 20. Thus, the encoding of the sensory space by the climbing fiber input to a P-cell may play a critical role in defining the downstream effects that the SSs of that P-cell have on behavior.
To examine this idea, we relied on the fact that the climbing fiber input to a P-cell not only produces a CS that provides it information about the sensory event 5,21, but also briefly suppresses the SSs. In the oculomotor region of the vermis, each climbing fiber preferentially encodes a particular part of the visual space, but the SSs are similarly modulated for all saccades 22,23 (Figure S1). Occasionally, a CS occurs before a saccade, suppressing the SSs that the P-cell would normally produce during that movement 24,25. This allowed us to quantify the relationship between the sensory encoding of the visual space in the climbing fiber input to a P-cell, and the motor consequences of that P-cell’s SS suppression. The resulting sensorimotor map revealed an alignment: the preferred region of the sensory space, as encoded by the climbing fiber input to a P-cell, was aligned with the direction of force that was produced followed suppression of the SSs of that P-cell.
Results
To quantify the encoding of the visual space by the climbing fiber input to a P-cell, we trained marmosets 26 to fixate a central location and presented a primary target at one of eight random directions (Figure 1A-B). As the primary saccade commenced, we moved the target to another random location, instructing the subject to make a secondary saccade (Figure 1A-B). Following a 200 ms fixation period, the center target was re-displayed, and the subject made a center saccade to begin another trial.
Figure 1. Complex spikes respond to sensory events as well as movements.

A. Marmosets fixated a center target and made a saccade to a randomly located primary target. During the primary saccade the target was moved to another random location, resulting in a secondary saccade. H: horizontal, V: vertical component of the saccade. B. Eye position traces for the primary (blue) and secondary (red) saccades. C. CS response aligned to the onset of the primary target, and the onset of the saccade. Gray trace is eye velocity. CS-on was defined as the direction in which during the 200 ms after target onset there was the largest increase in CS rates (see STAR Methods). D. Left plot: CS probability in the 100 ms bin before saccade onset with respect to CS-on. Right: the distribution of CS-on directions across the P-cells. E. Simple spikes were aligned on saccade onset and ordered by timing of the CS. This P-cell exhibited a burst of SS activity near saccade onset, but occurrence of a CS briefly suppressed that modulation. F. Extracellular recording from an example P-cell: the CS suppresses the SS for about 10 ms. G. Trajectories in velocity space for a subset of the primary saccades (4 directions are shown). Some saccades were preceded by a complex spike (green). The CS-on vector indicates the target direction that produced the largest increase in CS rates. Shaded areas are SEM. See also Figure S1.
We recorded activities of n=424 P-cells in lobules VI and VII of the cerebellar vermis in 162 recording sessions over the course of 2.5 years in two marmosets (291 P-cells in subject M, 133 P-cells in subject R). In every case, we identified the neuron as a P-cell because of the presence of CSs. In n=281 P-cells we were able to isolate both the CSs and the SSs and verified that the CS suppressed the SS. In 59 recording sessions we were able to simultaneously isolate two or more P-cells, allowing us to examine the effects of simultaneous CSs on behavior.
Presentation of the target affected the CS firing rates (Figure 1C). For each P-cell we estimated the target direction that produced the largest increase in CS rates (STAR Methods) and labeled it as CS-on (Figure 1C-D). The lowest response was, on average, in direction CS+180 (we defined baseline rates during the fixation period) (Figure 1D, left subplot). As many of our recordings were from the right side of the vermis (152 P-cells recorded from the right vermis, 217 from the medial vermis, 55 from the left vermis), the distribution of CS-on directions across the P-cells was biased toward the left side 22,24 (Figure 1D, right subplot).
Sometimes the CS occurred just before the onset of a saccade (Figure 1C). This event briefly suppressed the SSs that the P-cell would normally produce during that movement (Figure 1E-F, Figure S1). To quantify the effects of SS suppression on behavior, we compared saccade trajectories that were toward a given target with and without a CS. That is, we compared saccades for which at least one CS occurred during the −90 to +10 ms period with respect to movement onset (Figure 1G, with CS), with saccades that were free of a CS during the same period (Figure 1G, without CS). We focused on the saccades made from center to the primary target because these saccades started from the same location and were in response to the same target.
As expected, following a CS in the −90 to +10 ms period with respect to saccade onset, the SS production of the P-cell was suppressed (Figure 2A, left subplot). In this figure, the SS suppression is not to zero because the CS could occur at any time during the 100 ms period. As a result, pooling across all CS events muted the resulting average SS suppression, but as confirmation we aligned the data to the onset of the CS, and indeed found that the SS production was suppressed (Figure 2A, right subplot).
Figure 2. A CS suppresses the P-cell’s SS, pulling the eyes in direction CS-on.

A. Left: for each P-cell, the SS activity was aligned to saccade onset and grouped based on whether the P-cell had a CS in the 100 ms interval around saccade onset (yellow marker) or not. See Figure S1 for a more detailed analysis. Right plot: same data aligned to CS onset. B. Left: CS-induced change in saccade trajectory (sequence of velocity vectors), as projected onto the CS-on and CS+90 vectors of each P-cell. 95% CI refers to the bootstrap estimate of the confidence interval. Right: data from the subset of recordings in which two or more P-cells were isolated and either one or two CSs were present in the −90 to +10 ms period around saccade onset. The inset here and in (D) illustrate two saccades in velocity space. C. Distribution of inter-spike intervals between the two CSs that were recorded in the simultaneous P-cells in the −90 to +10 ms period with respect to saccade onset. D. When the target was in direction CS-on of the P-cell, a CS resulted in a slightly faster movement. When the target was in direction CS+180, a CS resulted in a slightly slower movement. Error bars are SEM. 95% CI refers to the bootstrap estimate of the confidence interval for the effects of random splitting of the two groups on changes in saccade peak speed. Shaded areas are SEM or 95% CI. See also Figures S1, S2 and S4.
Suppression of the simple spikes pulled the eyes in direction CS-on
We separated saccades into those that were preceded by a CS in the −90 to +10 ms period, and those that were not. We represented a saccade’s trajectory as a time sequence of velocity vectors and then computed average of this time sequence across all with-CS saccades, minus the time sequence averaged across all without-CS saccades, for each target. This produced a sequence of vectors that described the CS induced change in velocity at each instant of time during the movement to a target. To test the hypothesis that the sensory CS-on space defined the motor output, we then projected this sequence of vectors onto an orthonormal coordinate system: the CS-on and the CS+90 vectors of that P-cell. The resulting projection produced two scalar quantities as a function of time: one quantity measured the deviation of the saccade in direction CS-on, and then other quantity measured the deviation in direction CS+90. We then averaged each of these two quantities across target directions for that P-cell, and then across all P-cells. This analysis revealed that the SS suppression altered the saccade precisely in direction CS-on, as there were no changes in direction CS+90 (Figure 2B, left subplot).
The peak of the trajectory perturbation was only about 5 deg/s, which is two orders of magnitude smaller than the peak speed of the saccade (Figure 1G), around 1% of the movement itself. This appears reasonable because the SS suppression that a CS causes is so short-lived (around 10 ms) that typically, it would remove only one or two SS spikes that would have been produced by the P-cell during the movement. To test for statistical reliability, we performed a bootstrapping procedure in which for each P-cell, and for each direction, we randomly split the saccades into two groups (rather than based on the occurrence of a CS) while keeping the ratio of saccade numbers as in the non-random split. We then projected the difference between the two groups of saccades onto the CS-on of that P-cell and from the resulting distribution computed the 95% confidence interval (CI). This revealed that if a CS was present around saccade onset, then the saccade’s trajectory deviated in direction CS-on by an amount that was 4.5 times larger than the 95% CI (Figure 2B, left subplot).
Multiple complex spikes in nearby P-cells magnified the perturbation
We next focused on the n=59 sessions in which we were able to simultaneously isolate two or more P-cells. In each dataset we selected only the P-cells that had a similar CS-on, i.e., the P-cells in which the CS-on directions fell within the same 45 deg bin (see STAR Methods). We then considered saccades in which none of the simultaneously recorded P-cells had a CS in the −90 to +10 ms period before saccade onset, saccades in which only one P-cell had a CS, and saccades in which two or more P-cells had a CS. This allowed us to quantify the behavioral effects of multiple CSs.
The presence of two CSs dramatically increased the trajectory deviation, more than tripling the pull in direction CS-on, as compared to a single CS (Figure 2B, right subplot). Notably, the effect of multiple CSs on the saccade’s trajectory in direction CS+90 remained smaller than in direction CS-on (whereby projection in direction CS+90 was within the 95% CI, Figure S2A, left subplot). The CS inter-spike interval (ISI) in the simultaneously recorded P-cells had an exponential distribution with a median of 15 ms (Figure 2C), implying that most of the CS events were synchronous. However, splitting the data based on CS ISI did not significantly affect the results (Figure S2A, right subplot).
In summary, the presence of a CS near saccade pulled the eyes in direction CS-on of the P-cell. This effect more than tripled if the CSs were present in two or more simultaneously recorded P-cells that had a similar CS-on.
The CS-induced effect depended on the direction of the movement
If the target is in direction CS-on of the P-cell, then the CS induced SS suppression in that P-cell should pull the eyes toward that target. This should produce a slightly greater peak speed than saccades that made toward the same target but without a preceding CS. In contrast, if the target happens to be in direction CS+180 of the P-cell, then the presence of a CS in that P-cell should pull the eyes in the opposite direction, thus slowing the saccade.
To examine these predictions, we separated the saccades based on the direction of the target with respect to CS-on. When a saccade was toward a target in direction CS-on of the P-cell, then that saccade had a greater peak speed if the CS was present before saccade onset as compared to when it was absent. In contrast, if the saccade was in direction CS+180, presence of a CS produced a saccade that had a lower peak speed (peak-speed difference between CS-on and CS+180 is ~13 deg/s, both values are with p<0.01, Figure 2D). Thus, SS suppression pulled the eyes in direction CS-on of the P-cell.
Control studies
If the SS suppression is necessary for pulling the eyes in direction CS-on, then a CS that occurs before a saccade but does not disrupt the saccade-related SS modulation should not affect the saccade’s trajectory. We considered CSs that occurred in the period just before the onset of SS modulation, i.e., the period −190 to −90 ms before saccade onset. These early CSs suppressed the SSs that were present during fixation, but not the SSs that were present before saccade onset (Figure 3A, left subplot). The saccades that followed these early CSs did not show a robust change in any direction (Figure 3B, −190 to −90 ms period, values are within 95%CI of bootstrap analysis). Similarly, CSs that occurred late in the saccade’s trajectory (Figure 3A right subplot, +10 to +40 ms after saccade onset) had no effect on the saccade (Figure 3B). A more fine-grained analysis (20 ms time bins) showed a similar pattern (Figure S2B).
Figure 3. CS-on vector is an unbiased estimator of the downstream effect of SS suppression.

A. Left: the effect of a CS that occurred −90 to −190 ms before saccade onset. Right: the effect a CS that occurred +10 to +40 ms after saccade onset. B. The effect of the timing of the CS on saccade trajectory. Neither the early nor the late CSs had a significant effect on the saccade. C. Primary saccade starting points did not differ between with- and without-CS saccades when projected on the CS-on vector. D. Angular distance between the CS-on direction of a P-cell, and the unit vector that maximized the projection of the CS-induced change in saccade trajectory (that unit vector was labeled as the “maximum” vector). The diagram on the right shows the trajectories of two saccades in velocity space, and the maximum vector. E. Projection of the CS-induced change in saccade trajectory onto the maximum vector. The 95% CI indicates the effect size due to random noise. Compare the 95% CI here with Figure 2B. Thus, CS-on is both an unbiased and a low-noise estimate of the direction of CS-induced perturbation. Error bars and shaded areas are SEM or 95% CI. See also Figure S2.
Our comparison of saccades with and without a CS required that the starting point of the two saccades be the same. The difference in the starting points of the with-CS and without-CS saccades was near zero and well within the 95% CI (Figure 3C). Difference in the saccade end points, on the other hand, were significantly in direction CS-on (Figure 3C, p<0.001 as measured by a bootstrapping procedure). The effects on amplitude and saccade endpoint remained robust to the small changes in saccade starting position (Figure S2C).
Is the CS-on vector a good estimate of the direction of perturbation?
We do not know if CS-on is the best coordinate system that we could have chosen for each P-cell. To answer this question, for each P-cell we defined a new coordinate system by empirically finding the unit vector that maximized the projection of the CS-induced trajectory change at peak velocity. For example, the right side of Figure 3D shows a saccade’s trajectory in velocity space with and without a preceding CS. We can compare the two trajectories at peak speed and compute the difference in the two velocity vectors. Let us label this difference, as measured across all saccades, as the vector that maximizes the CS-induced disturbance.
For each P-cell, we compared the maximum vector with the CS-on vector that we had measured for that cell. The distribution of the angular difference is shown in Figure 3D. The CS-on vector was an unbiased estimator of the optimal vector. However, for many P-cells, the maximum vector was 90° or more apart from CS-on. Indeed, when the difference in the with- and without-CS saccades were projected onto the maximum vector of each P-cell, the results produced a larger trajectory change (Figure 3E, maximal trace) than what we had measured when the data were projected onto CS-on (Figure 2A). Is the maximum vector a better coordinate system with which to measure the CS-induced change in the saccade?
To answer this question, we separated the saccades randomly into two groups (i.e., not based on whether there was a CS or not). The bootstrap analysis produced a 95% confidence interval, effectively estimating the size of the noise associated with the maximum vector (Figure 3E, 95% CI). For the maximum vector, the distance of the effect size to noise was much smaller (1.5 deg/s at peak velocity) than the distance as measured for the CS-on vector (4.5 deg/s at peak velocity). Thus, the CS-on vector was both an unbiased and a robust estimate of the direction in which the CS had perturbed the saccade.
Is the CS causing a perturbation, or merely correlated with a change in the saccade’s trajectory?
The alternate hypothesis is that in those trials in which there was a CS before saccade onset, the subject happened to plan its movement to a position that was slightly biased toward direction CS-on of the recorded P-cell. Can we distinguish between the ‘perturbation’ and the ‘planning’ viewpoints? To do so, we first asked whether the CS activity before saccade onset carried information about the direction and amplitude of the impending movement, and then used that information to make predictions that could establish whether CS was causally affecting the movement, or merely correlated with the change.
In principle, the CS activity should carry information about the ensuing saccade because the olivary input to the oculomotor vermis transmits in part the activity of neurons in the superior colliculus 27–29. Collicular neurons, particularly those in the intermediate layers, can have a burst of activity in response to a visual stimulus, and then a second burst to instruct a gaze change toward that stimulus 30–32. Indeed, following presentation of a target, the CS firing rates (in direction CS-on) exhibited two peaks (Fig 1D). This raised the possibility that the first CS peak was encoding the location of the visual stimulus, while the second peak was an encoding the instruction to move to that location. Of course, in most cases the externally instructed goal and the internally selected movement were the same. However, there were instances in which we presented a visual target but the subject chose to make a saccade elsewhere. We termed these incorrect saccades (Figure 4A).
Figure 4. CSs convey information about the target location as well as the intended movement.

A. In these saccades, we presented the subject with a visual stimulus, but the subject chose not to make a saccade toward it. At 30–130 ms following stimulus onset, the CS response was tuned to the direction of the target, not the direction of the eventual saccade. At 100 ms before saccade onset, the CS response was tuned to the direction of the upcoming saccade, not the direction of the target. B. Average firing rates for CS-on (which includes CS±45) versus CS+180 (which includes CS±135) showed higher response for CS-on visual target and higher response prior to movements in direction CS-on. C-D. For incorrect saccades, as well as back to center saccades, regardless of saccade direction the CS response at 100 ms before saccade onset was larger if the upcoming movement had a smaller amplitude. Shaded areas are SEM. See also Figure S3.
For the incorrect saccades, the CS response that followed the onset of the visual target (30–130 ms period) showed a tuning that was aligned to the direction of the target with respect to CS-on (Figure 4A-B, left subplots), but no tuning when aligned to the direction of the actual saccade. That is, the initial CS response encoded the visual stimulus, not the saccade that would eventually be made. On the other hand, the CS response that preceded the movement (−100 to 0 ms) was no longer tuned to the direction of the instructed target (Figure 4A, right subplot). Rather, it was tuned to the actual saccade direction with respect to CS-on (Figure 4A-B, right subplots). This tuning is unlikely to result from a perturbation of the saccades to move in direction CS-on which shifts the CS tuning, as simulations we performed showed that the magnitude of the observed tuning (which shows >10% deviation from baseline) is too large to result from perturbations on the order of 1% (Figure S3A-B).
Thus, the CS activity following target onset reflected the location of the stimulus and not the eventual movement. In contrast, the CS activity before saccade onset encoded the direction of the movement and not the stimulus that instructed it. (For incorrect saccades the time between visual target onset and saccade onset was 350±360ms, whereas for primary saccades it was 195±93ms).
Critically, we found that the CS activity before saccade onset reflected not just the direction of the ensuing saccade, but also grossly the amplitude of that movement. For all directions of movement, the CS probability preceding small amplitude saccades (<3.5 deg) increased by about 10% relative to larger amplitude saccades (Figure 4C). We found similar results for back-to-center saccades (Figure 4D). These results are consistent with prior findings that low amplitude visual targets have a higher probability of eliciting a complex spike than high amplitude visual targets 10,33.
We are now able to formulate the “planning” hypothesis. According to the planning hypothesis, the CS does not perturb the saccade. Rather, it merely conveys information about the upcoming movement. The CS rate in each P-cell will be greater when the ensuing movement direction is closer to the CS-on direction of that P-cell, and the CS rates will be greater when the movement has a smaller amplitude (Figure 4C-D). Moreover, regardless of movement direction, presence of a CS should signal a smaller amplitude movement (Figure 5A, left panel, red marks).
Figure 5. Comparing the perturbation hypothesis with the planning hypothesis.

A. Left: predictions of the two hypotheses. Right: the measured data. The presence of a CS had a direction dependent effect on saccade amplitude, consistent with the predictions of the perturbation hypothesis. B. Projection of the CS induced changes in peak velocity (left subplot) and in final saccade position (right subplot) on the CS-on vector. Perturbation of movements in directions CS-on and CS+180 are larger than perturbation of movements in directions CS±90. C. For P-cells whose CS-on angle is along the diagonal axes the perturbation is strongest when it is projected on the CS-on vector, weaker when projected on the CS±45 vectors. D-E. Hypothetical diagrams showing the sensorimotor map of a P-cell whose CS-on is at 45 deg. If the downstream nucleus neuron projects onto burst generators, then that projection must be to both vertical and horizontal burst generators. If the nucleus neuron projects to the superior colliculus, then that projection should be to the same region that provides CS information to the P-cell. The tuning of fastigial nucleus is yet to be explored. Shaded areas are SEM or 95% CI. See also Figure S3.
In contrast, the perturbation hypothesis makes a different prediction: because the presence of a CS will always pull the eyes in direction CS-on, the effect of the CS will be direction dependent (Figure 5A, left panel, black dots). If the target is in direction CS-on and there is a CS, then the saccade will have a slightly larger amplitude (with respect to no CS). However, if the target is in direction CS+180, then the effect of the CS will be to produce a slightly smaller amplitude.
Indeed, when the target was in direction CS-on, the presence of a CS was followed by a slightly larger saccade, and if the target was in direction CS+180, then the presence of a CS was followed by a slightly smaller saccade (Figure 5A, right panel; amplitude difference between CS-on and CS+180 is ~0.08 deg, both values are with p<0.01 as measure by a bootstrapping procedure). These results agree with the predictions of the perturbation hypothesis but not the planning hypothesis.
In summary, the CS rates before saccade onset carried information about the direction and amplitude of the upcoming movement. This raised the possibility that the presence of a CS merely signaled that the movement would be closer to the preferred direction of the P-cell. However, we were able to dissociate the planning hypothesis from the perturbation hypothesis, finding that the CS induced suppression of SS produced a genuine disruption of the movement, pulling the eyes toward direction CS-on of the P-cell.
Is the output of the P-cell aligned with muscle coordinates or visual coordinates?
Downstream of the superior colliculus are the burst generator neurons that activate the motor neurons and drive the eye muscles. However, the coordinate system of the superior colliculus is very different from the burst generators: the tuning functions of both the burst generator neurons and the motor neurons are along the vertical and the horizontal axes (Figure 5D) 34–38, reflecting the axes of eye muscles, not the polar coordinates of the visual space in the superior colliculus. CS tuning of P-cells, on the other hand, reflects a polar coordinate system, similar to neurons in the superior colliculus. This difference between the sensory and motor spaces allowed us to ask a new question: do P-cells with CS-on along the diagonal axes, which are not aligned with burst generator neurons, drive movement in the direction of their CS-on, or along the tuning of the downstream burst generator neurons (i.e., in the CS-on±45 direction)? Is the output of the P-cells in sensory coordinates of the superior colliculus, or the motor coordinates of the burst generators?
To answer this question, we projected the velocity difference between with- and without-CS saccades on the CS-on, CS+90, and CS±45 vectors but just for cells whose CS-on was along the diagonal axes. We found that, on average, the strongest perturbation was in direction CS-on (Figure 5C). Furthermore, we repeated the analysis of Figure 2D and Figure 5A, analyzing differences in peek speed and saccade amplitude between with- and without-CS saccades for the different direction movements, but now just for cells whose CS-on is along the diagonal axes. We again found that the largest difference in speed and saccade amplitude was in direction CS-on while the smallest difference in speed and saccade amplitude was in direction CS-180 (Figure S3C).
In summary, when we focused exclusively on the P-cells that had a CS-on along the diagonal axis, i.e., the axis that is different than the horizontal and vertical axes present in the burst generators and motoneurons, the effect of the CS was to pull the eyes along the same diagonal axis, not along the horizontal or vertical axes. This implies that on average, the downstream effect of a P-cell is to drive a movement in the direction specified by the inferior olive, even when that direction is not aligned with the coordinates of any single muscle. Thus, the output of the P-cells in this region of the cerebellum is better aligned with the sensory coordinates of the superior colliculus than the muscle space of the burst generators and motoneurons.
Discussion
It is difficult to infer the relationship between the SSs that a P-cell is generating and its downstream effects on behavior. Here, we found that the information in the climbing fiber input provides a critical clue. On the one hand, a climbing fiber input to a P-cell in the oculomotor vermis encodes a specific region of the visual space, producing a CS that signals that a visual event has taken place around that location. On the other hand, when the CS occurs near saccade onset, it suppresses the SSs, pulling the eyes toward the same region of the visual space. This implies that the sensorimotor map of a P-cell is defined by its climbing fiber input.
If our interpretation is correct, then the results partially explain what is encoded by the SS activities of P-cells during a saccade. In both macaques and marmosets, when a saccade is made in direction CS+180, the population SS rate initially exhibits a burst but then falls below baseline just as the movement begins to decelerate 22,24. From the current results we infer that the SS suppression is signaling the downstream motor structures to produce forces in direction CS-on, which would oppose the ongoing movement, bringing it to a stop. The fact that during reaching in mice there is a similar burst-pause pattern as the paw begins to decelerate 39 hints that during voluntary movements, the cerebellum is computing a command that ultimately stops the ongoing movement. Moreover, because P-cells that are located on one side of the vermis tend to have a CS-on direction that is biased toward the contralateral side 24, our results suggest an explanation as to why a unilateral lesion of the cerebellum produces hypermetric saccades in only the contralateral direction 40–43.
Mechanism of the perturbation by a complex spike
We interpreted the effects that the CS had on behavior to be due to SS suppression, which results in the disinhibition of the nucleus neuron, making it burst 44. However, there are other possibilities. For example, the CS itself is a spike that is transmitted down the P-cell’s axon 45,46. Notably, the downstream effect on the nucleus neuron is inhibition, particularly when the CSs are synchronized among the P-cells 47–50. The increased inhibition of the nucleus, for example via stimulation of P-cells, tends to drive the eyes opposite to the direction of CS-on 51. Another possibility is that an inferior olive neuron that sends a climbing fiber to a P-cell also sends collaterals to the cerebellar nucleus neuron that receives input from the same P-cell 44,52,53. If this is indeed the case 49, then the olive can directly activate the nucleus, potentially bypassing the need to suppress the P-cell’s SSs. However, the olivary inputs to nucleus neurons tend to be weak, at least in the adult mouse 54,55.
Our main analysis focused on the effects that a single P-cell had on behavior 23,56. However, because CS activity is often synchronized across P-cells 15, it seems likely that our behavioral results are due to SS suppression among a population of P-cells. In support of this, we found that the perturbation by a CS did not depend on the SS modulation of the recorded cell. The perturbation occurred whether the CS was in a cell that increased (‘burst’) or decreased (‘pause’) its SS modulation during saccade (Figure S4A). Moreover, the perturbation effect was similar regardless of the strength of the CS saccade modulation (Figure S4B). We further observed that near synchronous CSs dramatically increased the magnitude of the pull on the eyes, implying that a larger population of P-cells is experiencing SS suppression, thus making them ‘pull together’.
If SS suppression instructs the motor structures to pull the eyes, then trials with reduced SS rate (regardless of the occurrence of a CS) should result in changes to the saccade trajectory. This is a difficult prediction to test because the peak velocity of the saccade is linearly correlated with the burst component of the SS rate, and thus a reduction in SS rate modulation naturally coincides with a reduction in movement vigor (Figure S4C). But across saccade amplitudes and peak velocities, the pause appears time-aligned with the onset of deceleration 24. It is noteworthy that similar to saccades, during reaching, as peak velocity increases, the pause in the SS rate becomes deeper 39, presumably signaling the nucleus to fire more strongly and stop the ongoing movement.
The functional role of complex spikes
A central idea in cerebellar research is that the CS is a teaching signal for the P-cell 56–59. Indeed, when a saccade ends and the target is not on the fovea, the resulting visual error modulates CS probability 22,33, inducing learning which is then expressed through modification of the SSs during the subsequent movement 23. Our results here imply that if the visual error produced an increase in the CS probability of a P-cell, then the subsequent reduction in that P-cell’s SSs has a specific meaning: the motor system is instructed to pull the eyes in the direction of the error vector, thus reducing that error.
However, CSs occur not just in response to error, but also before and during movements 11,13,15,25,60–62. Critically, CSs occur before movement onset even when there are no sensory events that triggered that movement 12. Here we found that CSs that occurred before a saccade carried information about the internally selected direction of the movement, not the visually instructed direction. What might be the purpose of a CS that does not signal an external event or an error?
As pointed out by Bouvier et al. 63, a general learning system cannot rely solely on a teacher to provide it with information regarding how to correct an error. Indeed, for many cerebellar-dependent behaviors, the cerebellum is not afforded the luxury of a teacher 14. In theory, an effective solution for the cerebellum would be to have a way to stochastically perturb the movement, produce a change in behavior, then evaluate that change to determine its utility 63. Our results provide evidence that at least part of this mechanism may be employed by the cerebellum: CSs that occur near the onset of a saccade perturb that movement. However, the effect size that we observed was small, altering saccade trajectory by adding a vector that was 1% of the peak velocity of the movement. This effect size tripled when multiple cells fired a CS. Thus, the olivary input to the cerebellum can stochastically alter movements, particularly by synchronizing this input among the P-cells. In theory, the purpose of these complex spikes may be to induce stochastic learning without a teacher.
Generalizing to other cerebellar circuits
The eyes have a small mass that may be more easily perturbed than other parts of the motor system, raising the question of whether our results can generalize to other movements. An important clue is the work of Streng et al. 64 who trained macaques in a reaching task and found that the occurrence of a CS during a reach was correlated with a subsequent motion of the hand. Thus, as in our findings here, the CS was not reporting an error, but rather causing a change in the movement. A critical question for future research is whether these perturbations are part of the stochastic gradient descent toolbox that may be employed by the olive to teach the cerebellum 63.
The coordinate system of the P-cell output
Our results suggest that the sensory representation of space in the climbing fiber is transformed by a P-cell into a movement in the same direction. How might this transformation take place? One possibility is that in the oculomotor vermis, a P-cell connects to a fastigial neuron that projects to the superior colliculus region 65 that forms the input to the olivary cell that innervates the same P-cell (Figure 5E). In this way, all P-cells, including those that have a diagonal CS-on, can influence actions that match their olivary input. Another possibility is that the nucleus neuron projects to both horizontal and vertical burst generators in such a way that it can produce movements along a direction that matches the CS-on vector of the parent P-cell (Figure 5D).
Our results do not dissociate between these two possibilities, yet, we think that one fact is more consistent with the idea that the downstream behavioral effects of a P-cell is via the superior colliculus (Fig. 5E): the SS suppression lengthened the saccade when it was directed toward a target in direction CS-on, shortened it when it was directed toward a target in direction CS+180, but had little or no consequence when the saccade was directed towards a target in direction CS+90 (Fig. 5B). If these effects are mediated principally via the burst generators (Fig. 5D), then one might imagine that the consequence of SS suppression will be a deviation of the saccade by the same amount regardless of the target direction.
While P-cells in the oculomotor vermis have a CS tuning that reflects the visual map of the colliculus, in the flocculus as well as the C3 zone of the cat cerebellum 4,66 the CS tuning is thought to reflect the motor map of the muscles. In the flocculus, the SS response is aligned to a Cartesian coordinate system with cells tuned mostly to right/left and up/down smooth-pursuit movements 67. CS tuning for these cells is inversely aligned with the SS tuning 68. What may underlie the difference in the CS tuning of these two cerebellar structures? The flocculus P-cells are one synapse away from eye motor neurons (with the vestibular nuclei separating them), whereas vermis P-cells are 2 or 3 synapses away (with the fastigial nucleus, superior colliculus, and burst generator neurons separating them). Thus, the added neuronal layers from the vermis to motoneurons may enable the transformation from the vermis polar coordinate system to the motor neuron Cartesian coordinate system.
STAR Methods
Resource availability
Lead contact
Further information and requests for data should be directed to and will be fulfilled by the lead contact, Salomon Muller (szm2106@columbia.edu).
Materials availability
This study did not generate new unique materials.
Data and code availability
The source data to reproduce the figures has been deposited at Mendeley Data. The DOI is listed in the key resources table.
Analysis code has been deposited at Mendeley Data. The DOI is listed in the key resources table.
Any additional information required to reanalyze the data reported in this paper is available from the lead contact upon request.
Key resources table
| REAGENT or RESOURCE | SOURCE | IDENTIFIER |
|---|---|---|
| Antibodies | ||
| Bacterial and virus strains | ||
| Biological samples | ||
| Chemicals, peptides, and recombinant proteins | ||
| Critical commercial assays | ||
| Deposited data | ||
| Raw and analyzed data | This paper and Sedaghat-Nejad et al. 202224; Mendeley Data | https://doi.org/10.17632/pkt982nxtg.1 |
| Experimental models: Cell lines | ||
| Experimental models: Organisms/strains | ||
| Marmoset monkeys (Callithrix Jacchus, male and female, 350–370 g, 6 years old at start of recordings) | Born and raised in a colony that Prof. Xiaoqin Wang has maintained at the Johns Hopkins School of Medicine since 1996 | N/A |
| Oligonucleotides | ||
| Recombinant DNA | ||
| Software and algorithms | ||
| OpenEphys | Siegle et al. 201770 | |
| P-sort | Sedaghat-Nejad et al. 202171 | |
| Kilosort and Phi | Pachitariu et al. 201672 | |
| MATLAB | MathWorks | https://www.mathworks.com |
| Other | ||
Experimental model and subject details
We collected out data from two marmoset monkeys over the course of 2.5 years (Callithrix Jacchus, male and female, 350–370 g, subjects M and R, 6 years old at start of recordings). The marmosets were born and raised in a colony that Prof. Xiaoqin Wang has maintained at the Johns Hopkins School of Medicine since 1996. The procedures on the marmosets were approved by the Johns Hopkins University Animal Care and Use Committee in compliance with the guidelines of the United States National Institutes of Health.
Method details
Electrophysiology and data acquisition
Following recovery from head-post implantation surgery, the animals were trained to make saccades to visual targets and rewarded with a mixture of applesauce and lab diet 26,69. Visual targets were presented on an LCD screen (Curved MSI 32” 144 Hz - model AG32CQ) while binocular eye movements were tracked using an EyeLink-1000 eye tracking system (SR Research, USA). Timing of target presentations on the video screen was measured using a photo diode. We performed MRI and CT imaging on each animal and used the imaging data to design an alignment system that defined trajectories from the burr hole to various locations in the cerebellar vermis 26, including points in lobule VI and VII. We used a piezoelectric, high precision micro drive (0.5 micron resolution) with an integrated absolute encoder (M3-LA-3.4–15 New Scale Technologies) to advance the electrode. We recorded from the cerebellum using quartz insulated 4 fiber (tetrode) or 7 fiber (heptode) metal core (platinum/tungsten 95/05) electrodes (Thomas Recording), and 64 channel checkerboard or linear high density silicon probes (M1 and M2 probes, Cambridge Neurotech). We connected each electrode to a 32 or 64 channel head stage amplifier and digitizer (RHD2132 and RHD2164, Intan Technologies, USA), and then connected the head stage to a communication system (RHD2000 Evaluation Board, Intan Technologies, USA). Data were sampled at 30 kHz and band-pass filtered (2.5 – 7.6 kHz). The simple spikes in a part of this data set were analyzed and reported previously 24.
Behavioral protocol
Each trial began with fixation of a center target for 200 ms, after which a primary target (0.5×0.5 deg square) appeared at one of 8 randomly selected directions at 5–6.5 deg (50 cells were recorded during sessions with 4 random directions). The onset of the primary target coincided with presentation of a distinct tone. As the subject made a saccade to this primary target, that target was erased, and a secondary target was presented at a displacement of 2–2.5 deg, also at one of 8 randomly selected directions (4 directions for 50 cells). Following 200 ms fixation of the final target, reward was presented with a distinct tone, and the center target was displayed.
Data analysis
All saccades, regardless of whether they were instructed by presentation of a visual target or not, were identified in the behavioral data using a velocity threshold.
Simple and complex spike baseline firing rates were computed by dividing the total number of spikes by the duration of the fixation time when simple and complex spikes were not modulated. Simple and complex spike instantaneous firing rate were calculated from peri-event time histograms with 1 ms bin size. CS and SS rates were smoothed with a 20 ms Gaussian kernel.
Computing the CS-on vector:
CS directional tuning was computed by measuring the CS firing rates following target onset as a function of target angle with respect to the actual position of the eyes. We counted the number of CS after target onset up to saccade onset or a fixed 200 ms window, whichever happened first. Dividing the spike count by the duration of time resulted in the CS firing rate. We then weighed the vectors pointing to the target by their firing rates and summed them. We defined the angle of the resulting vector as the CS-on angle
Rounding CS-on angle:
We rounded the CS-on to the nearest 45 deg angle and thus classified cells as having the same CS-on if their rounded CS-on angle was the same. Thus, for the population analysis of Figure 2B this criterion produced 35 sessions that we had two P-cells, 6 sessions with three P-cells, 8 sessions with four P-cells, 5 sessions with five P-cells, 2 sessions with six P-cells, 2 sessions with seven P-cells, and 1 session with eight P-cells that had the same CS-on (total of 179 P-cells)
Rounding movement directions:
Similarly, for defining movement directions as belonging to one of 8 directions we rounded the movements to the nearest 45 deg angle. We defined a movement direction based on the starting point and target end point. However, when analyzing distributions based on actual saccade directions (Figure 4) we defined movement direction based on the starting point and actual end point.
Using weighted sum:
To account for the fact that some cells were recorded for much longer period than other cells we used weighted sum across cells (weighted by the number of CSs in the relevant time window) for mean and SEM analyses. Similarly, to account for the fact that within cells some movement directions had many more CSs than other directions we used weighted sum when averaging across directions. Thus, the bootstrap analysis randomly separated the movements, but maintained the ratio of with-CS and without-CS saccades for each direction and each cell.
Vector projection:
Projection of a vector implies taking the dot product of the analyzed vector with a unit vector defining the CS-on, CS+90, CS±45 or the maximal vector.
Effect of saccade amplitude:
For separating saccades based on amplitude we defined 3.5 deg amplitude to be the threshold as it was close to the median. But we tested with varying thresholds and found that our results were not sensitive to the chosen threshold.
Comparing planning vs. perturbation hypotheses:
To construct the perturbation hypothesis of Figure 5A, we added to each direction a vector in a defined CS-on direction. We then calculated the change in amplitude of each vector caused by the addition of the CS-on vector. For the ‘planning hypothesis’ we just plotted all to be below zero as probability for a CS was larger for low amplitude saccades.
Normalizing for the differences in the saccade start point - Figure S2C:
We analyzed changes in saccade amplitude and projection of changes in saccade endpoint while normalizing for the differences in the saccade start point. We used the following to compute the CS induced change in saccade amplitude:, where and are the start and endpoint of the saccade, and is the end target location. The symbol indicates the expected value of the L2 norm of the vector 𝑥. Effectively, we first subtracted the instructed amplitude from the actual amplitude for each saccade, and then averaged this quantity for with- and for without CS-saccades and then subtracted the value for without-CS-saccades from the with-CS saccades. We then averaged this quantity across cells to compute the effect of the CS on the deviation of the saccade amplitude from the instructed saccade amplitude. Similarly, to compute the projection of changes in final saccade point we measured the following:, where indicates the transpose of the vector and is the CS-on unit vector.
Quantification and statistical analysis
Software used and general statistical methods
We used OpenEphys 70 for electrophysiology data acquisition, and then used P-sort 71 to identify the simple and complex spikes in the heptodes and tetrodes recordings, and Kilosort and Phi 72 to identify the spikes for the silicon probes. For data analysis we used custom Matlab code (Mathworks, Natick, MA).
To estimate the statistical significance of the data we used a bootstrapping method in which we randomly split the data into two groups, a fake CS group and a fake no-CS group. Importantly, we maintained the numbers in the groups as in the real splitting of the data. We then ran the analysis exactly as in for the real data 1000 times (with different random seeds) and extracted a 95% and a 99% confidence interval (CI). The statistic p<0.01 and p<0.05 mean that the real data were outside the 99% and 95% CI, respectively.
Supplementary Material
Highlights.
Complex spikes encode events in a specific region of the visuomotor space
Suppression of P-cell’s output by a complex spike pulls the eye in direction ‘CS-on’
Complex spike activity reflects stimulus location and movement direction
P-cell output is aligned with visual, rather than muscle, coordinates
Acknowledgements
The work was supported by grants from the NIH (R01-EB028156, R01-NS078311, R37), and the Office of Naval Research (N00014-15-1-2312). S.Z.M. was further supported by NSF NeuroNex award (1707398) and by the Gatsby and the Swartz Foundations.
Footnotes
Declaration of interests
The authors declare no competing interests.
Publisher's Disclaimer: This is a PDF file of an unedited manuscript that has been accepted for publication. As a service to our customers we are providing this early version of the manuscript. The manuscript will undergo copyediting, typesetting, and review of the resulting proof before it is published in its final form. Please note that during the production process errors may be discovered which could affect the content, and all legal disclaimers that apply to the journal pertain.
References
- 1.Sato Y, Miura A, Fushiki H, and Kawasaki T. (1992). Short-term modulation of cerebellar Purkinje cell activity after spontaneous climbing fiber input. J. Neurophysiol. 68, 2051–2062. 10.1152/jn.1992.68.6.2051. [DOI] [PubMed] [Google Scholar]
- 2.Thach WT (1967). Somatosensory receptive fields of single units in cat cerebellar cortex. J.Neurophysiol. 30, 675–696. 10.1152/jn.1967.30.4.675. [DOI] [PubMed] [Google Scholar]
- 3.Ruigrok TJH, and Voogd J. (2000). Organization of projections from the inferior olive to the cerebellar nuclei in the rat. J. Comp. Neurol. 426, 209–228. . [DOI] [PubMed] [Google Scholar]
- 4.Apps R, and Garwicz M. (2005). Anatomical and physiological foundations of cerebellar information processing. Nat.Rev.Neurosci. 6, 297–311. 10.1038/nrn1646. [DOI] [PubMed] [Google Scholar]
- 5.Ju C, Bosman LWJ, Hoogland TM, Velauthapillai A, Murugesan P, Warnaar P, Genderen RM van, Negrello M, and Zeeuw CID (2019). Neurons of the inferior olive respond to broad classes of sensory input while subject to homeostatic control. J. Physiol. 597, 2483–2514. 10.1113/JP277413. [DOI] [PMC free article] [PubMed] [Google Scholar]
- 6.Najafi F, Giovannucci A, Wang SS, and Medina JF (2014). Sensory-driven enhancement of calcium signals in individual Purkinje cell dendrites of awake mice. Cell Rep 6, 792–798. 10.1016/j.celrep.2014.02.001. [DOI] [PMC free article] [PubMed] [Google Scholar]
- 7.Soetedjo R, and Fuchs AF (2006). Complex spike activity of purkinje cells in the oculomotor vermis during behavioral adaptation of monkey saccades. J Neurosci 26, 7741–7755. [DOI] [PMC free article] [PubMed] [Google Scholar]
- 8.Ohmae S, and Medina JF (2015). Climbing fibers encode a temporal-difference prediction error during cerebellar learning in mice. Nat.Neurosci. 18, 1798–1803. 10.1038/nn.4167. [DOI] [PMC free article] [PubMed] [Google Scholar]
- 9.Bina L, Romano V, Hoogland TM, Bosman LWJ, and De Zeeuw CI (2021). Purkinje cells translate subjective salience into readiness to act and choice performance. Cell Rep. 37, 110116. 10.1016/j.celrep.2021.110116. [DOI] [PubMed] [Google Scholar]
- 10.Markanday A, Inoue J, Dicke PW, and Thier P. (2021). Cerebellar complex spikes multiplex complementary behavioral information. PLOS Biol. 19, e3001400. 10.1371/journal.pbio.3001400. [DOI] [PMC free article] [PubMed] [Google Scholar]
- 11.Hoogland TM, De Gruijl JR, Witter L, Canto CB, and De Zeeuw CI (2015). Role of Synchronous Activation of Cerebellar Purkinje Cell Ensembles in Multi-joint Movement Control. Curr. Biol. 25, 1157–1165. 10.1016/j.cub.2015.03.009. [DOI] [PMC free article] [PubMed] [Google Scholar]
- 12.Welsh JP, Lang EJ, Suglhara I, and Llinas R. (1995). Dynamic organization of motor control within the olivocerebellar system. Nature 374, 453–457. 10.1038/374453a0. [DOI] [PubMed] [Google Scholar]
- 13.Hewitt AL, Popa LS, and Ebner TJ (2015). Changes in Purkinje cell simple spike encoding of reach kinematics during adaption to a mechanical perturbation. J.Neurosci. 35, 1106–1124. 10.1523/JNEUROSCI.2579-14.2015. [DOI] [PMC free article] [PubMed] [Google Scholar]
- 14.Heffley W, Song EY, Xu Z, Taylor BN, Hughes MA, McKinney A, Joshua M, and Hull C. (2018). Coordinated cerebellar climbing fiber activity signals learned sensorimotor predictions. Nat. Neurosci. 21, 1431–1441. 10.1038/s41593-018-0228-8. [DOI] [PMC free article] [PubMed] [Google Scholar]
- 15.Wagner MJ, Savall J, Hernandez O, Mel G, Inan H, Rumyantsev O, Lecoq J, Kim TH, Li JZ, Ramakrishnan C, et al. (2021). A neural circuit state change underlying skilled movements. Cell 184, 3731–3747.e21. 10.1016/j.cell.2021.06.001. [DOI] [PMC free article] [PubMed] [Google Scholar]
- 16.Apps R, and Garwicz M. (2000). Precise matching of olivo-cortical divergence and cortico-nuclear convergence between somatotopically corresponding areas in the medial C1 and medial C3 zones of the paravermal cerebellum. Eur.J.Neurosci. 12, 205–214. 10.1046/j.1460-9568.2000.00897.x. [DOI] [PubMed] [Google Scholar]
- 17.Sugihara I, Fujita H, Na J, Quy PN, Li B-Y, and Ikeda D. (2009). Projection of reconstructed single purkinje cell axons in relation to the cortical and nuclear aldolase C compartments of the rat cerebellum. J. Comp. Neurol. 512, 282–304. 10.1002/cne.21889. [DOI] [PubMed] [Google Scholar]
- 18.Sugihara I. (2011). Compartmentalization of the Deep Cerebellar Nuclei Based on Afferent Projections and Aldolase C Expression. The Cerebellum 10, 449–463. 10.1007/s12311-010-0226-1. [DOI] [PubMed] [Google Scholar]
- 19.Ekerot CF, Jorntell H, and Garwicz M. (1995). Functional relation between corticonuclear input and movements evoked on microstimulation in cerebellar nucleus interpositus anterior in the cat. ExpBrain Res 106, 365–376. [DOI] [PubMed] [Google Scholar]
- 20.El-Shamayleh Y, Kojima Y, Soetedjo R, and Horwitz GD (2017). Selective Optogenetic Control of Purkinje Cells in Monkey Cerebellum. Neuron 95, 51–62.e4. 10.1016/j.neuron.2017.06.002. [DOI] [PMC free article] [PubMed] [Google Scholar]
- 21.Tsutsumi S, Chadney O, Yiu T-L, Bäumler E, Faraggiana L, Beau M, and Häusser M. (2020). Purkinje Cell Activity Determines the Timing of Sensory-Evoked Motor Initiation. Cell Rep. 33, 108537. 10.1016/j.celrep.2020.108537. [DOI] [PMC free article] [PubMed] [Google Scholar]
- 22.Herzfeld DJ, Kojima Y, Soetedjo R, and Shadmehr R. (2015). Encoding of action by the Purkinje cells of the cerebellum. Nature 526, 439–442. [DOI] [PMC free article] [PubMed] [Google Scholar]
- 23.Herzfeld DJ, Kojima Y, Soetedjo R, and Shadmehr R. (2018). Encoding of error and learning to correct that error by the Purkinje cells of the cerebellum. Nat.Neurosci. 21, 736–743. 10.1038/s41593-018-0136-y. [DOI] [PMC free article] [PubMed] [Google Scholar]
- 24.Sedaghat-Nejad E, Pi JS, Hage P, Fakharian MA, and Shadmehr R. (2022). Synchronous spiking of cerebellar Purkinje cells during control of movements. Proc. Natl. Acad. Sci. 119, e2118954119. 10.1073/pnas.2118954119. [DOI] [PMC free article] [PubMed] [Google Scholar]
- 25.Pi JS, Sedaghat-Nejad E, Fakharian MA, Hage P, and Shadmehr R. (2022). Signaling the agency of an erroneous outcome via synchronization of spikes in the cerebellum. 2022.07.11.499614. 10.1101/2022.07.11.499614. [DOI] [Google Scholar]
- 26.Sedaghat-Nejad E, Herzfeld DJ, Hage P, Karbasi K, Palin T, Wang X, and Shadmehr R. (2019). Behavioral training of marmosets and electrophysiological recording from the cerebellum. J.Neurophysiol. 122, 1502–1517. [DOI] [PMC free article] [PubMed] [Google Scholar]
- 27.Soetedjo R, Fuchs AF, and Kojima Y. (2009). Subthreshold activation of the superior colliculus drives saccade motor learning. J.Neurosci. 29, 15213–15222. 10.1523/JNEUROSCI.4296-09.2009. [DOI] [PMC free article] [PubMed] [Google Scholar]
- 28.Soetedjo R, Kojima Y, and Fuchs AF (2019). How cerebellar motor learning keeps saccades accurate. J. Neurophysiol. 121, 2153–2162. 10.1152/jn.00781.2018. [DOI] [PMC free article] [PubMed] [Google Scholar]
- 29.Kojima Y, and Soetedjo R. (2018). Elimination of the error signal in the superior colliculus impairs saccade motor learning. Proc.Natl.Acad.Sci.U.S.A 115, E8987–E8995. 10.1073/pnas.1806215115. [DOI] [PMC free article] [PubMed] [Google Scholar]
- 30.Sparks DL (1978). Functional properties of neurons in the monkey superior colliculus: coupling of neuronal activity and saccade onset. Brain Res 156, 1–16. [DOI] [PubMed] [Google Scholar]
- 31.Munoz DP, and Wurtz RH (1995). Saccade-related activity in monkey superior colliculus. I. Characteristics of burst and buildup cells. J.Neurophysiol. 73, 2313–2333. [DOI] [PubMed] [Google Scholar]
- 32.Everling S, Dorris MC, Klein RM, and Munoz DP (1999). Role of primate superior colliculus in preparation and execution of anti-saccades and pro-saccades. J.Neurosci. 19, 2740–2754. [DOI] [PMC free article] [PubMed] [Google Scholar]
- 33.Soetedjo R, Kojima Y, and Fuchs AF (2008). Complex spike activity in the oculomotor vermis of the cerebellum: a vectorial error signal for saccade motor learning? J.Neurophysiol. 100, 1949–1966. [DOI] [PMC free article] [PubMed] [Google Scholar]
- 34.Sparks DL (2002). The brainstem control of saccadic eye movements. Nat.Rev.Neurosci. 3, 952–964. 10.1038/nrn986. [DOI] [PubMed] [Google Scholar]
- 35.Van Gisbergen JA, Robinson DA, and Gielen S. (1981). A quantitative analysis of generation of saccadic eye movements by burst neurons. J. Neurophysiol. 45, 417–442. 10.1152/jn.1981.45.3.417. [DOI] [PubMed] [Google Scholar]
- 36.Strassman A, Highstein SM, and McCrea RA (1986). Anatomy and physiology of saccadic burst neurons in the alert squirrel monkey. I. Excitatory burst neurons. JComp Neurol 249, 337–357. 10.1002/cne.902490303. [DOI] [PubMed] [Google Scholar]
- 37.Cullen KE, and Guitton D. (1997). Analysis of primate IBN spike trains using system identification techniques. I. Relationship To eye movement dynamics during head-fixed saccades. J.Neurophysiol. 78, 3259–3282. [DOI] [PubMed] [Google Scholar]
- 38.Yoshida K, McCrea R, Berthoz A, and Vidal PP (1982). Morphological and physiological characteristics of inhibitory burst neurons controlling horizontal rapid eye movements in the alert cat. J.Neurophysiol. 48, 761–784. [DOI] [PubMed] [Google Scholar]
- 39.Calame DJ, Becker MI, and Person AL (2023). Cerebellar associative learning underlies skilled reach adaptation. Nat. Neurosci, 1–12. 10.1038/s41593-023-01347-y. [DOI] [PMC free article] [PubMed] [Google Scholar]
- 40.Robinson FR, Straube A, and Fuchs AF (1993). Role of the caudal fastigial nucleus in saccade generation. II. Effects of muscimol inactivation. J.Neurophysiol. 70, 1741–1758. [DOI] [PubMed] [Google Scholar]
- 41.Goffart L, Chen LL, and Sparks DL (2004). Deficits in saccades and fixation during muscimol inactivation of the caudal fastigial nucleus in the rhesus monkey. J.Neurophysiol. 92, 3351–3367. [DOI] [PubMed] [Google Scholar]
- 42.Buzunov E, Mueller A, Straube A, and Robinson FR (2013). When during horizontal saccades in monkey does cerebellar output affect movement? Brain Res 1503, 33–42. 10.1016/j.brainres.2013.02.001. [DOI] [PMC free article] [PubMed] [Google Scholar]
- 43.Kojima Y, Robinson FR, and Soetedjo R. (2014). Cerebellar fastigial nucleus influence on ipsilateral abducens activity during saccades. J.Neurophysiol. 111, 1553–1563. 10.1152/jn.00567.2013. [DOI] [PMC free article] [PubMed] [Google Scholar]
- 44.Heck DH, De Zeeuw CI, Jaeger D, Khodakhah K, and Person AL (2013). The neuronal code(s) of the cerebellum. J.Neurosci. 33, 17603–17609. 10.1523/JNEUROSCI.2759-13.2013. [DOI] [PMC free article] [PubMed] [Google Scholar]
- 45.Khaliq ZM, and Raman IM (2005). Axonal Propagation of Simple and Complex Spikes in Cerebellar Purkinje Neurons. J. Neurosci. 25, 454–463. 10.1523/JNEUROSCI.3045-04.2005. [DOI] [PMC free article] [PubMed] [Google Scholar]
- 46.Monsivais P, Clark BA, Roth A, and Häusser M. (2005). Determinants of Action Potential Propagation in Cerebellar Purkinje Cell Axons. J. Neurosci. 25, 464–472. 10.1523/JNEUROSCI.3871-04.2005. [DOI] [PMC free article] [PubMed] [Google Scholar]
- 47.Hoebeek FE, Witter L, Ruigrok TJH, and Zeeuw CID (2010). Differential olivo-cerebellar cortical control of rebound activity in the cerebellar nuclei. Proc. Natl. Acad. Sci. 107, 8410–8415. 10.1073/pnas.0907118107. [DOI] [PMC free article] [PubMed] [Google Scholar]
- 48.Bengtsson F, Ekerot C-F, and Jörntell H. (2011). In Vivo Analysis of Inhibitory Synaptic Inputs and Rebounds in Deep Cerebellar Nuclear Neurons. PLOS ONE 6, e18822. 10.1371/journal.pone.0018822. [DOI] [PMC free article] [PubMed] [Google Scholar]
- 49.Blenkinsop TA, and Lang EJ (2011). Synaptic action of the olivocerebellar system on cerebellar nuclear spike activity. J.Neurosci. 31, 14708–14720. 10.1523/JNEUROSCI.3323-11.2011. [DOI] [PMC free article] [PubMed] [Google Scholar]
- 50.Tang T, Blenkinsop TA, and Lang EJ (2019). Complex spike synchrony dependent modulation of rat deep cerebellar nuclear activity. eLife 8. 10.7554/eLife.40101. [DOI] [PMC free article] [PubMed] [Google Scholar]
- 51.Noda H, and Fujikado T. (1987). Topography of the oculomotor area of the cerebellar vermis in macaques as determined by microstimulation. J.Neurophysiol. 58, 359–378. [DOI] [PubMed] [Google Scholar]
- 52.Sugihara I, Wu H, and Shinoda Y. (1999). Morphology of single olivocerebellar axons labeled with biotinylated dextran amine in the rat. J.Comp.Neurol. 414, 131–148. . [DOI] [PubMed] [Google Scholar]
- 53.De Zeeuw CI, Hoebeek FE, Bosman LW, Schonewille M, Witter L, and Koekkoek SK (2011). Spatiotemporal firing patterns in the cerebellum. Nat.Rev.Neurosci. 12, 327–344. 10.1038/nrn3011. [DOI] [PubMed] [Google Scholar]
- 54.Lu H, Yang B, and Jaeger D. (2016). Cerebellar Nuclei Neurons Show Only Small Excitatory Responses to Optogenetic Olivary Stimulation in Transgenic Mice: In Vivo and In Vitro Studies. Front. Neural Circuits 10. 10.3389/fncir.2016.00021. [DOI] [PMC free article] [PubMed] [Google Scholar]
- 55.Najac M, and Raman IM (2017). Synaptic excitation by climbing fibre collaterals in the cerebellar nuclei of juvenile and adult mice. J. Physiol, 6703–6718. 10.1113/JP274598@10.1002/(ISSN)1469-7793(CAT)VirtualIssues(VI)EditorsChoice. [DOI] [PMC free article] [PubMed] [Google Scholar]
- 56.Medina JF, and Lisberger SG (2008). Links from complex spikes to local plasticity and motor learning in the cerebellum of awake-behaving monkeys. Nat.Neurosci. 11, 1185–1192. 10.1038/nn.2197. [DOI] [PMC free article] [PubMed] [Google Scholar]
- 57.Marr D. (1969). A theory of cerebellar cortex. JPhysiol Lond. 202, 437–470. [DOI] [PMC free article] [PubMed] [Google Scholar]
- 58.Albus JS (1971). A theory of cerebellar function. Math.Biosci. 10, 25–61. [Google Scholar]
- 59.Ito M, Sakurai M, and Tongroach P. (1982). Climbing fibre induced depression of both mossy fibre responsiveness and glutamate sensitivity of cerebellar Purkinje cells. J.Physiol 324, 113–134. [DOI] [PMC free article] [PubMed] [Google Scholar]
- 60.Kitazawa S, Kimura T, and Yin PB (1998). Cerebellar complex spikes encode both destinations and errors in arm movements. Nature 392, 494. [DOI] [PubMed] [Google Scholar]
- 61.Junker M, Endres D, Sun ZP, Dicke PW, Giese M, and Thier P. (2018). Learning from the past: A reverberation of past errors in the cerebellar climbing fiber signal. PLOS Biol. 16, e2004344. 10.1371/journal.pbio.2004344. [DOI] [PMC free article] [PubMed] [Google Scholar]
- 62.Kobayashi Y, Kawano K, Takemura A, Inoue Y, Kitama T, Gomi H, and Kawato M. (1998). Temporal firing patterns of Purkinje cells in the cerebellar ventral paraflocculus during ocular following responses in monkeys II. Complex spikes. J.Neurophysiol. 80, 832–848. [DOI] [PubMed] [Google Scholar]
- 63.Bouvier G, Aljadeff J, Clopath C, Bimbard C, Ranft J, Blot A, Nadal J-P, Brunel N, Hakim V, and Barbour B. (2018). Cerebellar learning using perturbations. eLife 7, e31599. 10.7554/eLife.31599. [DOI] [PMC free article] [PubMed] [Google Scholar]
- 64.Streng ML, Popa LS, and Ebner TJ (2017). Climbing Fibers Control Purkinje Cell Representations of Behavior. J.Neurosci. 37, 1997–2009. 10.1523/JNEUROSCI.3163-16.2017. [DOI] [PMC free article] [PubMed] [Google Scholar]
- 65.Fujita H, Kodama T, and du Lac S. (2020). Modular output circuits of the fastigial nucleus for diverse motor and nonmotor functions of the cerebellar vermis. eLife 9, e58613. 10.7554/eLife.58613. [DOI] [PMC free article] [PubMed] [Google Scholar]
- 66.Cerminara NL, Garwicz M, Darch H, Houghton C, Marple-Horvat DE, and Apps R. (2022). Neuronal activity patterns in microcircuits of the cerebellar cortical C3 zone during reaching. J. Physiol. 600, 5077–5099. 10.1113/JP282928. [DOI] [PMC free article] [PubMed] [Google Scholar]
- 67.Krauzlis RJ, and Lisberger SG (1996). Directional organization of eye movement and visual signals in the floccular lobe of the monkey cerebellum. Exp. Brain Res. 109, 289–302. 10.1007/BF00231788. [DOI] [PubMed] [Google Scholar]
- 68.Stone LS, and Lisberger SG (1990). Visual responses of Purkinje cells in the cerebellar flocculus during smooth-pursuit eye movements in monkeys. II. Complex spikes. J. Neurophysiol. 63, 1262–1275. 10.1152/jn.1990.63.5.1262. [DOI] [PubMed] [Google Scholar]
- 69.Hage P, Jang IK, Looi V, Fakharian MA, Orozco SP, Pi JS, Sedaghat-Nejad E, and Shadmehr R. (2023). Effort cost of harvest affects decisions and movement vigor of marmosets during foraging. 2023.02.04.527146. 10.1101/2023.02.04.527146. [DOI] [PMC free article] [PubMed] [Google Scholar]
- 70.Siegle JH, Lopez AC, Patel YA, Abramov K, Ohayon S, and Voigts J. (2017). Open Ephys: an open-source, plugin-based platform for multichannel electrophysiology. JNeural Eng 14, 045003. 10.1088/1741-2552/aa5eea. [DOI] [PubMed] [Google Scholar]
- 71.Sedaghat-Nejad E, Fakharian MA, Pi J, Hage P, Kojima Y, Soetedjo R, Ohmae S, Medina JF, and Shadmehr R. (2021). P-sort: an open-source software for cerebellar neurophysiology. J. Neurophysiol. 126, 1055–1075. 10.1152/jn.00172.2021. [DOI] [PMC free article] [PubMed] [Google Scholar]
- 72.Pachitariu M, Steinmetz N, Kadir S, Carandini M, and D HK (2016). Kilosort: realtime spike-sorting for extracellular electrophysiology with hundreds of channels. bioRxiv, 061481. 10.1101/061481. [DOI] [Google Scholar]
Associated Data
This section collects any data citations, data availability statements, or supplementary materials included in this article.
Supplementary Materials
Data Availability Statement
The source data to reproduce the figures has been deposited at Mendeley Data. The DOI is listed in the key resources table.
Analysis code has been deposited at Mendeley Data. The DOI is listed in the key resources table.
Any additional information required to reanalyze the data reported in this paper is available from the lead contact upon request.
Key resources table
| REAGENT or RESOURCE | SOURCE | IDENTIFIER |
|---|---|---|
| Antibodies | ||
| Bacterial and virus strains | ||
| Biological samples | ||
| Chemicals, peptides, and recombinant proteins | ||
| Critical commercial assays | ||
| Deposited data | ||
| Raw and analyzed data | This paper and Sedaghat-Nejad et al. 202224; Mendeley Data | https://doi.org/10.17632/pkt982nxtg.1 |
| Experimental models: Cell lines | ||
| Experimental models: Organisms/strains | ||
| Marmoset monkeys (Callithrix Jacchus, male and female, 350–370 g, 6 years old at start of recordings) | Born and raised in a colony that Prof. Xiaoqin Wang has maintained at the Johns Hopkins School of Medicine since 1996 | N/A |
| Oligonucleotides | ||
| Recombinant DNA | ||
| Software and algorithms | ||
| OpenEphys | Siegle et al. 201770 | |
| P-sort | Sedaghat-Nejad et al. 202171 | |
| Kilosort and Phi | Pachitariu et al. 201672 | |
| MATLAB | MathWorks | https://www.mathworks.com |
| Other | ||