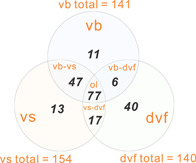
Figure 2.

Venn diagram representing the overlapped viral scaffolds (intersection) identified by three methods. The results of individual methods were adopted from the demonstration of the example metagenome data set of the Guaymas Basin hydrothermal vent sample. dvf, DeepVirFinder; ol, overlapped viral scaffolds by “vb,” “vs,” and “dvf”; vb, VIBRANT; vs, VirSorter2; vb–dvf, VIBRANT and DeepVirFinder; vb–vs, VIBRANT and VirSorter2; vs–dvf, VirSorter2 and DeepVirFinder.
