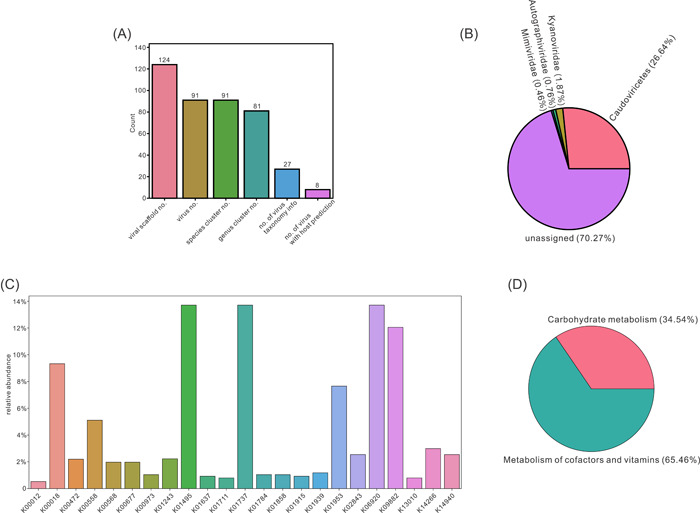
Figure 3.

Visualizations of virus statistics. (A) Bar chart representing the numbers of identified viral scaffolds, viruses, viral species, viral genera, viruses with taxonomy assigned, and viruses with host predicted. (B) Pie chart representing the virus family relative abundance. (C) Bar chart representing the AMG KO relative abundance. (D) Pie chart representing the AMG KO metabolism relative abundance. AMG, auxiliary metabolic gene; KO, KEGG orthologs.
