Abstract
Advanced immunoassays are crucial in assessing antibody responses, serving immune surveillance goals, characterising immunological responses to evolving viral variants, and guiding subsequent vaccination initiatives. This protocol outlines an indirect ELISA protocol to detect and quantify virus-specific antibodies in plasma or serum after exposure to viral antigens. The assay enables the measurement of IgG, IgA, and IgM antibodies specific to the virus of interest, providing qualitative and quantitative optical densities and concentration data. Although this protocol refers to SARS-CoV-2, its methodology is versatile and can be modified to assess antibody responses for various viral infections and to evaluate vaccine trial outcomes.
Key features
• This protocol builds upon previously described methodology [1] explicitly tailored for SARS-CoV-2 and broadens its applicability to other viral infections.
• The protocol outlines establishing antibody responses to SARS-CoV-2 infections by determining optical densities and concentrations from blood plasma or serum.
Keywords: ELISA, SARS-CoV-2, Viral infections, Optical densities, Antibody concentrations
Graphical overview
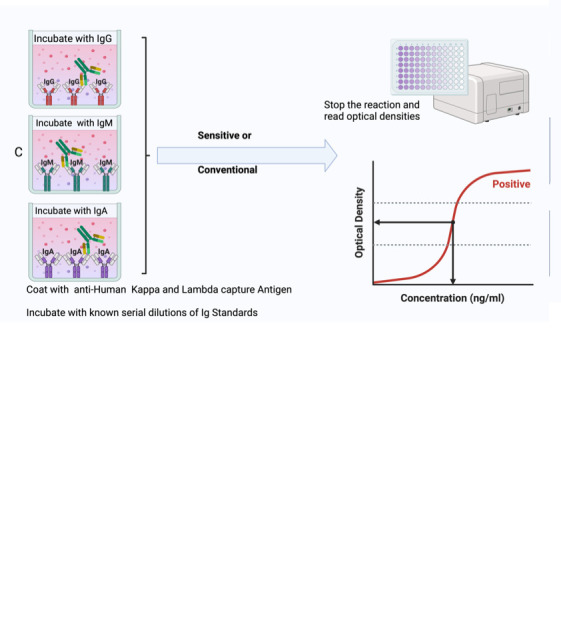
Summary of the conventional ELISA (A) vs. sensitive ELISA (B) procedures. In both A and B, wells are coated with a capture antigen, such as the spike protein, while in (C) they are coated with human Kappa and Lambda capture antibodies. For the conventional ELISA (A), wells with immobilised capture antigens receive serum/plasma containing the target antibody (A1 and B1). This is followed by an HRP-conjugated detection antibody specific to the captured antibody (A2 and B2) and then a substrate solution that reacts with the HRP, producing a colour proportional to the concentration of the antibody in the serum/plasma (A3 and B3). The reaction is halted, and absorbance is measured. In the sensitive ELISA (B), after the serum/plasma addition (A1 and B1), a Biotin-conjugated primary detection antibody is introduced (A2 and B2). Depending on the target antibody, a secondary streptavidin-HRP conjugated detection antibody is added for IgG or IgM (3a) or a poly-HRP 40 detection antibody for IgA (3b). A substrate is introduced, producing a colour change proportional to the antibody concentration (A4 and B4). The reaction is then stopped, and absorbance is measured. In Panel C, wells are coated with human Kappa and Lambda capture antibodies. Serial dilutions of a known antibody standard are introduced. After undergoing the standard ELISA steps, a detection antibody is added, specifically binding to the Ig standard antibody. Subsequently, a substrate solution causes a colour change proportional to the antibody concentration in the serum/plasma. The reaction is halted, and the absorbance of each well is measured. The resulting optical densities from the coated wells form the standard curve, plotting the absorbance against concentrations.
Background
The indirect enzyme-linked immunosorbent assay (ELISA) effectively quantifies and assesses antibody responses, making it invaluable for monitoring public health, evaluating vaccination programs, and testing new vaccines. This has particularly been of importance at the height of the COVID-19 pandemic, during which there was continuous emergence of antigenically distinct variants [2]. It was important to track the dynamics of antigen-specific immune responses to detect immune escape in various populations. Despite similar rates of seropositivity being seen among symptomatic and asymptomatic individuals [3], certain scenarios revealed some differences [4]. A less robust humoral response has been connected to mild COVID-19 cases, prompting concerns about a potentially accelerated decline in immunity. Conversely, severe illness has been linked to a prolonged presence of humoral immunity, enduring for up to 12 months after infection [5, 6]. It is essential to understand the evolution of antibody development within sub-Saharan African (SSA) environments, characterised by distinct disease patterns. Monitoring shifts in IgM, IgG, and IgA levels targeting S, receptor binding domain (RBD), and N antigens becomes crucial in SSA, offering insights into diagnostic approaches, public health strategies, and the immunological aspects relevant to vaccine development. We optimised and validated an in-house indirect ELISA to detect and quantify SARS-CoV-2 spike-, nucleoprotein-, and RBD-directed IgG, IgM, and IgA antibodies in a Ugandan cohort largely characterised by mild and asymptomatic COVID-19. For positive controls, 106 specimens were collected from PCR-confirmed positive study participants; 205 pre-pandemic specimens obtained between October 2012 and November 2017 were used as negative control samples to determine optimal cutoff values, maximizing assay sensitivity and prioritizing assay specificity [1, 7]. Consequently, the determined cutoff values are useful in contexts where mild and asymptomatic SARS-CoV-2 infections are the predominant clinical picture. Commercial standards of known antibody concentrations were used to establish assay limits of detection (LOD) and quantitation (LOQ). Therefore, we present parameters that can be followed to determine optical densities and antibody concentrations in different populations and in regions that had different clinical outcomes and suggest that the same can be done in investigations of antibody responses to other infectious diseases and vaccinations, for example in clinical trials of various vaccine candidates. The COVAC self-amplifying RNA vaccine trial in Uganda [8] has demonstrated the successful application of this protocol.
Materials and reagents
Biological materials
Human serum or plasma samples freshly obtained from study participants, heat inactivated at 56 °C for 30 min and centrifuged at 1,000× g for 10 min at 18–25 °C. One should expect approximately 1.8 mL of serum/plasma after centrifugation, with a pellet at the bottom and the supernatant at the top in each tube. The supernatant should be collected and aliquoted into different tubes stored at -80 °C. Once an aliquot is picked and thawed, it should be kept in a 2–8 °C fridge and used within only one week.
Reagents
Recombinant SARS-CoV-2 Nucleocapsid protein(R&D Systems, catalog number: 10474-CV-01M)
Recombinant SARS-CoV-2 Spike protein (R&D Systems, catalog number: 10549-CV-01M)
Recombinant SARS-CoV-2 Spike S2 Subunit protein (R&D Systems, catalog number: 10594-CV-100)
SARS-CoV-2 RBD (S1) S-protein obtained from a pHL-sec expression vector in HEK 293T/17 cells [obtained from the American Type Culture Collection (ATCC), catalogue number: CRL-11268]. pHL-sec expression vector was a kind donation from the Doores lab at King’s College London
Goat anti-human Kappa-UNLB antibody (Southern Biotech, catalog number: 2060-01)
Goat anti-human Lambda-UNLB antibody (Southern Biotech, catalog number: 2070-01)
Purified human IgG (Sigma, catalog number: I2511)
Purified human IgA (Sigma, catalog number: I2636)
Purified human IgM (Sigma, catalog number: I8260)
Goat anti-human IgG-HRP (Sigma, catalog number: A0170 or AP113P)
Anti-human IgM-HRP (Sigma, catalog number: A6907)
Anti-human IgA-HRP(Sigma, catalog number: A0295)
Goat anti-human Fc IgG-Biotin conjugate (Southern Biotech, catalog number: 2048-08)
Goat anti-human IgA-Biotin (Southern Biotech, catalog number: 2050-08)
Goat anti-human IgM-Biotin (Southern Biotech, catalog number: 2020-08)
PBS/Tween Sachets (PBST) (Sigma, catalog number: P3563)
Tween-20 (Sigma, catalog number: P2287)
1× Dulbecco’s phosphate buffered saline (DPBS), CaCl2 (-) MgCl2 (-) (Sigma, catalog number: D8537)
Bovine serum albumin (BSA) (Sigma, catalog number: A3803)
Goat serum (Sigma, catalog number: G9023)
Streptavidin-HRP (R&D Systems, catalog number: DY988)
Tetramethyl benzidine (TMB) substrate (SeraCare, catalog number: 5120-0080 or 52-00-02)
TMB stop solution (SeraCare, catalog number, 5150-0021 or 50-85-06)
Casein blocking buffer (Thermo Scientific, catalog number: 37582)
Poly-HRP-40 (Fitzgerald, catalog number: 65R-S104PHRP)
Solutions
PBST wash buffer (see Recipes)
BSA assay buffer/sample diluent/blocking buffer (see Recipes)
Goat serum assay buffer/sample diluent (see Recipes)
Recipes
-
Wash buffer
Reagent Final concentration (%) Quantity or Volume 1× DPBS pH 7.4 99.95% 999.5 mL Tween-20 0.05% 0.5 mL Total 100% 1,000 mL Store in a capped bottle at room temperature up to seven days.
-
BSA assay buffer/sample diluent/blocking buffer
Reagent Final concentration (%) Quantity or Volume 1× DPBS pH 7.4 99.95% 499.75 mL Tween-20 0.05% 0.25 mL BSA 1% 5 g Total 100% 500 mL Filter the buffer through a 0.22 µm filter unit. Store at 2–8 °C up to seven days.
-
Goat serum assay buffer/sample diluent
Reagent Final concentration (%) Quantity or Volume 1× DPBS pH 7.4 94% 470 mL Tween-20 1% 5 mL Goat serum 5% 25 mL Total 100% 500 mL Filter the buffer through a 0.22 µm filter unit. Store at 2–8 °C up to seven days.
Laboratory supplies
U-bottom, 96-well dilution plates (Corning, catalog number: 3690)
Medium binding, flat-well ELISA plates (Greiner Bio-One, catalog number: 655001)
Sealing tape (Thermo Fisher Scientific, catalog number: 15036)
Reservoirs (CoStar, catalog number: 4870)
Pipettes (P2, P5, P20, P100, P200, P300-Multichannel, P1000) (at the discretion of the laboratory)
Pipette tips (10, 20, and 200 µL) (at the discretion of the laboratory)
50 mL centrifuge tubes (Sigma, catalog number: T1943)
Paper towel rolls (at the discretion of the laboratory)
2 mL cryovials (Sigma, catalog number: BR114832-1000EA)
0.22 µm syringe filters (TISCH Scientific, catalog number: SPEC16251)
Equipment
-20 °C or -80 °C freezer (at the discretion of the laboratory)
Benchtop centrifuge (at the discretion of the laboratory)
Plate washer (BioTek Washer, ELx405 UCWVSD)
Plate reader (BioTek Reader, Elx808IU)
Software and datasets
Plate reader software: Gen5TM Microplate Data Collection and Analysis Software (v3.12, 11/23/2021); license CD purchased through BioTek or provided along with the reader
Spreadsheet software: Microsoft Office Excel v16.0, 2016 or later (09/22/2015); requires Microsoft Office license.
Data analysis software: GraphPad Prism v9.3 (GraphPad, 11/15/2021); license obtained through GraphPad
Software programming language; R Version 4.3.1 (21/04/2023); free to use
Procedure
The conventional ELISA is effective for detecting and quantifying antibodies in plasma or serum after substantial antigenic exposure such as after natural infection. Conventional ELISA finds its application in scenarios where the target molecule is anticipated to exist in comparatively higher concentrations. On the other hand, sensitive ELISA proves advantageous in early detection of immune responses or diseases, especially when the levels of specific antibodies or antigens are exceedingly low. When low antibody levels are observed in clinical trials, the sensitive version of the ELISA assay is employed, incorporating the addition of a biotin–streptavidin detection step that is particularly useful for amplifying and detecting background responses to antigens that the conventional ELISA might not discern. Serum should be obtained from blood collected in serum separating tubes (SST) and plasma from blood collected in acid citric dextrose (ACD) tubes to ensure high quality samples that are free of contaminants.
-
Preparation of serum or plasma samples and reagents
-
Serum or plasma samples should be heat inactivated for 30 min at 56 °C and centrifuged at 1,000× g for 10 min at 18–25 °C to harvest the supernatant before testing. If the serum or plasma samples cannot be processed immediately, they should be aliquoted and stored at -80 °C to ensure structural integrity and long-term stability of the antibodies.
Critical: The serum/plasma is heat-inactivated to ensure the safety of the operators since this assay is run on the bench and not under a biosafety cabinet. This kills any potential pathogens present in the serum/plasma.
Unless stated otherwise, all procedures are performed at room temperature (20–25 °C) for the conventional ELISA and at 37 °C for the sensitive ELISA, as described later.
A plate plan should be drawn to record the position of samples, controls, and standards in each ELISA plate. An example is illustrated in Figure 1.
Prepare wash buffer as described in Recipe 1 or by dissolving one sachet of PBS/TWEEN in 1 L of distilled water.
Prepare BSA assay buffer for the conventional ELISA or goat serum assay buffer for the sensitive ELISA as described in Recipes 2 and 3, respectively.
All prepared and aliquoted reagents, i.e., all standards and detection antibodies, should be kept in a -20 °C freezer. Once an aliquot is picked and thawed, it should be kept in a fridge and used within only one week. It should be clearly labelled with the date of first opened/prepared.
It is crucial to utilise reagents that are new and still within their specified expiration date.
-
-
Coating of medium-binding ELISA plates
Caution: Inconsistent pipetting may undermine accuracy in processes such as sample dilution, bubble formation, or protocol deviations. Ensure proper pipetting techniques during the assay, e.g., controlled up and down pipetting to minimise bubbles. Refer to Problem 2 under the Troubleshooting section.
Coat wells A1–H2 (see Figure 1) of the 96-well medium-binding ELISA plate by adding 50 µL per well of a solution containing both anti-Human kappa and anti-Human lambda capture antibodies diluted in DPBS, at a final dilution of 1:500 at a 1:1 ratio of anti-Human kappa and anti-Human lambda capture antibodies as shown in Table 1. The coated wells will contain the purified antibodies for the standard curve.
-
Coat the rest of the wells of the 96-well medium-binding ELISA plate by adding 50 µL of antigen [recombinant SARS-CoV-2 Nucleocapsid protein, recombinant SARS-CoV-2 Spike protein, recombinant SARS-CoV-2 Spike S2 Subunit protein, or SARS-CoV-2 RBD (S1) S-protein] prediluted in DPBS to a working concentration of 3 µg/mL, with a separate plate for each protein. The predilution parameters for the antigen depend on the concentration of the stock solution, which could vary from lot to lot. The demonstrated dilution in Table 2 uses 500 µg/mL as the stock concentration.
Note: Medium-binding plates are more cost effective and suitable for this protocol where non-specific binding might interfere with the assay. They are generally easier to wash and are less likely to retain residual proteins. While they offer strong binding, high-binding plates may be more challenging to wash thoroughly due to their higher binding capacity.
-
Cover the plates with sealing tape and incubate for 2 h at 37 °C in a humidified incubator or overnight at 4 °C.
Note: During the 2 h incubation time, proceed to section C.
Caution: Do not rock the plates during incubation because rocking can interrupt the formation of bonds between the coating antigen/antibody and the surface of the plate.
-
After the incubation, wash the ELISA plates with five rounds of 200 µL per well of washing buffer using the plate washer, flick the plates over a container to rid it of excess buffer, and tap gently on paper towel to dry the plate. Then, proceed to section D.
Note: When using the plate washer, set up a protocol by entering the volume of washing buffer required for each well and the number of times each well should be washed on each ELISA plate. Place the plate on the plate holder and run the protocol. If an automated washer is unavailable, 5× of manual washing can be done using a multi-channel pipette set at 200 µL.
-
Preparation of serum/plasma and control samples
Sample preparation should be performed on the day of the assay (diluted samples should not be stored).
Dilute samples in U-bottom dilution plates using BSA assay buffer for the conventional ELISA or goat serum assay buffer for the sensitive ELISA.
For a 1:100 dilution, add 198 µL of assay buffer to the wells of the dilution plate followed by 2 µL of test sample in duplicate wells following the plate plan in Figure 1.
For a 1:50 dilution, add 196 µL of assay buffer to the wells of the dilution plate followed by 4 µL of test sample in duplicate wells following the plate plan in Figure 1.
-
Prepare positive and negative control samples at the same dilution used for the test samples; if commercial, prepare according to the manufacturers’ recommendations. Positive and negative controls should be prepared using assay buffer in 2 mL cryovials.
Note: For each well of the ELISA plate, 50 µL of samples or controls will be required. Therefore, the number of wells for each control and number of plates in the experiment should be considered in preparation of the required volume of positive or negative controls.
-
Blocking of medium-binding ELISA plates
Add 200 µL of BSA assay buffer (conventional ELISA) or goat serum assay buffer (sensitive ELISA) to all the wells in each ELISA plate. Seal the plates and incubate for 1 h at room temperature (conventional ELISA) or at 37 °C (sensitive ELISA).
(Critical) Proceed to section E when there are 20 minutes left to the end of the blocking incubation period.
After incubation, wash the plates five times with 200 µL of wash buffer per well.
-
Preparation of standards
-
Use purified human IgG, IgA, or IgM to prepare seven serial dilutions of antibody standards in 2 mL cryovials, as shown in Table 3, Table 4, and Table 5. If more than one plate is being run at a particular time, it is more efficient to prepare the standards in cryovials and then pipette them into their respective ELISA plate wells. Using cryovials also ensures proper mixing as one performs the serial dilutions.
Note: If the stock concentrations of the purified antibodies differ from those provided in the tables, the initial dilutions will have to be adjusted to achieve a starting concentration of 1,000 ng/mL.
The IgG and IgA serial dilutions are 10-fold, while the IgM dilution is 5-fold. These parameters can be adjusted to suit particular experimental conditions.
-
-
Addition of samples, controls, and standards
Add 50 µL of sample/standard/control to the appropriate wells on the plate following the plate plan. Seal plates and incubate for 2 h at room temperature (conventional assay) or for 1 h at 37 °C (sensitive assay). A suggested plate plan for the arrangement of samples, controls, and standards is illustrated in Figure 1.
-
Following incubation, wash the plates five times with 200 µL of wash buffer per well.
Notes:
Some of the controls (control 1, 3, and 4) are run in more than duplicates as a way of testing operators as they run the assay. Running controls at different positions can show if there is any cross contamination or inconsistency as an operator pipettes the controls into their respective wells.
You can also choose to have different types of controls, where a plate can have two positive controls; one that is an in-house control and another that is a commercially prepared positive control, e.g., WHO seropositive serum.
In-house controls calibrate the assay specifically for the laboratory’s equipment, reagents, and techniques, while commercial controls act as a standardised reference point that can be used across different laboratories, making results comparable between different lab settings and experiments.
-
Addition of secondary antibody (detection antibody)
(Critical) The secondary antibody should be prepared 30 min before use. After adding the detection antibody, proceed to section H.
-
For the conventional assay:
For IgG plates, dilute goat α-human IgG-HRP detection antibody 1: 10,000 in assay buffer.
For IgM plates, dilute human anti-IgM-HRP detection antibody 1:1,000 in assay buffer for the Spike protein and 1:5,000 for the N-protein.
For IgA plates, dilute anti-human-IgA-HRP detection antibody 1:1,000 in assay buffer.
Add 50 µL of the particular detection antibody per well. Seal plates and incubate for 1 h at room temperature. Following incubation, wash the plates five times with PBST using 200 µL per well.
-
For the sensitive assay:
-
Add 50 µL of the primary detection antibody, prepared as described below per well. Seal plates and incubate for 1 h at 37 °C.
i. For IgG plates, dilute goat α-human IgG-Biotin detection antibody 1: 15,000 in goat assay buffer.
ii. For IgM plates, dilute goat anti-human IgM-Biotin detection antibody 1:20,000 in goat assay buffer.
iii. For IgA plates, dilute α-human IgA-Biotin detection antibody 1:20,000 in casein buffer.
-
Following incubation, wash the plates five times with PBST using 200 µL per well. Add 50 µL of the secondary detection antibody prepared as described below per well. Seal plates and incubate for 1 h at 37 °C.
i. For IgA plates, dilute Poly-HRP40 1:20,000 in casein buffer.
Note: For IgA plates, seal plates and incubate at 37 °C in the dark for 40 min.
iii. For IgG and IgM plates, dilute streptavidin-HRP 1:200 in goat assay buffer.
Following incubation, wash the plates five times with PBST using 200 µL per well.
-
-
Setting up the plate reader and Gen5 software
Switch on the reader (Elx808). The reader will perform a system self-test.
Switch on the PC connected to the reader and double-click the Gen5 3.12 Task Manager icon to open. It will show a window as seen in Figure 2.
Create a protocol by clicking on Protocols > Create new as highlighted in Figure 2.
Check Standard protocol and then click OK. The window shown in Figure 3 will be displayed.
Click on the icon for creating or editing the list of steps as shown in Figure 3.
After that, the window shown in Figure 4 will appear. Select the plate type, e.g., 96-well plate. Under Select wells, check At runtime and indicate if the plate you are reading will have a lid or not.
Click on Read, check the desired wavelength (i.e., 450 nm) as shown in Figure 5, and click Ok.
The selected wavelength will be displayed as seen in Figure 6. Click OK after this.
Double-click Plate layout on the tool builder as shown in Figure 7.
Select the appropriate well types as shown in Figure 8 and click Next. Be critical to include the number of assay controls you want in your plate. In this protocol, there are four assay controls used. Click Next after this selection.
Update the blank as appropriate. Enter full name of BLK as BLANK, number of times the blank is repeated (e.g., 2), and the colour code of choice as shown in Figure 9. Click Next after entering this information.
Repeat step 11 for the assay controls and samples.
Update the standards as appropriate. As shown in Figure 10, enter full name of STD as the antibody being tested (e.g., IgG), number of times the blank is repeated (e.g., 2), and the colour code of choice. Enter the unit for the standards (e.g., ng) and the dilution factor (e.g., 10) for IgG. Enter the starting concentration in STD1 and click in the next boxes to automatically fill in the rest of the standards. Click Next after entering this information.
Click Ok and the plate layout will be displayed as shown in Figure 11.
Allocate the different sample type onto the plate by highlighting the sample type (e.g., BLK for blank) and selecting the appropriate orientation.
Using the pointer, drag across the required wells for that sample type in the plate layout. Alternatively, click the first well in the series to automatically fill the adjacent wells with the required number of samples for that type in the selected orientation. The plate layout will appear as shown in Figure 12.
After this plate layout has been correctly filled, click OK.
Double-click Data reduction on the tool builder shown in Figure 7. The screen as shown in Figure 13 will be displayed.
Go to Standard curve (Data In) and set the y-axis to 450. Go to Curve Fit and set it to non-linear regression (Figure 14).
Double-click on the Report/Export builder and the window shown in Figure 15 will be displayed.
Click on New export to Excel and under name enter the name of the report output (e.g., Export 1). Check Plate, Automatic, or Custom (if you want to customise your output) and click Ok. The window in Figure 16 will appear.
Check all parameters under Content as shown in Figure 17.
Under Workflow, check Auto-execute, Each pate in a separate workbook, and Save after export as seen in Figure 18. Click Next.
Under File >File name, enter file name (e.g., <PLATE_ID>). Check Folder and browse the folder where you want your files to be saved, as shown in Figure 19.
Click Next and Ok.
To create a customised protocol, click on New export to Excel, as seen in Figure 15. Under Name, enter the name of the report output (e.g., Export 2), check Plate and Custom (Figure 20), and click Next.
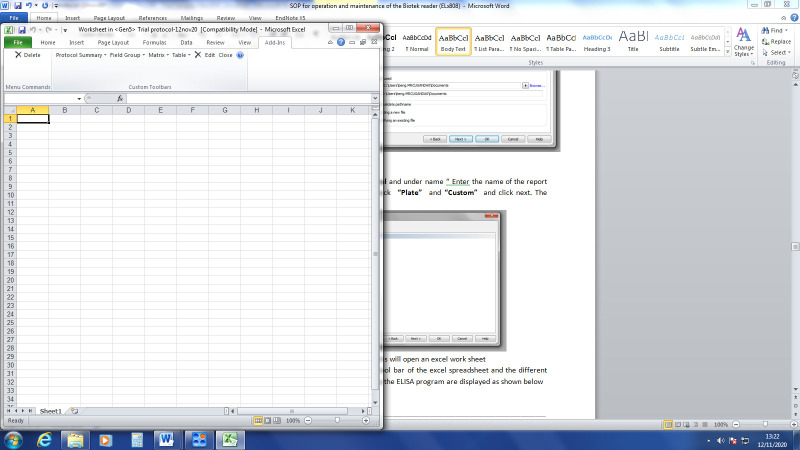
Click Edit Template and this will open an Excel worksheet.
Click on Add-Ins on the toolbar of the Excel spreadsheet. The custom toolbar is displayed as shown in Figure 21.
-
Customise your template as appropriate by clicking on the drop-down and dragging into the worksheet.
Go to Field Group and set the category as plate information, field, and label as “plate ID.”
Go to Matrix and add plate layout.
Go to Matrix and add 450.
Go to Matrix and add concentration.
Go to Table and then Statistics and add 450.
Go to Table and then Statistics and add concentration.
Go to Graph and add standard curve.
Close the Excel and proceed with steps 20–22 above as done in the automatic builder.
Go to File and save this protocol in a folder labelled “Protocols and Experiments” for easy identification.
To create an experiment in the program, open the Gen5 Software.
The task manager box will appear as shown in Figure 22. Choose Experiments from options, then Create using an existing protocol. Select from the list the protocol that you just saved.
A new Experiment is created. In tool bar, select File > Save As and save with the appropriate name.
In Task bar select Plate, then Add Plates and add the required number of additional plates to be read.
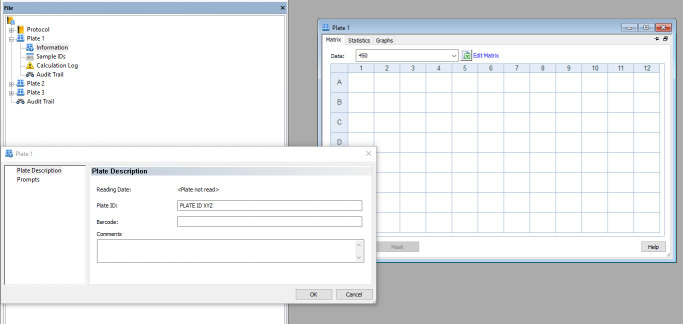
Plates appear in the menu tree as shown in Figure 23.
Double-click Plate 1, followed by Information. Enter the appropriate plate ID and repeat this to label all the other plates.
-
Use Microsoft Excel to create a list of the sample IDs on each plate and paste it into a notepad file.
Note: You cannot import sample ID lists from .xls files into this software.
Select Sample IDs from the drop-down menu under each plate, as shown in Figure 24.
Import sample IDs from the notepad file. Alternatively, one can enter the sample IDs manually.
Add sample ID list to each plate. Save the experiment with the included changes.
The reader and software are now set up to read the ELISA plates.
-
Addition of substrate and determination of absorbencies
(Critical) TMB substrate solution should be removed from the fridge at least 1 h before use.
Add 50 µL per well of TMB substrate to the plates and incubate for 3 min in the dark (conventional ELISA) or 5 min (sensitive ELISA) at room temperature in the dark.
Stop the reaction by the addition of 50 µL of stop solution per well.
-
Read absorbencies at 450 nm using the plate reader and Gen5 software through study customised protocols.
Export the results to an Excel worksheet and store the raw data, which will include a standard curve for each plate read. Examples of these standard curves can be seen in Figure 27, Figure 28, and Figure 29.
Figure 1. Representative plate plan to arrange standards, samples, and controls.
“SPL” represents a sample, “control” represents a negative control, and “+ control” represents a positive control.
Table 1. Predilution of anti-human Lambda and Kappa capture antibodies.
| Anti-Human Kappa (µL) | Anti-Human Lambda (µL) | DPBS (µL) | Total (µL) |
|---|---|---|---|
| 3 | 3 | 1494 | 1500 |
Note: This 1:500 dilution is for one plate. Multiply volumes by the number of plates in the assay.
Table 2. Predilution of SARS-CoV-2 coating antigens.
| Capture antigen (stock concentration, µg/mL) | Working concentration (µg/mL) | Volume of antigen (µL) | DPBS (µL) | Total (µL) |
|---|---|---|---|---|
| Spike/Nucleoprotein/RBD (500 µg/mL) | 3 | 36 | 5,964 | 6,000 |
Note: This dilution is for one plate. Multiply volumes by the number of plates in the assay.
Table 3. IgG standard serial dilution in assay buffer.
. Adjust the volumes depending on the plate plan and the number of plates.Initial 1:100 dilution of human IgG
| Prepare a 1:100 dilution of human IgG in the appropriate buffer prior to preparing the serial dilutions | ||||||
|---|---|---|---|---|---|---|
| Dilution | Stock (mg/mL) | Stock (µL) | Assay buffer (µL) | Total (µL) | ||
| Human IgG | 1:100 | 4.52 | 2 | 198 | 200 | |
| Serial dilution of human IgG following the initial 1:100 dilution | ||||||
| Concentration (ng/mL) | IgG Std (µL) | Assay buffer (µL) | Total (µL) | Take over (µL) | Left over (µL) | |
| Std curve human IgG (10-fold dilution) | 1,000 | 20 | 884 | 904 | 90 | 814 |
| 100 | 90 | 810 | 900 | 90 | 810 | |
| 10 | 90 | 810 | 900 | 90 | 810 | |
| 1 | 90 | 810 | 900 | 90 | 810 | |
| 0.1 | 90 | 810 | 900 | 90 | 810 | |
| 0.01 | 90 | 810 | 900 | 90 | 810 | |
| 0.001 | 90 | 810 | 900 | - | 900 | |
Table 4. IgA standard serial dilution in assay buffer.
Adjust the volumes depending on the plate plan and the number of plates.Initial 1:100 dilution of human IgA
| Prepare a 1:100 dilution of human IgA in the appropriate buffer prior to preparing the serial dilutions | ||||||
|---|---|---|---|---|---|---|
| Dilution | Stock (mg/mL) | Stock (µL) | Assay buffer (µL) | Total (µL) | ||
| Human IgA | 1:100 | 2.0 | 2 | 198 | 200 | |
| Serial dilution of human IgA following the initial 1:100 dilution | ||||||
| Concentration(ng/mL) | IgA Std (µL) | Assay buffer (µL) | Total (µL) | Take over (µL) | Left over (µL) | |
| Std curve human IgA (10-fold dilution) | 1,000 | 45 | 855 | 900 | 90 | 810 |
| 100 | 90 | 810 | 900 | 90 | 810 | |
| 10 | 90 | 810 | 900 | 90 | 810 | |
| 1 | 90 | 810 | 900 | 90 | 810 | |
| 0.1 | 90 | 810 | 900 | 90 | 810 | |
| 0.01 | 90 | 810 | 900 | 90 | 810 | |
| 0.001 | 90 | 810 | 900 | - | 900 | |
Table 5. IgM standard serial dilution in assay buffer.
Adjust the volumes depending on the plate plan and the number of plates.Initial 1:100 dilution of human IgM
| Prepare a 1:100 dilution of human IgM in the appropriate buffer prior to preparing the serial dilutions | ||||||
|---|---|---|---|---|---|---|
| Dilution | Stock (mg/mL) | Stock (µL) | Assay buffer (µL) | Total (µL) | ||
| Human IgM | 1:100 | 1.0 | 2 | 198 | 200 | |
| Serial dilution of human IgM following the initial 1:100 dilution | ||||||
| Concentration (ng/mL) | IgM Std (µL) | Assay buffer (µL) | Total (µL) | Take over (µL) | Left over (µL) | |
| Std curve human IgM (5-fold dilution) | 1,000 | 90 | 810 | 900 | 180 | 720 |
| 200 | 180 | 720 | 900 | 180 | 720 | |
| 40 | 180 | 720 | 900 | 180 | 720 | |
| 8 | 180 | 720 | 900 | 180 | 720 | |
| 1.6 | 180 | 720 | 900 | 180 | 720 | |
| 0.32 | 180 | 720 | 900 | 180 | 720 | |
| 0.006 | 180 | 720 | 900 | - | 900 | |
Figure 2. Open Task Manager window on the Gen5 3.12 software.
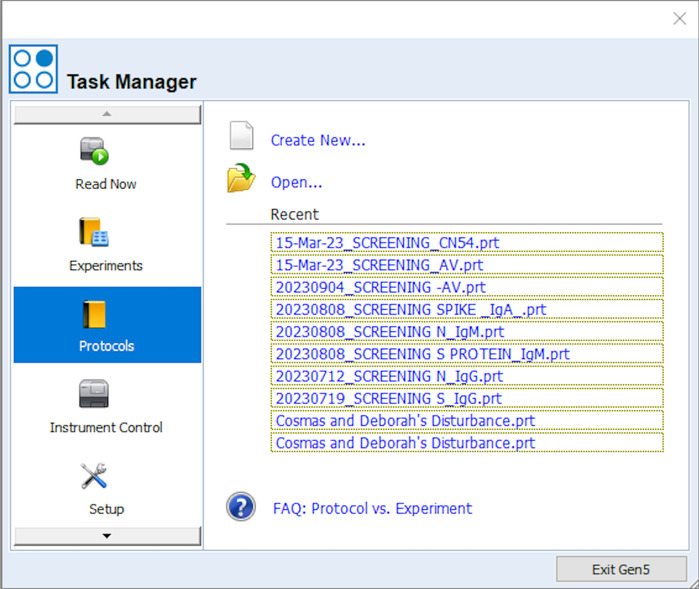
Figure 3. Window that appears upon selecting the standard protocol option.
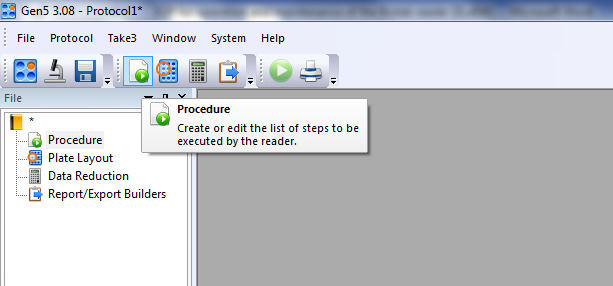
Figure 4. Procedure layout on the Gen5 software.
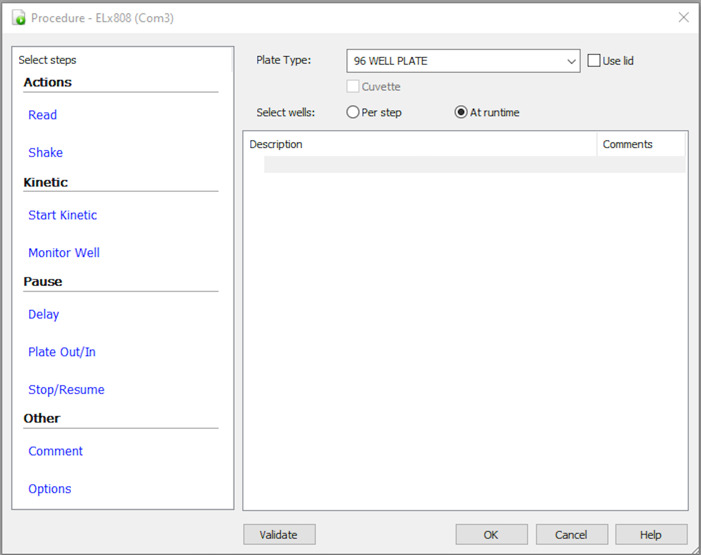
Figure 5. Window where you can enter the desired wavelength for reading the ELISA plate.
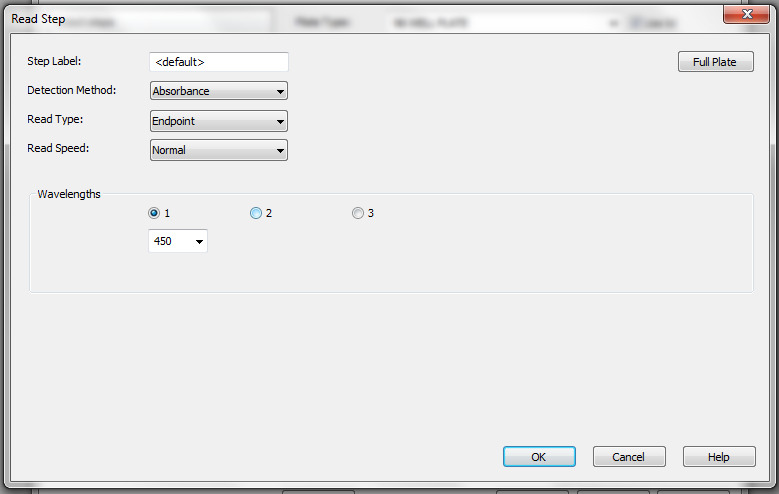
Figure 6. Selected wavelength for reading the ELISA plates.
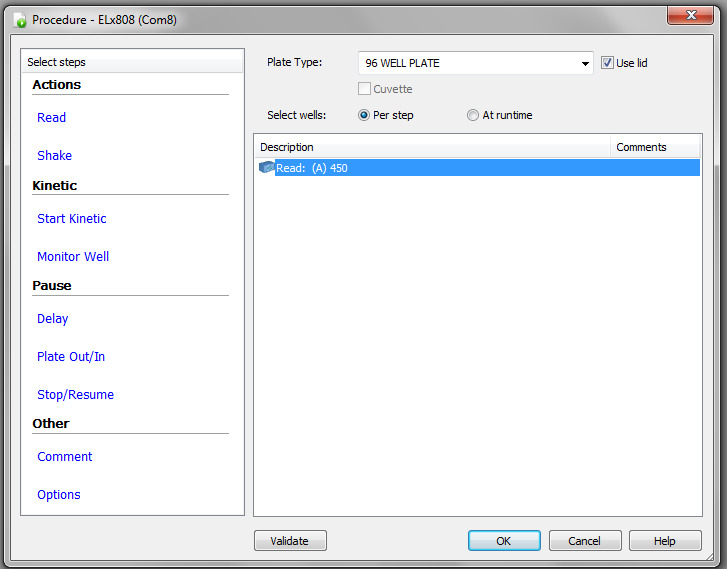
Figure 7. Plate Layout step on the Gen 5 software.
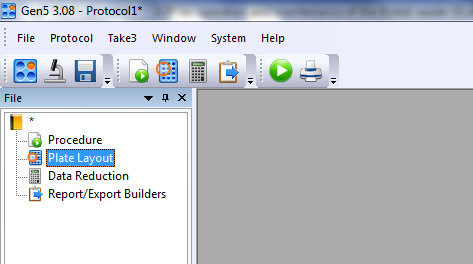
Figure 8. Selection of different well types according to the ELISA plate plan (i.e., Figure 1).
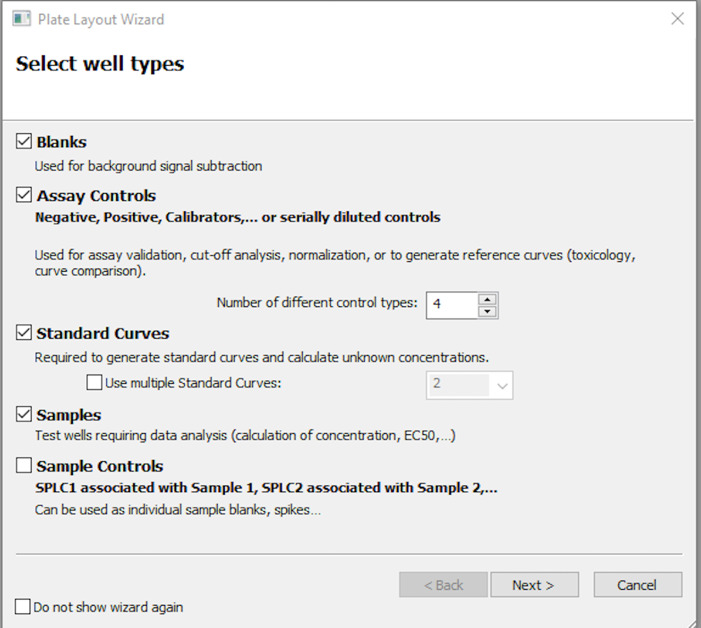
Figure 9. Information to be entered for the blank wells in the plate layout window.
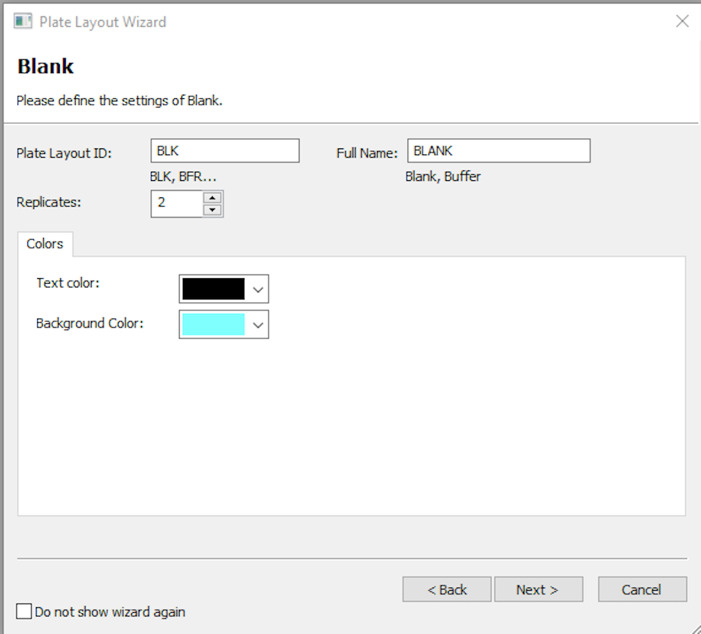
Figure 10. Information to be entered for the standard wells in the plate layout window.
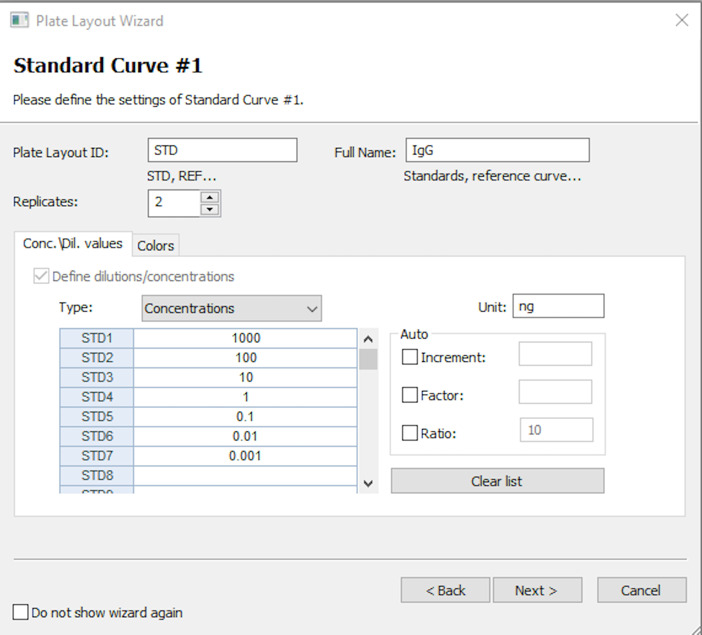
Figure 11. Plate layout on which you will highlight the different wells of the ELISA plate.
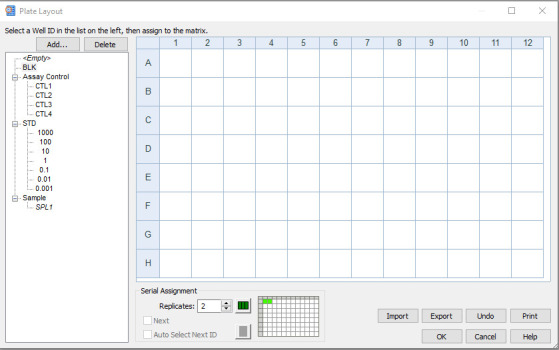
Figure 12. Plate layout window, accurately showing the positions of the different well types of the ELISA plate.
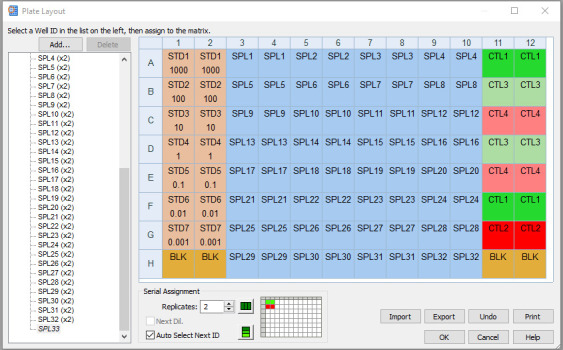
Figure 13. Data reduction tools in the Gen 5 software protocol.
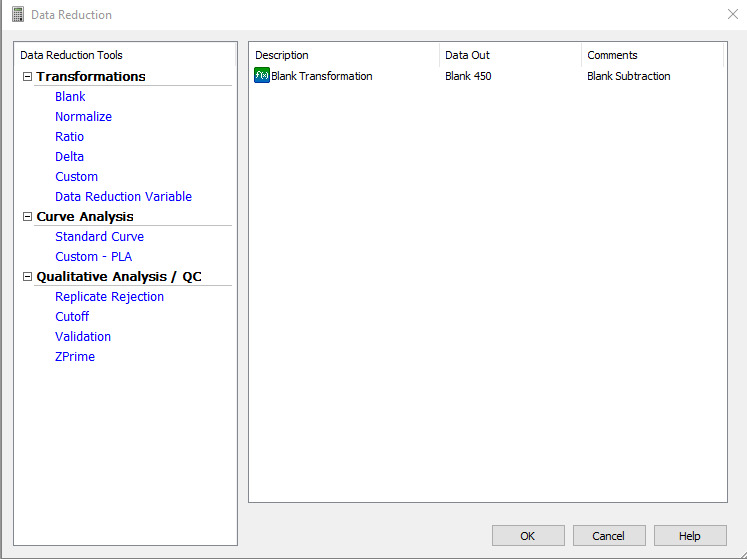
Figure 14. Standard curve requirements for the ELISA plate readout.
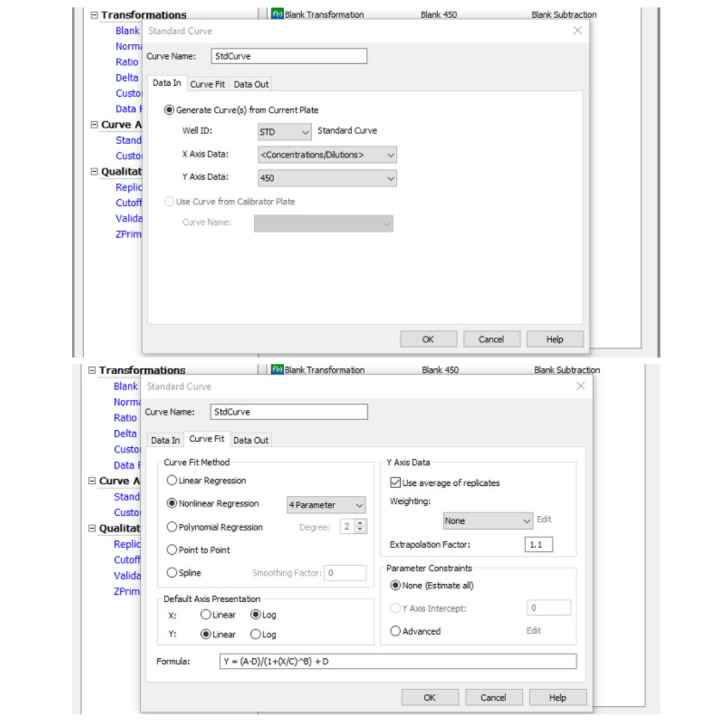
Figure 15. Report/Export Builders window.
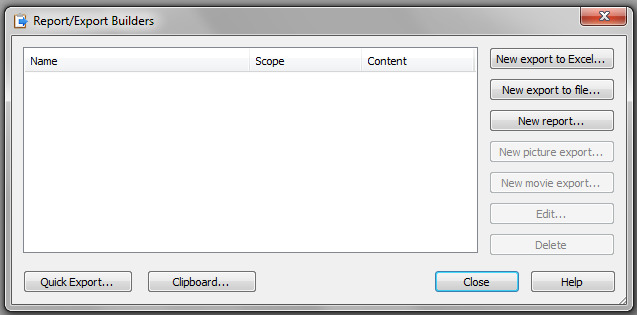
Figure 16. Contents of report output, Export 1.
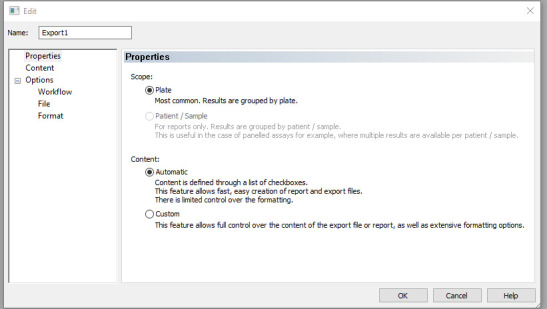
Figure 17. Different parameters under the context subheading of Lab report.
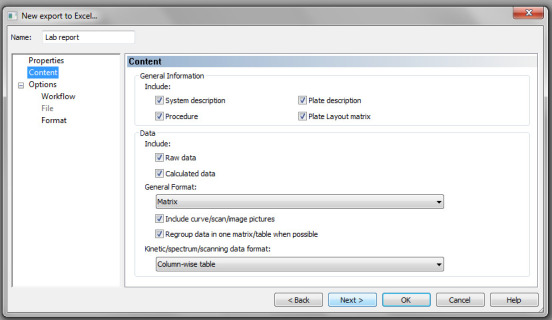
Figure 18. Workflow parameters.
Figure 19. Fields for entering the file name and location where you would like your plate readouts to be stored.
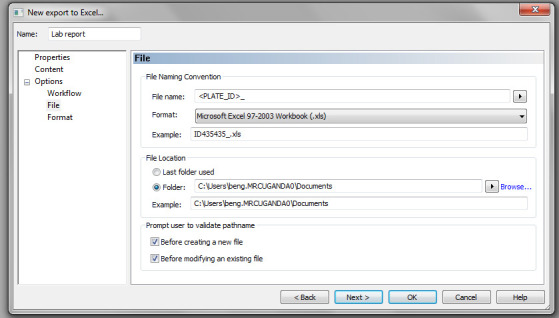
Figure 20. Custom parameter when creating a customised protocol.
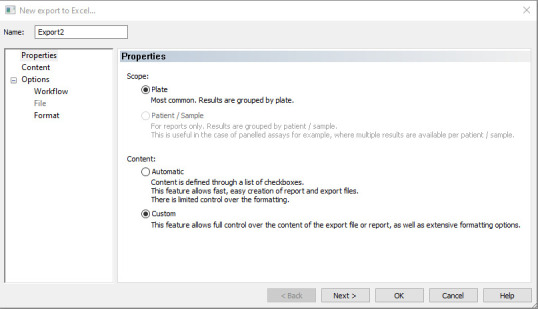
Figure 21. Custom toolbar in an Excel worksheet.
Figure 22. Task manager box, highlighting the Experiments section from the options provided.
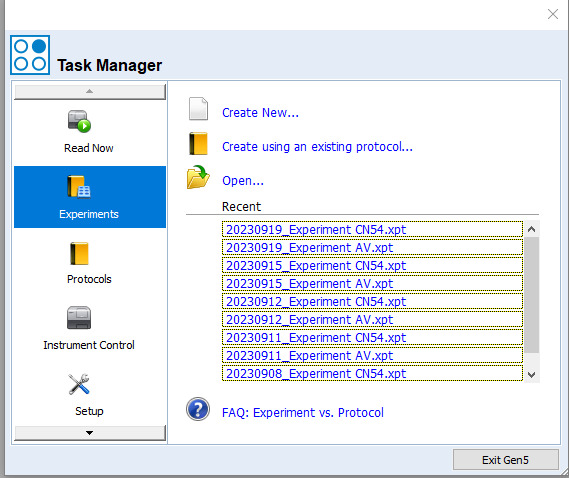
Figure 23. Menu tree under a new experiment.
The pop-up window is used to enter the plate information for each plate, e.g., in this figure, enter the Plate ID for Plate 1.
Figure 24. Sample IDS parameter from the drop-down menu.
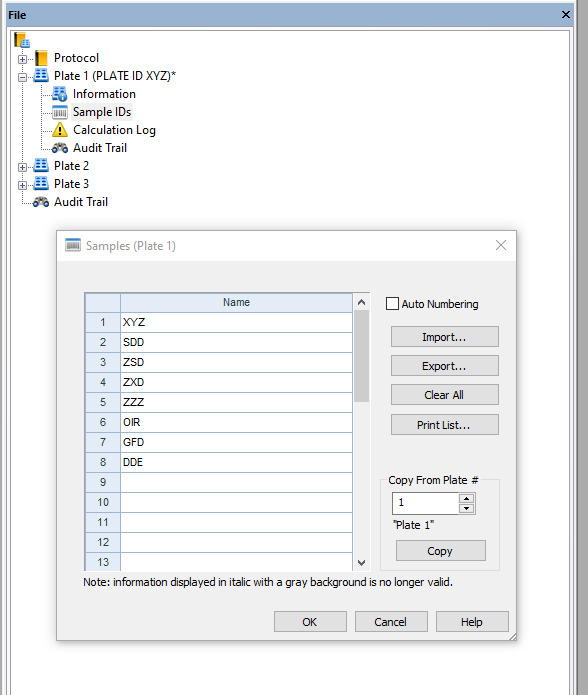
Figure 25. Window where you select the wells to be read using the ELISA reader.
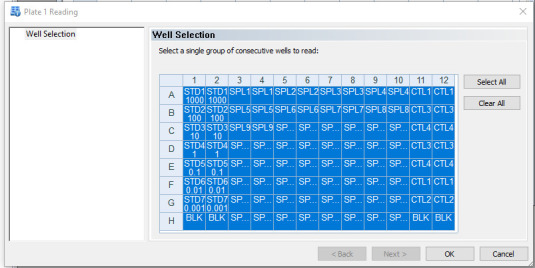
Figure 26. Instructions to load the plate onto the carrier in the ELISA reader.
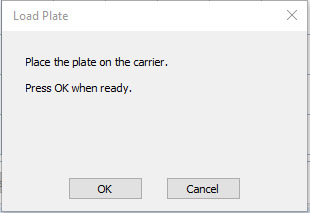
Figure 27. Example standard curves produced during measurement of IgG optical densities (450 nm) and concentrations in serum/plasma samples.
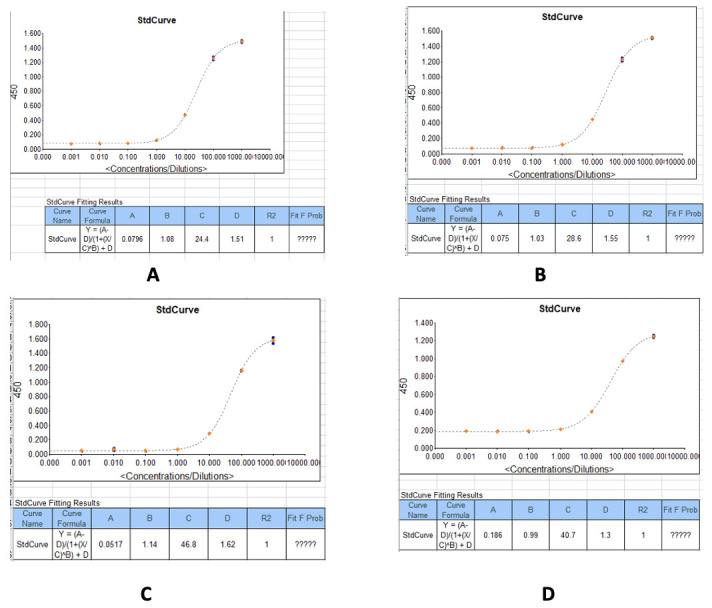
(A) IgG concentrations against the recombinant SARS-CoV-2 Nucleocapsid protein. (B) IgG concentrations against the recombinant SARS-CoV-2 Spike protein. (C) IgG concentrations against the SARS-CoV-2 receptor binding domain (RBD) (S1) S-protein. (D) IgG concentrations against the recombinant SARS-CoV-2 Spike S2 Subunit protein.
Figure 28. Example standard curves produced during measurement of IgM optical densities (450 nm) and concentrations in serum/plasma samples.
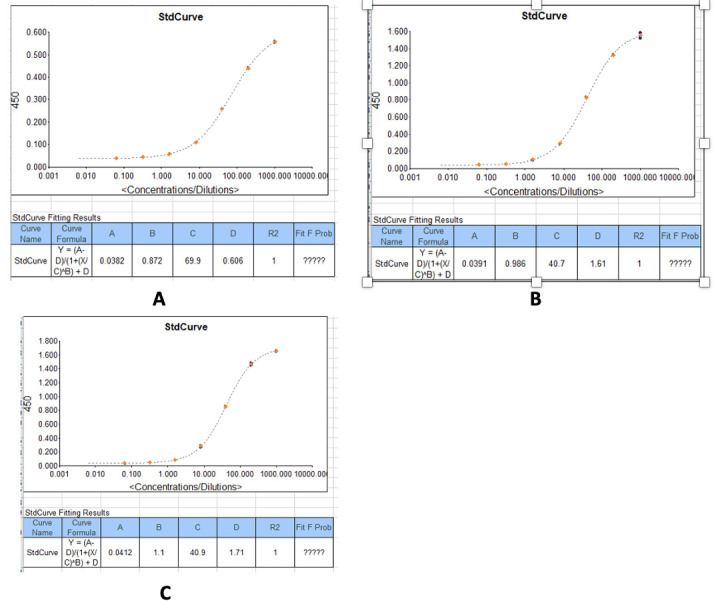
(A) IgM concentrations against the recombinant SARS-CoV-2 Nucleocapsid protein. (B) IgM concentrations against the recombinant SARS-CoV-2 Spike protein. (C) IgM concentrations against the SARS-CoV-2 receptor binding domain (RBD) (S1) S-protein.
Figure 29. Example standard curves produced during measurement of IgA optical densities (450 nm) and concentrations in serum/plasma samples.
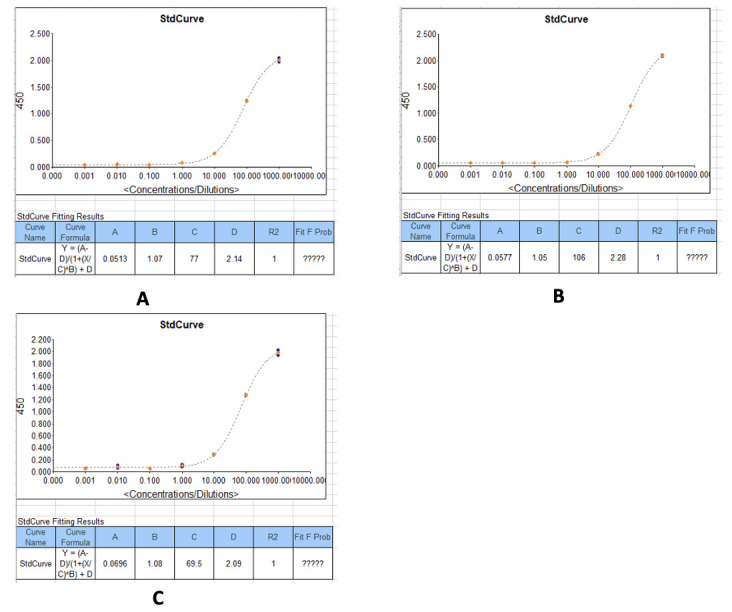
(A) IgA concentrations against the recombinant SARS-CoV-2 Nucleocapsid protein. (B) IgA concentrations against the recombinant SARS-CoV-2 Spike protein. (C) IgA concentrations against the SARS-CoV-2 receptor binding domain (RBD)(S1) S-protein.
Data analysis
In this step, data can be analysed using GraphPad Prism version 9.3 or R Version 4.3.1 or higher. Net optical densities and concentrations are determined.
-
Copy the plate reader output onto one Excel sheet
If more than one plate is being run at a time, merge the reader data from each plate and copy onto one Excel sheet, clearly labelling each set of data with its plate information.
-
Calculate the net OD values
To obtain the net optical density at 450 nm, subtract the mean OD of the blank wells from the OD of each sample for each plate. This can be done using the code snippet shown in Figure 30. Alternatively, this can be specified in the Gen5 protocol to give net OD values as the raw data.
-
Calculate the net concentration values
To obtain the net antibody concentrations, multiply the given concentration from the plate reader data by the sample dilution factor. This can be done using the code snippet shown in Figure 30.
Note: Because of assay LOD and LOQ, some samples will not have antibody concentrations in the plate readout and this “?????” might appear instead of their concentrations. However, all samples for each plate should have optical densities.
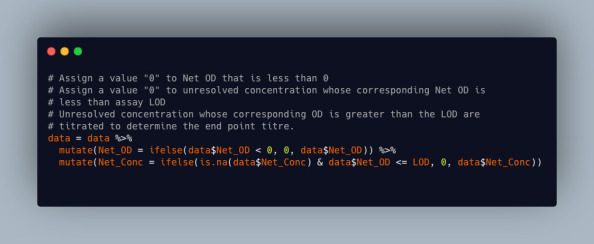
Using the R software mentioned above, for the samples without concentrations (i.e., those with “?????”), those whose net OD is below the assay LOD are assigned a “0” and those above the assay LOQ should be titrated to determine their end-point titer/concentration. This can be done using the code snippet shown in Figure 31.
A detailed description to determine assay cutoff values, as well as assay LOQ and LOD, using the direct capture by coated antigen and indirect estimation by coated anti-kappa and lambda antibodies is published in Oluka et al. (2023) [1].
Figure 30. Code snippet showing how to calculate net OD values and net concentration values.
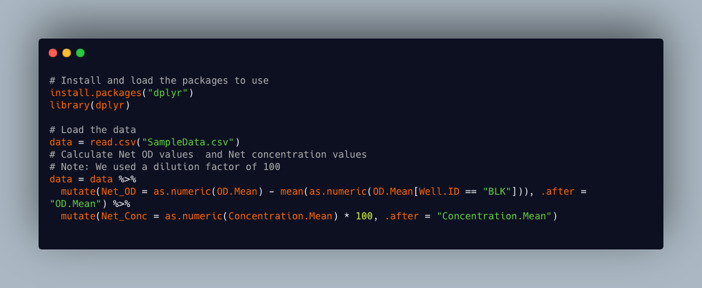
Figure 31. Code snippet showing R script for handling samples that are below or above the limit of detection (LOD).
Validation of protocol
This protocol has been validated and used in the following research article(s):
Oluka GK, Namubiru P, Kato L, Ankunda V, Gombe B, Cotten M; COVID-19 Immunoprofiling Team; Musenero M, Kaleebu P, Fox J, Serwanga J. Optimisation and Validation of a conventional ELISA and cut-offs for detecting and quantifying anti-SARS-CoV-2 Spike, RBD, and Nucleoprotein IgG, IgM, and IgA antibodies in Uganda. Front Immunol. 2023 Mar 14; 14: 1113194. doi: 10.3389/fimmu.2023.1113194. PMID: 36999017; PMCID: PMC10045470.
Serwanga J, Ankunda V, Sembera J, Kato L, Oluka GK, Baine C, Odoch G, Kayiwa J, Auma BO, Jjuuko M, Nsereko C, Cotten M, Onyachi N, Muwanga M, Lutalo T, Fox J, Musenero M, Kaleebu P; COVID-19 Immunoprofiling Team. Rapid, early, and potent Spike-directed IgG, IgM, and IgA distinguish asymptomatic from mildly symptomatic COVID-19 in Uganda, with IgG persisting for 28 months. Front Immunol. 2023 Mar 16; 14: 1152522. doi: 10.3389/fimmu.2023.1152522. PMID: 37006272; PMCID: PMC10060567.
Nantambi H, Sembera J, Ankunda V, Ssali I, Kalyebi AW, Oluka GK, Kato L, Ubaldo B, Kibengo F, Katende JS, Gombe B, Baine C, Odoch G, Mugaba S, Sande OJ; COVID-19 Immunoprofiling Team; Kaleebu P, Serwanga J. Pre-pandemic SARS-CoV-2-specific IFN-γ and antibody responses were low in Ugandan samples and significantly reduced in HIV-positive specimens. Front Immunol. 2023 Apr 19; 14: 1148877. doi: 10.3389/fimmu.2023.1148877. PMID: 37153598; PMCID: PMC10154590.
Serwanga J, Baine C, Mugaba S, Ankunda V, Auma BO, Oluka GK, Kato L, Kitabye I, Sembera J, Odoch G, Ejou P, Nalumansi A, Gombe B, Musenero M, Kaleebu P. Seroprevalence and durability of antibody responses to AstraZeneca vaccination in Ugandans with prior mild or asymptomatic COVID-19: implications for vaccine policy. Front Immunol. 2023 May 2; 14: 1183983. doi: 10.3389/fimmu.2023.1183983. PMID: 37205095; PMCID: PMC10187141.
Reliability, reproducibility, and robustness:
In the validation of the protocol, all samples were run in duplicates and a coefficient of variation ≤25% was ensured. The standard curves conformed to a goodness of fit of R2 ≥ 0.9 (Figure 5, Table 6, Figure 7) [1].
SARS-CoV-2 specific positive control antibodies CR3022 and CR3009 as well as local plasma samples of known seropositivity were used to monitor the consistency of the assay using Levey-Jennings curves (Figure 8A and 8B). The ODs were consistently within a CV of 25% and two standard deviations of the mean, in line with recommendations of the Westgard-Sigma rules [1].
Assays were repeated on different days and by different operators to ascertain inter-assay and inter-operator precision; all tests conformed to a CV ≤ 25% (Figure 5) [1]
There was inter-site validation of the protocol between the Imperial College London and the Uganda Virus Research Institute, where the same set of samples were tested, and comparable results were obtained as shown in Figure 9 [1].
The above results from the validation of the protocol are published in the open-access article by Oluka et al. 2023 [1]. https://doi.org/10.3389/fimmu.2023.1113194.
General notes and troubleshooting
Limitations
This ELISA protocol is subject to changes in OD values due to environmental temperature fluctuations in the lab and changes in reagent batches such as the coating antigens and secondary antibodies used in the assay.
To ensure assay consistency with different reagent batches, coat ELISA plates with different batches of an antigen, e.g., a newly purchased spike antigen being compared with a spike antigen currently in use, following the procedure described above.
Run a set of both known positive and negative serum/plasma samples on each of these plates to obtain two sets of results from these plates.
-
Analyse the data using a scatter plot to determine the correlation coefficient and see if it is significant. One can also use a Wilkson test for matched pairs to give a p-value, which will determine if the distribution is the same in both lots. If the p-value is less than 0.05, we conclude that there is a significant difference between the two groups.
The change in the antigenic determinants of the target pathogen requires new assay validation to ensure consistency and generation of new assay quality controls for use.
Troubleshooting
Problem 1: Plates have a high background in the blank wells.
Possible cause(s): Contaminant particles in air or buffer used, plates left too long before reading, or substrate incubation temperature too high.
Solution(s): Coat plates in a biosafety cabinet. Prepare assay buffer in clean environment. Add substrate at room temperature (23 °C) and read plates promptly after adding substrate.
Problem 2: %CV for OD values of sample replicates above 25.
Possible cause(s): Inconsistent pipetting during sample dilution. Bubbles in wells when reading.
Solution(s): Use properly calibrated pipettes and avoid distractions during sample dilution. Ensure controlled up and down pipetting during sample addition. Avoid generating bubbles when adding substrate or stop solution.
Problem 3: Non-sigmoid standard curve.
Possible cause(s): Improper dilution of standards. Contamination of standards. Deterioration of standards.
Solution(s): Follow closely the dilution steps performed according to the protocol. Use appropriate diluent as blank. Minimise freeze-thaw cycles for the standards and change aliquots after a week.
Problem 4: Weak signal for standards or strong positive controls.
Possible cause(s): Deteriorated antibodies in the sample or standards.
Solution(s): Prepare aliquots that should be used within a week and stored at -20 °C.
Problem 5: Unresolved OD values for sample replicate wells.
Possible cause(s): High titres of target antibodies in the samples tested above the quantifiable range for the standard.
Solution(s): Titrate the unresolved sample in triplicates with 2-fold or 3-fold dilution series on a new plate or test unresolved samples at a higher dilution on another plate.
Problem 6: Inconsistent OD values for negative control samples above expected range.
Possible cause(s): Contamination of controls or assay buffer during preparation.
Solution(s): Prepare controls in clean vials.
Problem 7: Very low or very high signals.
Possible causes: Disregarding the incubation periods and temperature instructions at each step of the assay, contamination, cross-reactivity, poor washing of the plates.
Solution(s): If the high signal is uniform within the whole plate:
If it is a single sample and not the whole plate showing high signals, one should consider that that particular sample has a high antibody concentration indicated by the high signal.
One should ensure that the antibodies used in the assay are specific to the target and not cross-reacting with other substances in the sample.
It is advisable that this protocol be optimised multiple times in the lab to ensure consistency and reproducibility of results before it is implemented.
In case the signal is too low:
One can increase the enzyme-substrate incubation time.
One should reevaluate the wash steps to ensure that they are thorough to remove unbound substances, which could interfere with the signal.
Acknowledgments
The authors acknowledge funding by the government of Uganda through the Science, Technology, and Innovation Secretariat-Office of the President (STI-OP), grant number: MOSTI-PRESIDE-COVID-19-2020/15. Validation of the protocol was done at the MRC/UVRI and LSHTM Uganda Research Unit, which is jointly funded by the UK Medical Research Council (MRC) part of UK Research and Innovation (UKRI) and the UK Foreign, Commonwealth and Development Office (FCDO) under the MRC/FCDO Concordat agreement and is also part of the EDCTP2 programme supported by the European Union.
The project in which this protocol has been used is part of the EDCTP2 program supported by the European Union (grant number RIA2020EF-3008-COVAB). Initial specimen collections for the protocol validation were supported by the University of Glasgow GCRF COVID-19 Rapid Response Fund (Uganda COVID-19 Serological Responses UGANCOSER).
This protocol is based on research funded in part by the Bill and Melinda Gates Foundation through the GIISER Uganda Grant Agreement Investment ID INV-036306. The findings and conclusions contained within are those of the authors and do not necessarily reflect positions or policies of the Bill and Melinda Gates Foundation.
The following reagent was produced under HHSN272201400008C and obtained through BEI Resources, NIAID, NIH: Monoclonal Anti-SARS Coronavirus Recombinant Human Antibody, Clone CR3022 (produced in HEK293 cells), NR-52481. The following reagent was obtained through BEI Resources, NIAID, NIH: Monoclonal Anti-SARS Coronavirus Recombinant Human IgG1, Clone CR3022 (produced in Nicotiana benthamiana), NR-52392. The nucleoprotein mAb CR3009 (NIBSC Repository, Product No. 101011) used as a positive control was obtained from the Centre for AIDS Reagents, NIBSC, UK. The first WHO international standard for SARS-CoV-2, RN 20/136, Immunoglobulin, human, S321534 was obtained from the Centre for AIDS Reagents, NIBSC, UK. The first WHO international standard for SARS-CoV-2, Immunoglobulin, human, 20/B770 was obtained from the Centre for AIDS Reagents, NIBSC, UK. A mammalian expression plasmid for the RBD of SARS-CoV-2 was a kind donation by the Doores laboratory at King’s College London. Specimens used in the inter-site cross-validation for the protocol were obtained from Dr. Hannah Cheeseman’s Laboratory at Imperial College London, United Kingdom. 696. This protocol has been validated as outlined in a prior publication [1] and used in multiple subsequent studies [7, 9–11].
Competing interests
The authors declare that this protocol was developed in the absence of any commercial or financial relationships that could be construed as a potential conflict of interest.
Ethical considerations
The use of human participants to obtain samples used in the development of this protocol was reviewed and approved by the Uganda Virus Research Institute (UVRI) Research and Ethics Committee (Ref: GC/127/833) and the Uganda National Council of Science and Technology (Ref: HS637ES). The patients/participants provided their written informed consent to participate.
Citation
Readers should cite both the Bio-protocol article and the original research article where this protocol was used.
Q&A
Post your question about this protocol in Q&A and get help from the authors of the protocol and some of its users.
References
- 1.Oluka G. K., Namubiru P., Kato L., Ankunda V., Gombe B., Cotten M., Musenero M., Kaleebu P., Fox J., Serwanga J., et al.(2023). Optimisation and Validation of a conventional ELISA and cut-offs for detecting and quantifying anti-SARS-CoV-2 Spike, RBD, and Nucleoprotein IgG, IgM, and IgA antibodies in Uganda. Front. Immunol. 14: e1113194. [DOI] [PMC free article] [PubMed] [Google Scholar]
- 2.Faizo A. A., Alandijany T. A., Abbas A. T., Sohrab S. S., El-Kafrawy S. A., Tolah A. M., Hassan A. M. and Azhar E. I.(2021). A Reliable Indirect ELISA Protocol for Detection of Human Antibodies Directed to SARS-CoV-2 NP Protein. Diagnostics 11(5): 825. [DOI] [PMC free article] [PubMed] [Google Scholar]
- 3.Alshami A., Al Attas R., Anan H., Al Maghrabi A., Ghandorah S., Mohammed A., Alhalimi A., Al-Jishi J. and Alqahtani H.(2021). Durability of Antibody Responses to SARS-CoV-2 Infection and Its Relationship to Disease Severity Assessed Using a Commercially Available Assay. Front. Microbiol. 12: e770727. [DOI] [PMC free article] [PubMed] [Google Scholar]
- 4.Marchi S., Viviani S., Remarque E. J., Ruello A., Bombardieri E., Bollati V., Milani G. P., Manenti A., Lapini G., Rebuffat A., et al.(2021). Characterization of antibody response in asymptomatic and symptomatic SARS-CoV-2 infection. PLoS One 16(7): e0253977. [DOI] [PMC free article] [PubMed] [Google Scholar]
- 5.Balachandran H., Phetsouphanh C., Agapiou D., Adhikari A., Rodrigo C., Hammoud M., Shrestha L. B., Keoshkerian E., Gupta M., Turville S., et al.(2022). Maintenance of broad neutralizing antibodies and memory B cells 1 year post-infection is predicted by SARS-CoV-2-specific CD4+ T cell responses. Cell Rep. 38(6): 110345. [DOI] [PMC free article] [PubMed] [Google Scholar]
- 6.Abraha I., Eusebi P., Germani A., Pasquarelli E., Pascolini S., Antonietti R., Argenti S., Fioravanti A., Martini E., Aristei L., et al.(2022). Temporal trends and differences of SARS-CoV-2-specific antibody responses in symptomatic and asymptomatic subjects: a longitudinal study from Umbria in Italy. BMJ Open 12(7): e056370. [DOI] [PMC free article] [PubMed] [Google Scholar]
- 7.Serwanga J., Ankunda V., Sembera J., Kato L., Oluka G. K., Baine C., Odoch G., Kayiwa J., Auma B. O., Jjuuko M., et al.(2023). Rapid, early, and potent Spike-directed IgG, IgM, and IgA distinguish asymptomatic from mildly symptomatic COVID-19 in Uganda, with IgG persisting for 28 months. Front. Immunol. 14: e1152522. [DOI] [PMC free article] [PubMed] [Google Scholar]
- 8.Kitonsa J., Kamacooko O., Ruzagira E., Nambaziira F., Abaasa A., Serwanga J., Gombe B., Lunkuse J., Naluyinda H., Tukamwesiga N., et al.(2023). A phase I COVID-19 vaccine trial among SARS-CoV-2 seronegative and seropositive individuals in Uganda utilizing a self-amplifying RNA vaccine platform: Screening and enrollment experiences. Hum. Vaccin. Immunother. 19(2): e2240690. [DOI] [PMC free article] [PubMed] [Google Scholar]
- 9.Serwanga J., Baine C., Mugaba S., Ankunda V., Auma B. O., Oluka G. K., Kato L., Kitabye I., Sembera J., Odoch G., et al.(2023). Seroprevalence and durability of antibody responses to AstraZeneca vaccination in Ugandans with prior mild or asymptomatic COVID-19: implications for vaccine policy. Front. Immunol. 14: e1183983. [DOI] [PMC free article] [PubMed] [Google Scholar]
- 10.Nantambi H., Sembera J., Ankunda V., Ssali I., Kalyebi A. W., Oluka G. K., Kato L., Ubaldo B., Kibengo F., Katende J. S., et al.(2023). Pre-pandemic SARS-CoV-2-specific IFN-γ and antibody responses were low in Ugandan samples and significantly reduced in HIV-positive specimens. Front. Immunol. 14: e1148877. [DOI] [PMC free article] [PubMed] [Google Scholar]
- 11.Ssali I., Mugaba S., Watelo A. K., Bemanzi J., Katende J. S., Oluka G. K., Ankunda V., Baine C., Kato L., Onyachi N., et al.(2023). Spike protein is a key target for stronger and more persistent T-cell responses—a study of mild and asymptomatic SARS-CoV-2 infection. Int. J. Infect. Dis. 136: 49-56. [DOI] [PubMed] [Google Scholar]


