Abstract
The African killifish Nothobranchius furzeri is an attractive research organism for regeneration- and aging-related studies due to its remarkably short generation time and rapid aging. Dynamic changes in cell proliferation are an essential biological process involved in development, regeneration, and aging. Quantifying the dynamics of cell proliferation in these contexts facilitates the elucidation of the attendant underlying mechanisms. Whole-mount and cryosectioning sample preparation are the preferred approaches to investigate the distribution of cellular structures, cell–cell communication, and spatial gene expression within tissues. Using African killifish caudal fin regeneration as an example, we describe an efficient and detailed protocol to investigate cell proliferation dynamics in both space and time during caudal fin regeneration. The quantification of cell proliferation was achieved through high-resolution immunofluorescence of the proliferation marker Phospho-Histone H3 (H3P). We focused on the characterization of epithelial and mesenchymal proliferation in three-dimensional space at two regeneration time points. Our protocol provides a reliable tool for comparing cell proliferation under different biological contexts.
Key features
• Elaborates in detail the method used by Wang et al. (2020) to quantify whole-organ mitotic events during tail fin regeneration in vertebrates.
• Enables proliferation analysis of millimeter-sized homeostatic and regenerating tissues.
• Three-day alternative method to whole mount using cryosections.
• Allows automatic quantification using ImageJ macros and R scripts.
Keywords: Proliferation, African killifish, Fin regeneration, Whole mount, Cryosections, Immunofluorescence, Fluorescence quantification
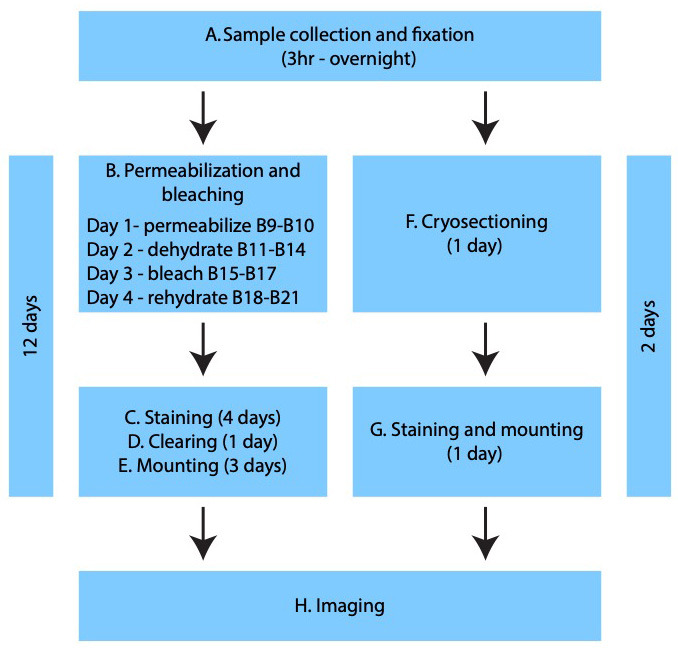
Graphical overview
Background
Understanding the genetic and molecular basis of post-embryonic development in vertebrates, such as regeneration and aging, are long-standing quests in biology. One of the limiting steps in addressing such questions is the relative long generation time of most existing research organisms. As a result, identifying and characterizing phenotypes associated with adult stages is much more time-consuming when compared to embryonic stages. The emerging research organism African killifish, Nothobranchius furzeri, has received increasing attention in the fields of regeneration and aging due to its remarkable biology, including fast sexual maturation time and rapid aging (Genade et al., 2005; Harel et al., 2015; Hu et al., 2020; Wang et al., 2020). Quantifying the dynamic changes of cell proliferation is a critical procedure that has been frequently conducted in many different animal models (Kang and Sánchez Alvarado, 2009; Poleo et al., 2001; Wang et al., 2011).
Currently, cryosection and whole-mount sample preparations are efficient and generally accepted approaches to examine the dynamics of cell proliferation associated with a biological process of interest. The former allows for a quick analysis of a single plane in Z along the tissues, and high-resolution imaging of deep tissue structures is possible using this technique. In contrast, the whole-mount approach provides spatial information in 3D that is missing in cryosections at the expense of reduced ability for high-resolution imaging (usually requires short working distance lenses) due to the thickness of tested samples. Further, whole-mount samples retain all information on cell–cell interactions that are only apparent when looking at the whole structure. Integration of the two approaches makes it possible to characterize local features at high-resolution and perform three-dimensional analysis of biological markers of interest.
Phospho-histone 3 (H3P) has been widely used as a proliferation marker because this post-translational modification is deeply conserved across many species with a large phylogenetic distance (Newmark and Sánchez Alvarado, 2000; Nielsen et al., 2013; Wang et al., 2011). The epitope recognized by commercially available antibodies tends to be cross-reactive among wide ranges of species, making H3P the go-to mitosis marker in many research laboratories. In contrast to other proliferation markers such as Ki67 or EdU, H3P displays higher signal to noise ratios and its sparsity within the tissue allows for robust nuclei segmentation. In this protocol, we use the quantification of cell proliferation in killifish fin regeneration as an example to illustrate the challenges and discuss tips for successful H3P immunofluorescence on both cryosections and whole mounts in terms of tissue penetration, pigment bleaching, clearing, imaging, and data processing.
Materials and reagents
Common between whole mount and cryosections
16% Paraformaldehyde solution (Electron Microscopy Sciences, catalog number: 15710)
Methanol (MetOH) (Sigma-Aldrich, catalog number: 34860)
Monoclonal mouse antibody anti-E-Cadherin (Monoclonal Ecad Ab) (BD Biosciences, catalog number: 610182)
Monoclonal rabbit antibody anti-Phospho-Histone H3 (Ser10) (D2C8) (Monoclonal H3P Ab) (Cell Signaling Technology, catalog number: 3377S)
Polyclonal goat antibody anti-Rabbit IgG H&L Alexa Fluor 647 preadsorbed (Abcam, catalog number: ab150083) or F(ab')2-Goat anti-Rabbit IgG (H+L) Cross-Adsorbed Secondary Antibody, Alexa Fluor Plus 647 (Thermo Fisher, catalog number: A48285)
Polyclonal goat antibody anti-Mouse IgG H&L Alexa Fluor 555 preadsorbed (Abcam, catalog number: ab150118) or F(ab')2-Goat anti-Mouse IgG (H+L) Cross-Adsorbed Secondary Antibody, Alexa FluorTM Plus 555 (Thermo Fisher, catalog number: A48287)
TWEEN® 20 (Sigma-Aldrich, catalog number: P1379)
100 mm Petri dish (Fisher Scientific, catalog number: FB0875712)
Horse serum, heat inactivated (Thermo Fisher, catalog number: 26050070)
Goat serum (Thermo Fisher, catalog number: 16210072)
Fetal bovine serum (FBS) (Thermo Fisher, catalog number: A5256801)
Dimethyl sulfoxide (DMSO) (Sigma-Aldrich, catalog number: 472301)
Sodium azide (NaN3) (Sigma-Aldrich, catalog number: S2002)
Roche western blocking reagent solution (Sigma-Aldrich, catalog number: 11921673001)
Glycerol (Sigma-Aldrich, catalog number: G7893)
YOYO-1 iodide (491/509), 1 mM solution in DMSO (Thermo Fisher, catalog number: Y3601)
30 mL polypropylene jar (Fisher Scientific, catalog number: 02-891A)
MS-222 (Sigma-Aldrich, catalog number: E10521)
Formic acid (Sigma-Aldrich, catalog number: 695076)
Sodium chloride (NaCl) (Sigma-Aldrich, catalog number: S5886)
Potassium chloride (KCl) (Sigma-Aldrich, catalog number: P3911)
Sodium phosphate dibasic (Na2HPO4) (Sigma-Aldrich, catalog number: S9763)
Potassium phosphate monobasic (KH2PO4) (Sigma-Aldrich, catalog number: P5655)
500 mL bottle top vacuum filter, 0.22 µm pore (Corning, catalog number: 431118)
Whole mount
60 mm Petri dish (Fisher Scientific, catalog number: 08-757-100B)
Dumont forceps (Fisher Scientific, catalog number: NC9518792)
Sterile 50 mL conical tubes (Fisher Scientific, catalog number: 14-432-22)
10 mL pipette (Fisher Scientific, catalog number: 13-678-12E)
Razor blade (Fisher Scientific, catalog number: 12-640)
Transfer pipette (Fisher Scientific, catalog number: 13-711-5B)
Ibidi USA µ-dish coverslip bottom 35 mm high Petri dishes (Fisher Scientific, catalog number: 50-305-805)
White lamp with goose neck (Ikea JANSJÖ 3W lamp)
DER 332 (Sigma-Aldrich, catalog number: 31185)
DER 736 (Sigma-Aldrich, catalog number: 31191)
Isophorone diamine (IPDA) (Sigma-Aldrich, catalog number: 118184)
Hydrogen peroxide (H2O2) solution 30% (w/w) in H2O (Sigma-Aldrich, catalog number: H1009)
Dichloromethane (DCM) (Sigma-Aldrich, catalog number: 270997)
Dibenzyl ether (DBE) (Sigma-Aldrich, catalog number: 33630)
Corning 10 mL polystyrene serological pipette (Fisher Scientific, catalog number: 07-200-12)
Cryosections
30% Sucrose solution (Sigma-Aldrich, catalog number: S0389). Store the solution at 4 °C
FalconTM 15 mL conical centrifuge tubes (Fisher Scientific, catalog number: 14-959-49B)
FisherbrandTM disposable base molds (Thermo Fisher, catalog number: 22-363-552)
SuperFrost Plus microscope slides (Avantor, VWRI631-0108)
Super PAP pen (Thermo Fisher, catalog number: 008899)
TritonTM X-100 solution (Sigma-Aldrich, catalog number: 93443)
-
Reagents for bleaching:
H2O2 (Sigma-Aldrich, catalog number: 88597)
Formamide (Sigma-Aldrich, catalog number: 11814320001)
Optimal cutting temperature (OCT) embedding compound (SAKURA, catalog number: 4583)
TrueBlack lipofuscin (Biotium, catalog number: 23007)
ProLong Gold antifade mountant (Thermo Fisher Scientific, catalog number: P36930)
Tsugar memory miniature paint brushes (Amazon, catalog number: ASIN B0BJQ2CC8D)
DAPI solution 1 mg/mL (Thermo Fisher Scientific, catalog number: 62248)
200 proof ethanol (Sigma-Aldrich, catalog number: E7023)
Solutions
PBS-Tween (see Recipes)
Fixative solution (see Recipes)
10% Tween 20 (see Recipes)
PBS-Tween-NaN3 (see Recipes)
123 mM NaN3 (see Recipes)
Bleaching solution (see Recipes)
25% MetOH (see Recipes)
50% MetOH (see Recipes)
75% MetOH (see Recipes)
Blocking solution (see Recipes)
Primary antibody solution (see Recipes)
Secondary antibody solution (see Recipes)
Secondary antibody stock solution (see Recipes)
Nuclear dye solution (see Recipes)
DCM-MetOH (see Recipes)
DAPI solution (see Recipes)
Phosphate-buffered saline (PBS 1× pH 7.4) (see Recipes)
TrueBlack solution (see Recipes)
Recipes
-
PBS-Tween
Reagents Final concentration Quantity Unit 10% Tween 20 (Recipe 3) 0.1% (0.89 mM) 10 mL PBS 1× pH 7.4 1× 990 mL Final volume 1,000 mL Note: No need to adjust pH.
-
Fixative solution
Reagents Final concentration Quantity Unit 16 % paraformaldehyde 4% (1.17 M) 10 mL Formic acid 0.5% (132 mM) 200 μL PBS-Tween (1×) (Recipe 1) 1× 29.8 mL Final volume 40 mL Note: No need to adjust pH.
-
10% Tween 20
Reagents Final concentration Quantity Unit Tween 20 10% (89 mM) 10 mL dH2O 90 mL Final volume 100 mL Note: Filter solution (0.22 μm pore filter). Store at 4 °C. No need to adjust pH.
-
PBS-Tween-NaN3
Reagents Final concentration Quantity Unit 123 mM NaN3 (Recipe 5) 6.15 mM 500 μL PBS-Tween (Recipe 1) 9.5 mL Final volume 10 mL Note: No need to adjust pH.
-
123 mM NaN3
Reagents Final concentration Quantity Unit NaN3 123 mM 400 mg PBS 1× pH 7.4 50 mL Final volume 50 mL Note: No need to adjust pH.
-
Bleaching solution
Reagents Final concentration Quantity Unit 30% H2O2 6% (1.95 M) 2 mL MetOH 80% (19.75 M) 8 mL Final volume 10 mL Note: Always make a fresh bleaching solution. No need to adjust pH.
-
25% MetOH
Reagents Final concentration Quantity Unit MetOH 25% (6.17 M) 12.5 mL PBS-Tween (Recipe 1) 75% 37.5 mL Final volume 50 mL Note: No need to adjust pH.
-
50% MetOH
Reagents Final concentration Quantity Unit MetOH 50% (12.35 M) 25 mL PBS-Tween (Recipe 1) 50% 25 mL Final volume 50 mL Note: No need to adjust pH.
-
75% MetOH
Reagents Final concentration Quantity Unit MetOH 75% (18.52 M) 37.5 mL PBS-Tween (Recipe 1) 25% 12.5 mL Final volume 50 mL Note: No need to adjust pH.
-
Blocking solution
Reagents Final concentration Quantity Unit Horse serum 2.5% 250 μL DMSO 5% (0.7 M) 500 μL 123 mM NaN3 (Recipe 5) 6.15 mM 500 μL Roche blocking solution 5% 500 μL Goat serum 10% 1 mL PBS-Tween (Recipe 1) 7.25 Final volume 10 mL Note: No need to adjust pH.
-
Primary antibody solution
Reagents Final concentration Quantity Unit Monoclonal H3P Ab 1 in 400 (92.5 ng/mL) 10 μL Monoclonal Ecad Ab 1 in 200 (1.25 μg/mL) 20 μL DMSO 5% (0.7 M) 200 μL 123 mM NaN3 (Recipe 5) 6.15 mM 200 μL FBS 10% 400 μL PBS-Tween (Recipe 1) 3.17 mL Final volume 4 mL Note: No need to adjust pH.
-
Secondary antibody solution
Reagents Final concentration Quantity Unit Polyclonal Anti-Mouse AF555 Ab stock (Recipe 13) 1 in 1,000 (2 μg/mL) 10 μL Polyclonal Anti-Rabbit AF647 Ab stock (Recipe 13) 1 in 800 (2.5 μg/mL) 8 μL DMSO 5% (0.7 M) 200 μL 123 mM NaN3 (Recipe 5) 6.15 mM 200 μL FBS 10% 400 μL PBS-Tween (Recipe 1) 3.182 mL Final volume 4 mL Note: No need to adjust pH.
-
Secondary antibody stock solution
Reagents Final concentration Quantity Unit Polyclonal secondary Ab 1 in 2 (1 mg/mL) 100 μL Glycerol 50% (6.78 M) 100 μL Final volume 200 μL Note: Mix well. Store at -20 °C. No need to adjust pH.
-
Nuclear dye solution
Reagents Final concentration Quantity Unit YOYO-1 Iodide 1 in 10,000 (0.1 nM) 1 μL PBS-Tween (Recipe 1) 10 mL Final volume 10 mL Note: The use of cyanine dyes with the iDISCO clearing method is preferred over DAPI (Renier et al., 2014). No need to adjust pH.
-
DCM-MetOH
Reagents Final concentration Quantity Unit MetOH 33.3% (13 M) 3 mL DCM 66.6% (10.4 M) 6 mL Final volume 9 mL Note: Always handle DCM in chemical hood. Make fresh every time. No need to adjust pH.
-
DAPI solution
Reagents Final concentration Quantity Unit DAPI 1 mg/mL 2 ng/μL (5.7 μM) 1 μL PBS-Tween (Recipe 1) 499 μL Final volume 500 μL Note: No need to adjust pH.
-
Phosphate-buffered saline (PBS 1× pH 7.4)
Reagents Final concentration Quantity Unit NaCl 136.89 mM 8 g KCl 2.68 mM 0.2 g Na2HPO4, dibasic, anhydrous 10.14 mM 1.44 g KH2PO4 1.76 mM 0.24 g dH2O 1,000 mL Final volume 1,000 mL Note: Combine ingredients. Adjust pH to 7.4 with 7 N HCl. Bring to final volume with H2O. Autoclave for 20 min.
-
TrueBlack solution
Reagents Final concentration Quantity Unit TrueBlack lipofuscin 1× 50 µL 200 proof EtOH 665 µL dH2O 285 µL Note: Combine ingredients by vortexing. No need to adjust pH.
Equipment
Shared by both whole mount and cryosections
Open air platform shaker (Eppendorf, New Brunswick, Innova 2000, catalog number: M1190-0000)
Spinning disk confocal microscope (Nikon CSU-W1) or laser scanning confocal microscope (Zeiss, model: LSM 780)
Imaging workstation (65 GB RAM)
Whole mount
Rocking shaker (Fisherbrand, Fisher Scientific, catalog number: 88-861-025)
Pipet controller (Fisherbrand, Fisher Scientific, catalog number: FB14955202)
Cryosections
Cryostat (Leica Microsystems Inc., Leica Biosystems, Leica CM1950)
SlideTray Slide Staining System (Sigma-Aldrich, Z670146-1EA)
Software and datasets
FCS Express 7 Research Edition (De Novo Software, https://denovosoftware.com/)
Procedure
-
Sample collection and fixation (both whole mount and cryosections)
Prepare 200 mL of 100–150 mg/L MS-222 in fish system water into a glass beaker. Use an appropriate net size to catch the fish from the tank and place it into the beaker. Anesthetize fish for at least 5 min and transfer them to a Petri dish using a plastic spoon to perform fin amputation.
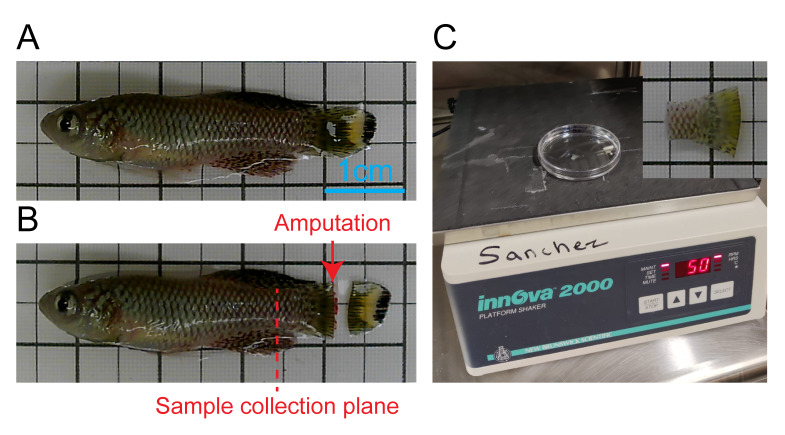
Amputate the caudal fin using a sterile razor blade at the desired position and allow for regeneration to proceed to the chosen time point (Figure 1A and 1B). For simplicity, we recommend amputations perpendicular to the anterior–posterior axis, removing 50% of the area of the fin. Most fins will show robust regeneration in a range from 30% to 70% removed area. Be aware that amputation position will change regeneration speed as reported before (Uemoto et al., 2020).
Euthanize the fish in accordance with animal care protocols approved by your research institution. We recommend the use of hypothermic shock to perform euthanasia. Immerse the fish in a sufficient volume of chilled system water (2–4 °C) to allow for locomotion. Wait until orientation and operculum movements are lost; this may vary depending on fish size and age. Leave the fish for at least 10 min following loss of orientation and cessation of operculum movement before disposing in biohazard waste bag and deposit into a biological waste freezer, following your home institution guidelines.
-
Pour 20 mL of fixative solution (see Recipe 2) into a 100 mm Petri dish.
Note: Although 0.5% formic acid may be left out of the fixative solution, its inclusion has been shown to improve penetration of whole-mount samples (Guerrero-Hernández et al., 2021).
Collect the whole tail with a fragment of the spine as shown in Figure 1C; this step is important to avoid folding or wrinkling of the fin tissue during fixation.
Transfer the sample to a Petri dish with fixative solution and incubate at 4 °C overnight or at room temperature for 2 h in an orbital shaker at 50 rpm.
Wash with 20 mL of PBS-Tween (see Recipe 1) three times for 15 min each in an orbital shaker at 50 rpm.
All steps described above are common for both whole-mount and cryosections. For cryosections, skip to section F; otherwise, continue for whole-mount preparation.
-
Permeabilization and bleaching (whole mount)
Transfer samples to a polypropylene jar.
Permeabilize samples by incubating with 10 mL of PBS-Tween-NaN3 (see Recipe 4) for 12 h in an orbital shaker at 50 rpm at room temperature.
Incubate in 10 mL of 25% MetOH (see Recipe 7) for 4 h at room temperature in an orbital shaker at 50 rpm.
Incubate in 10 mL of 50% MetOH (see Recipe 8) for 4 h at room temperature in an orbital shaker at 50 rpm.
Incubate in 10 mL of 75% MetOH (see Recipe 9) for 4 h at room temperature in an orbital shaker at 50 rpm.
Incubate in 10 mL of 100% MetOH overnight (>12 h) at room temperature in an orbital shaker at 50 rpm.
Transfer samples to a 60 mm Petri dish.
-
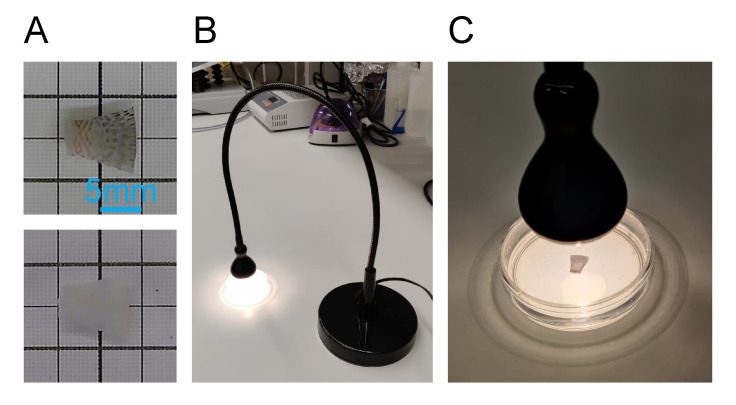
Incubate in 10 mL of bleaching solution (see Recipe 6) for 12 h at room temperature under direct exposure to white light from a white lamp with goose neck, as shown in Figure 2.
Note: Make sure the lid of the Petri dish is properly placed to avoid evaporation and that the lamp is not touching the Petri dish to avoid both heating up the sample and media evaporation.
Repeat previous step every 12 h with freshly made bleaching solution until desired bleaching; the more pigmented the sample, the more bleaching iterations this will take to dissolve all pigment. For most specimens, two steps of bleaching will suffice (1 day), and three bleaching steps should be sufficient to bleach very pigmented specimens (1.5 days).
Transfer samples to a polypropylene jar.
Incubate in 10 mL of 50% MetOH for 4 h at room temperature in an orbital shaker at 50 rpm.
Incubate in 10 mL of 25% MetOH for 4 h at room temperature in an orbital shaker at 50 rpm.
Wash with 10 mL of PBS-Tween-NaN3 overnight (>12 h) at room temperature in an orbital shaker at 50 rpm.
-
Staining (whole mount)
Incubate in 10 mL of blocking solution (see Recipe 10) for 24 h at room temperature in an orbital shaker at 50 rpm.
Wash with 20 mL of PBS-Tween twice for 15 min each at room temperature in an orbital shaker at 50 rpm.
Incubate in 10 mL of primary antibody solution (see Recipe 11) for 24 h at room temperature in an orbital shaker at 50 rpm.
Wash with 20 mL of PBS-Tween four times for 15 min each at room temperature in an orbital shaker at 50 rpm.
Incubate in 10 mL of secondary antibody solution (see Recipe 12) for 24 h at room temperature in an orbital shaker at 50 rpm.
Wash with 20 mL of PBS-Tween four times for 15 min each at room temperature in an orbital shaker at 50 rpm.
Incubate in 10 mL of nuclear dye solution (see Recipe 14) for 24 h at room temperature in an orbital shaker at 50 rpm.
Repeat the previous step until desired nuclear staining has been reached. This may be necessary when working with larger tissues or when staining multiple fins in the same container. In our experience, two rounds of nuclear staining are sufficient to fully stain large tissues with high signal to noise ratio.
-
Clearing (whole mount)
Incubate in 10 mL of 25% MetOH for 4 h at room temperature in an orbital shaker at 50 rpm.
Incubate in 10 mL of 50% MetOH for 4 h at room temperature in an orbital shaker at 50 rpm.
Incubate in 10 mL of 75% MetOH for 4 h at room temperature in an orbital shaker at 50 rpm.
Incubate in 10 mL of 100% MetOH for 4 h at room temperature in an orbital shaker at 50 rpm.
Fully stained and dehydrated samples can be stored in the freezer at -20 °C in 100% MetOH for extended periods of time (~1 month). It is key that containers are tightly sealed to avoid evaporation and drying of samples in storage.
Incubate in 10 mL of DCM-MetOH solution (see Recipe 15) for 3 h at room temperature in an orbital shaker at 50 rpm.
Incubate in 10 mL of DCM for 15 min at room temperature in an orbital shaker at 50 rpm.
Repeat the previous step at least one more time and until the sample sinks to the bottom of the jar.
Fill a 5 mL Eppendorf tube with 5 mL of DBE.
Transfer the sample to a Kimwipe tissue to remove excess of DCM, transfer to the Eppendorf tube filled with DBE, and incubate in a rocking shaker for 15 min.
Discard DBE and fill with fresh DBE. Leave the sample overnight protected from light.
-
Mounting (whole mount)
Heat up DER 332 in a 60 °C oven or water bath for at least 30 min; it should look homogeneous and much more liquid than at room temperature.
In a 50 mL conical tube, pour 23 mL of DER 332, 7 mL of DER 736, and 6 mL of IPDA. Be careful to pour all the volumes from the plastic pipette as resin may adhere to the walls of the pipette.
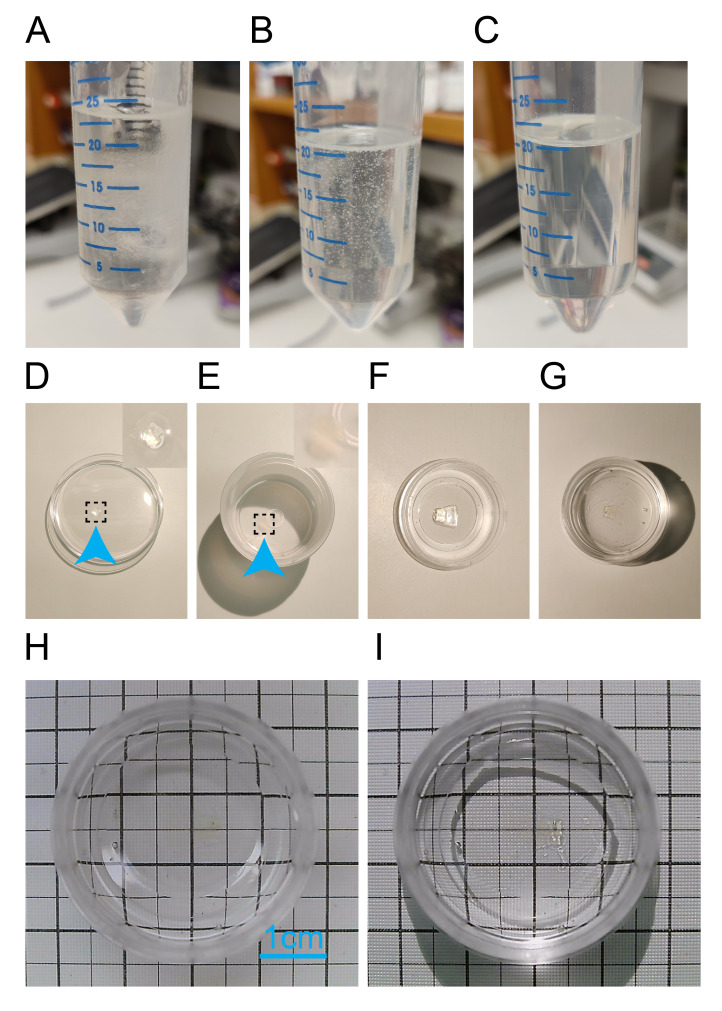
Homogenize the solution by circular hand movements until the solution is clear. You will introduce bubbles to the resin, which is expected (see Figure 3A and 3B).
Centrifuge the conical tube at ≥ 3,000× g for 10 min at room temperature. If bubbles are still present, you may increase the centrifugation speed (see Figure 3C).
With extreme care to avoid making bubbles, pour 10 mL of resin into a polypropylene jar using 10 mL pipettes with very slow pipetting motion only once. Reusing pipettes may result in bubbles being introduced to the resin.
Transfer all contents from the Eppendorf tube into a 100 mm Petri dish. The sample should be transparent after clearing and may be hard to find. If the sample did not come out when pouring the contents of the Eppendorf tube into the Petri dish, use forceps to carefully extract the sample from the tube (see Figure 3D).
With extreme care to avoid making bubbles, use forceps to pick up the sample and gently insert the sample into the resin located in the polypropylene jar (see Figure 3E).
Stir the sample very gently while holding it with forceps to wash away the DBE for a couple of turns, being extremely careful not to make bubbles.
Transfer the sample to the coverslip bottom Petri dish and, with extreme care without making bubbles, place it on top of the coverslip.
Orient the sample according to your imaging needs, pushing the sample to the bottom against the coverslip using forceps so it locates adjacent to the coverslip. This is particularly important to avoid placing the sample too far from the objective working distance.
Pour enough resin to fill the coverslip but maintain part of the sample protruding from the layer of resin. This is important because if the sample is completely submerged in resin it will float over time and get away from the coverslip (see Figure 3F).
Incubate the coverslip bottom Petri dish with the sample in a dark environment at room temperature for 12 h, covering it with the lid to prevent any dust particles from attaching to the resin.
Prepare new resin according to the procedure described above and pour enough volume to completely submerge the sample in resin (see Figure 3G).
Optional: place a coverslip on top of the resin without introducing bubbles; this may be of particular interest for transmitted light imaging.
Cure the coverslip bottom Petri dish with the sample in a dark environment at room temperature for at least three days before imaging (see Figure 3H and 3I).
-
Cryosectioning (cryosections)
Remove excess tissue to facilitate embedding and sectioning orientation.
-
Soak specimen overnight in 30% sucrose dissolved in 1× PBS at 4 °C in a 15 mL Falcon tube.
Pause point: You may leave this in 30% sucrose at 4 °C for up to a week.
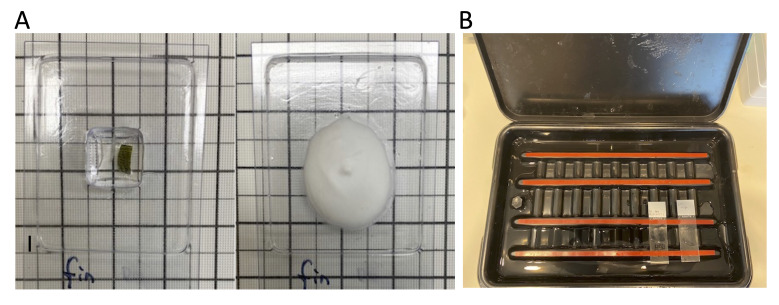
Transfer samples from 30% sucrose to a suitable tissue mold with OCT and equilibrate samples in OCT for 30 min (Figure 4A).
Transfer samples to a new tissue mold with fresh OCT and position samples according to the sectioning plane under dissecting microscope with a fine brush or probe.
-
Place the OCT containing tissue mold on dry ice or other freezing medium such as liquid nitrogen (-40 °C to -70 °C) to freeze the samples. OCT is viscous at room temperature but freezes into a solid support below -10 °C.
Note: Liquid nitrogen is not recommended because it may cause tissues or blocks to crack.
-
Cut sections 10–12 μm thick in the cryostat at approximately -18 °C. If necessary, adjust the temperature of the cryostat chamber ±3 °C according to the tissues under study.
Note: The optimal temperature for obtaining high-quality cryosections may vary from tissue to tissue. A camel hairbrush is recommended to guide the emerging section over the knife blade or flatten the curved section.
-
Within 30 s of cutting a tissue section, transfer the section with acceptable morphology to a room temperature microscope slide by touching the slide to the tissue. The tissue section will immediately melt onto the slide due to temperature differences.
Note: This must be completed within 30 s of cutting to avoid freeze drying and unwanted morphological changes of the tissue. Poly-L-lysine-coated or silanized slides improve the adherence of the section (for reference, watch 9:40–9:45 clip at https://youtu.be/tA7S75MFdNk?si=7oq-uMaaxVEi1i_e&t=580).
Quickly evaluate tissue preservation/orientation and check your slide under a dissecting microscope. Collect enough sections per slide according to the need or the size of your samples. On most cases, 10–12 sections can be accommodated on a single slide.
Allow the section to air dry onto the slide at room temperature for 2 h to maximize the adherence of collected sections to the slide.
Air-dried slides can be processed immediately, or they can be placed in a box and stored for up to a month in -20 °C. When finished sectioning, you may store the remaining unused tissue block by covering it with a layer of OCT to prevent freeze drying.
-
Staining and mounting (cryosections)
Use the SlideTray Slide Staining System to perform the following steps on the slides, as shown in Figure 4B.
Circle the tissue with Super PAP pen to avoid liquid leakage outside of the region of interest.
Wash twice with PBS-Tween (see Recipe 1) for 10 min at room temperature. Slides may come from the freezer or right after air drying.
Block with 500 μL per slide of PBS-Tween with 10% FBS and 5% DMSO for 1 h at room temperature.
Wash once with PBS-Tween for 10 min at room temperature.
Incubate with 200 µL of TrueBlack solution for 1 min at room temperature.
Wash twice with PBS (without Tween) for 10 min at room temperature.
Immunolabel with 500 μL per slide of primary antibodies (H3P, 1:400; Ecad, 1:200) PBS-Tween with 10% FBS and 5% DMSO solution for 1 h at room temperature.
Wash twice with PBS-Tween for 10 min at room temperature.
Develop fluorescent signal with 500 μL per slide of secondary antibodies (Rabbit-AF647, 1:400; Mouse-AF555, 1:500) in PBS-Tween with 10% FBS and 5% DMSO for 1 h at room temperature.
Wash three times with PBS-Tween for 10 min at room temperature.
Stain nuclei with 500 μL per slide of nuclear dye solution (see Recipe 14) for 1 h at room temperature. Alternatively, you may use DAPI solution (see Recipe 16) for 15 min at room temperature.
Wash three times with PBS-Tween for 10 min at room temperature.
Pour one drop of ProLong Gold antifade mountant.
Mount coverslip and leave the slide to cure overnight protected from the light.
-
Imaging (both whole mount and cryosections)
Place the sample on the stage and image according to the fluorophores conjugated to the secondary antibodies.
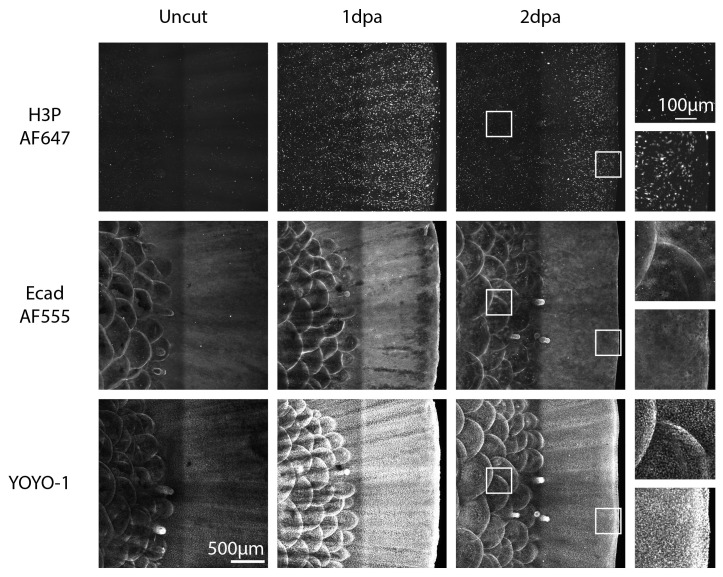
For volumetric imaging of whole-mount samples, use a 10× air objective on a Nikon spinning disk confocal microscope and collect a slice every 5 μm for the entirety of the sample (between 80 and 120 slices), making sure that the fluorescent signal does not saturate the detection range of the camera (see Figure 5).
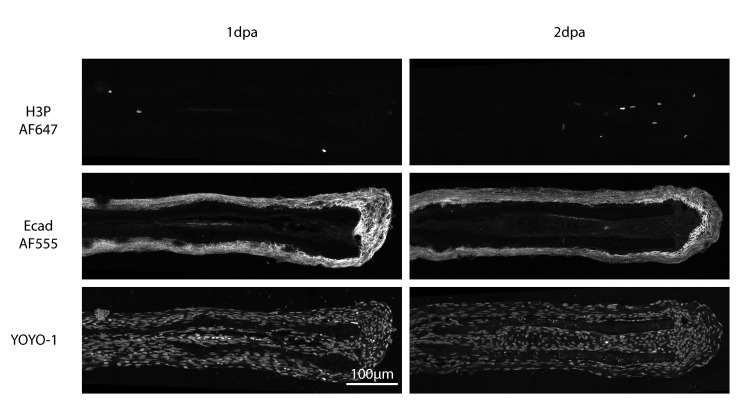
For cryosections, use a 40× immersion objective on a point laser scanning confocal microscope and collect a slice every 1 μm for the entirety of the section (10 slices, see Figure 6).
Figure 1. Caudal fin sample collection prevents folding of the tissue during fixation.
A. Anesthetized full size adult male prior to amputation. B. Caudal fin amputation and plane of future sample collection. C. Fixation step in orbital shaker placed in a cold room; a close-up picture of the sample is shown in the top right corner, where ~4 mm of the spine was included during sample collection to prevent the fin from folding during fixation.
Figure 2. Hydrogen peroxide methanol bleaching.
A. Dehydrated fin before bleaching in the top panel and after bleaching in the bottom panel. B. Setup with lamp and Petri dish with bleaching solution. C. Fin placement for optimal bleaching with the lamp.
Figure 3. Mounting sample into coverslip bottom Petri dish provides optimal imaging conditions.
A. Conical tube after pouring the three components of the resin. B. Resin after mixing, with the expected bubbles. C. Ready-to-use resin without bubbles after centrifugation. D. Way to locate the sample (blue arrow) by pouring the contents of the Eppendorf tube into a 100 mm Petri dish. E. Sample (blue arrow) immersed in resin previously poured into a 30 mL polypropylene jar; this step washes away any excess DBE from the sample. F. Sample placed in the coverslip bottom dish. G. Full immersion of the sample in the resin poured 12 h after the sample has been sitting at the bottom of the coverslip bottom dish. H and I. Sample ready for imaging with or without reflective light for visualization. All images were taken with a smartphone except for H and I, thus the scale is not comparable across them.
Figure 4. Caudal fin sample collection and cryosectioning preparation.
A. Sample placed and oriented into the OCT embedding molds and the mold after OCT is frozen. B. SlideTray slide staining system where subsequent steps are performed.
Figure 5. Whole-mount sagital view max projection.
Top images show mitotic cells stained by H3P-AF647; middle images show epidermis stained by Ecad-AF555; bottom images show YOYO-1 nuclear staining. Left column: representative images from homeostasis uncut caudal fins; middle column: regenerating 1-day-post-amputation samples: right column: regenerating 2-day-post-amputation caudal fins. 400 μm thick confocal stacks were acquired with a 10× air objective on a spinning disk confocal microscope.
Figure 6. Max projection of coronal-plane cryosections.
Top images show mitotic cells stained by Phospho-Histone H3 (H3P)-AF647; middle images show epidermis stained by Ecad-AF555; bottom images show YOYO-1 nuclear staining. Left column corresponds to regenerating 1-day-post-amputation samples; right column shows regenerating 2-days-post-amputation caudal fins. 25 μm thick confocal stacks were acquired with a 40× water objective on a laser scanning confocal microscope.
Data analysis
-
Data preprocessing
Stitch the stacks together using the Grid/Collection stitching tool from Fiji (https://imagej.net/software/fiji/) located under the tab Plugins/Stitching/Grid/Collection stitching.
Data analysis
Data analysis of H3P staining is commonly done by manual annotation due to its sparse labeling. However, in whole-mount samples and large volumetric imaging, this task becomes extremely time-consuming. To address this problem, thresholding by particle area and fluorescence intensity can be done using Fiji macros to quantify large volumes of tissue. Below, we describe our quantification pipeline, which yields adequate discrimination between H3P stained nuclei and large fluorescent debris coming from secondary antibody aggregates. See Supplementary information (Code folder) for a ready-to-use pipeline for data analysis.
-
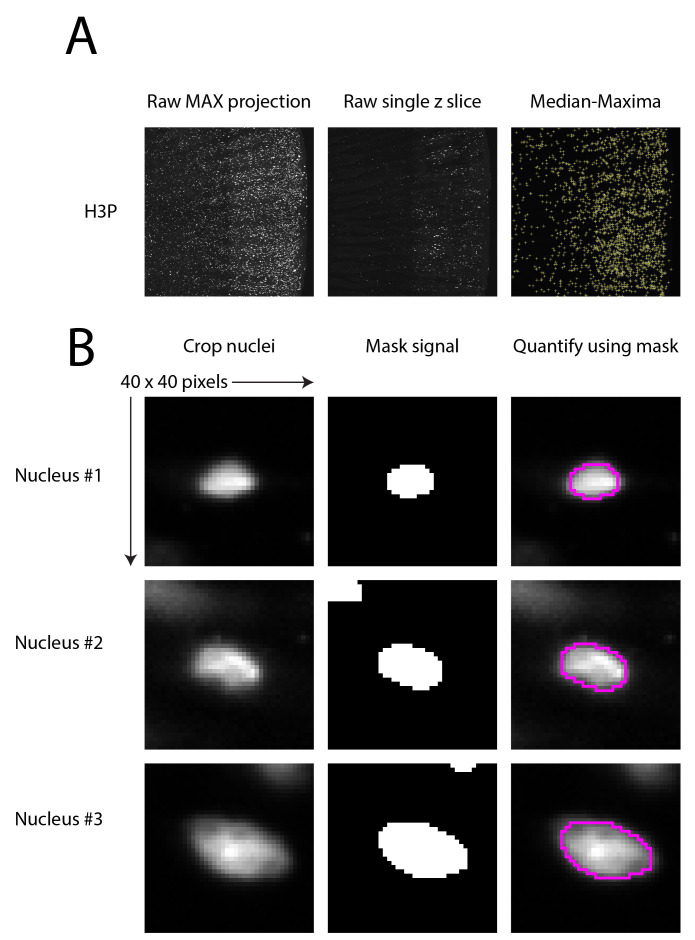
For every Z plane, perform the following steps (macro 01-Make_pH3_csv.ijm, see Figure 7A):
Duplicate the image.
Blur the image with Median filter, 5 pixel radius.
Subtract background with 50 pixel rolling.
Blur the image with Gaussian Blur filter, 4 pixel sigma.
Find Maxima with a prominence of 10 and output Point Selection.
Measure to record X and Y positions of each maxima.
Save coordinates in a csv file.
Close blurred image and return to the original image.
-
For every maxima, perform the following steps (macro 02-H3P_Intensity_csv.ijm, see Figure 7B):
i. Draw a square around the point coordinate of 40 pixels by 40 pixels.
ii. Duplicate this image.
iii. Optional: save image for future reference.
iv. Blur the image with Median filter, 3 pixel radius.
v. Blur the image with Gaussian Blur filter, 3 pixel radius.
vi. Duplicate the blurred image.
vii. Set Auto Threshold with the "Otsu" algorithm.
viii. Convert to mask.
ix. Run Watershed.
x. Analyze particles with size 10–400 pixels excluding the edges and adding to the ROI manager.
xi. If there are not any particles, discard the coordinate.
xii. Otherwise, select the raw fluorescent image and measure using the particles from the ROI manager. In most cases, it will be one particle but there may be more than one in a cropped image.
Save the area and intensity measurements for every analyzed particle with the corresponding X, Y, and Z coordinates.
You should have one table per sample with all the particles corresponding to X, Y, Z, Area, and Intensity values.
Split the table by Z steps and iterate through the whole stack, discarding any particles that are within 5 pixels of each other in X and Y and have lower intensity values than the particle in the adjacent Z plane. This helps filter your table to keep only the brightest measurement for each particle (script 03-ReduceZ.R).
-
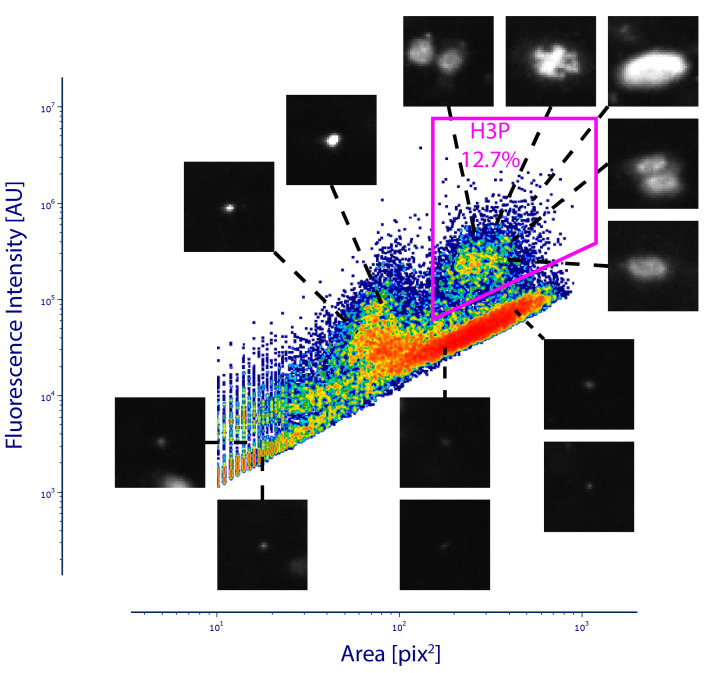
Import the filtered table into FCS express (De Novo Software, https://denovosoftware.com/) to draw a gate for positive events according to Area and intensity. It is important that you quantify the noise and have clear separation between noise particles and true signal.
Figure 8 shows the results for automatic H3P quantification in a whole-mount regenerating fin. We observed 12.7% positive events within the particle area and fluorescence intensity gate. This value will change depending on the prominence value when detecting maxima on step B1e. To validate image quantification, we examine representative images from different areas of the plot. Images that show nuclear morphology are included within the gate and the images that display small debris are excluded from analysis. The high event number is key to reveal clear separation between nuclear morphology particles (top right gated events) and debris.
Figure 7. Data analysis workflow.
A. Maximum projection on the left; a single Z slice in the middle; and maxima overlay on the right. B. Three examples of H3P positive nuclei showing the raw image on the left, the masked signal in the middle, and the merge of both images on the right.
Figure 8. Phospho-Histone H3 (H3P) gating strategy.
After particle quantification, a gate is drawn to include particles of nuclear size with high fluorescence intensity. In this example, 12.7% of all particles are within this gate and the rest of the particles are considered background noise. Representative images of the corresponding distribution are shown for validation.
General notes and troubleshooting
Staining intensity may vary significantly even with the exact same reagent concentration and volume due to cell mass differences between tissues. If you stain in parallel large and small tissues, the local concentration of the reagents as they are penetrating through the tissue will introduce technical variability that will result in noticeable differences in fluorescence intensity among true positive signal. An example is evident in Figure 5 in YOYO-1 staining, where the uncut sample is significantly understained compared to the rest of the samples.
Blur pixel sizes may need to be adjusted depending on the image resolution in the steps B1b, B1c, B1d, and B3. For data analysis, we used images with 1.5577 pix/μm.
Acknowledgments
We thank the Howard Hughes Medical Institute and the Stowers Institute for Medical Research for funding to support this work. We also wish to thank C. Guerrero for sharing fixation protocols with us prior to their publication; J. Unruh, B. Slaughter, C. Wood, R. Alexander, S. McKinney, and L. Maddera for advice on image acquisition and image quantification; J. Jenkin, C. Guerrero, and D. Zamora for help with animal care; and Y. Wang, L. Holmes, J. Blanck, J. Haug and A. Box for extensive discussion about staining optimization, reagent titration, and cytometry analysis; all members of the Sánchez Alvarado lab for insightful scientific discussion. This protocol is an updated and detailed version of the protocol used in: Science (2020), DOI: 10.1126/science.aaz3090.
Competing interests
There are no conflicts of interest or competing interests.
Ethical considerations
All African killifish work was performed according to protocols approved by The SIMR Institutional Animal Care and Use Committee (Protocol ID 2022-137).
Citation
Readers should cite both the Bio-protocol article and the original research article where this protocol was used.
Q&A
Post your question about this protocol in Q&A and get help from the authors of the protocol and some of its users.
Supplementary information
The following supporting information can be downloaded here:
Code.zip.
References
- 1.Genade T., Benedetti M., Terzibasi E., Roncaglia P., Valenzano D. R., Cattaneo A. and Cellerino A.(2005). Annual fishes of the genus Nothobranchius as a model system for aging research. Aging Cell 4(5): 223-233. [DOI] [PubMed] [Google Scholar]
- 2.Guerrero-Hernández C., Doddihal V., Mann F. G. and Alvarado A. S.(2021). A powerful and versatile new fixation protocol for immunohistology and in situ hybridization that preserves delicate tissues in planaria. bioRxiv: e466817. [Google Scholar]
- 3.Harel I., Benayoun B. A., Machado B., Singh P. P., Hu C. K., Pech M. F., Valenzano D. R., Zhang E., Sharp S. C., Artandi S. E., et al.(2015). A Platform for Rapid Exploration of Aging and Diseases in a Naturally Short-Lived Vertebrate. Cell 160(5): 1013-1026. [DOI] [PMC free article] [PubMed] [Google Scholar]
- 4.Hu C. K., Wang W., J. Brind’Amour, Singh P. P., Reeves G. A., Lorincz M. C., Alvarado A. S. and Brunet A.(2020). Vertebrate diapause preserves organisms long term through Polycomb complex members. Science 367(6480): 870-874. [DOI] [PMC free article] [PubMed] [Google Scholar]
- 5.Kang H. and Sánchez Alvarado A.(2009). Flow cytometry methods for the study of cell‐cycle parameters of planarian stem cells. Dev. Dyn. 238(5): 1111-1117. [DOI] [PubMed] [Google Scholar]
- 6.Newmark P. A. and Sánchez Alvarado A.(2000). Bromodeoxyuridine Specifically Labels the Regenerative Stem Cells of Planarians. Dev. Biol. 220(2): 142-153. [DOI] [PubMed] [Google Scholar]
- 7.Nielsen P. S., Riber-Hansen R., Jensen T. O., Schmidt H. and Steiniche T.(2013). Proliferation indices of phosphohistone H3 and Ki67: strong prognostic markers in a consecutive cohort with stage I/II melanoma. Mod. Pathol. 26(3): 404-413. [DOI] [PubMed] [Google Scholar]
- 8.Poleo G., Brown C. W., Laforest L. and Akimenko M.(2001). Cell proliferation and movement during early fin regeneration in zebrafish. Dev. Dyn. 221(4): 380-390. [DOI] [PubMed] [Google Scholar]
- 9.Renier N., Wu Z., Simon D. J., Yang J., Ariel P. and Tessier-Lavigne M.(2014). iDISCO: A Simple, Rapid Method to Immunolabel Large Tissue Samples for Volume Imaging. Cell 159(4): 896-910. [DOI] [PubMed] [Google Scholar]
- 10.Uemoto T., Abe G. and Tamura K.(2020). Regrowth of zebrafish caudal fin regeneration is determined by the amputated length. Sci. Rep. 10(1): e1038/s41598–020–57533–6. [DOI] [PMC free article] [PubMed] [Google Scholar]
- 11.Wang W., Hu C. K., Zeng A., Alegre D., Hu D., Gotting K., Ortega Granillo A., Wang Y., Robb S., Schnittker R., et al.(2020). Changes in regeneration-responsive enhancers shape regenerative capacities in vertebrates. Science 369(6508): eaaz3090. [DOI] [PMC free article] [PubMed] [Google Scholar]
- 12.Wang W., Kidd B. J., Carroll S. B. and Yoder J. H.(2011). Sexually dimorphic regulation of the Wingless morphogen controls sex-specific segment number in Drosophila. Proc. Natl. Acad. Sci. U.S.A. 108(27): 11139-11144. [DOI] [PMC free article] [PubMed] [Google Scholar]


