Abstract
Background
Intramuscular adipose tissue (IMAT) formation derived from muscle fibro‐adipogenic progenitors (FAPs) has been recognized as a pathological feature of sarcopenia. This study aimed to explore whether genetic and pharmacological gastric inhibitory polypeptide (GIP) receptor antagonism suppresses IMAT accumulation and ameliorates sarcopenia in mice.
Methods
Whole body composition, grip strength, skeletal muscle weight, tibialis anterior (TA) muscle fibre cross‐sectional area (CSA) and TA muscle IMAT area were measured in young and aged male C57BL/6 strain GIP receptor (Gipr)‐knockout (Gipr −/−) and wild‐type (Gipr +/+) mice. FAPs isolated from lower limb muscles of 12‐week‐old Gipr +/+ mice were cultured with GIP, and their differentiation into mature adipocytes was examined. Furthermore, TA muscle IMAT area and fibre CSA were measured in untreated Gipr −/− mice and GIP receptor antagonist‐treated Gipr +/+ mice after glycerol injection into the TA muscles.
Results
Body composition analysis revealed that 104‐week‐old Gipr −/− mice had a greater proportion of lean tissue mass (73.7 ± 1.2% vs. 66.5 ± 2.7%, P < 0.05 vs. 104‐week‐old Gipr +/+ mice) and less adipose tissue mass (13.1 ± 1.3% vs. 19.4 ± 2.6%, P < 0.05 vs. 104‐week‐old Gipr +/+ mice). Eighty‐four‐week‐old Gipr −/− mice exhibited increases in grip strength (P < 0.05), weights of TA (P < 0.05), soleus (P < 0.01), gastrocnemius (P < 0.05) and quadriceps femoris (P < 0.01) muscles, and average TA muscle fibre CSA (P < 0.05) along with a reduction in TA muscle IMAT area assessed by the number of perilipin‐positive cells (P < 0.0001) compared with 84‐week‐old Gipr +/+ mice. Oil Red O staining analysis revealed 1.6‐ and 1.7‐fold increased adipogenesis in muscle FAPs cultured with 10 and 100 nM of GIP (P < 0.01 and P < 0.001 vs. 0 nM of GIP, respectively). Furthermore, both untreated Gipr −/− mice and GIP receptor antagonist‐treated Gipr +/+ mice for 14 days after glycerol injection into the TA muscles at 12 weeks of age showed reduced TA muscle IMAT area (1.39 ± 0.38% and 2.65 ± 0.36% vs. 6.54 ± 1.30%, P < 0.001 and P < 0.01 vs. untreated Gipr +/+ mice, respectively) and increased average TA muscle fibre CSA (P < 0.01 and P < 0.05 vs. untreated Gipr +/+ mice, respectively).
Conclusions
GIP promotes the differentiation of muscle FAPs into adipocytes and its receptor antagonism suppresses IMAT accumulation and promotes muscle regeneration. Pharmacological GIP receptor antagonism may serve as a novel therapeutic approach for sarcopenia.
Keywords: aging, fibro‐adipogenic progenitors, GIP receptor, intramuscular adipose tissue, sarcopenia
Introduction
Sarcopenia is a syndrome of progressive and generalized decline in skeletal muscle mass with age, accompanied by low muscle strength and/or low physical performance, as defined by the European Working Group on Sarcopenia in Older People (EWGSOP) and the Asia Working Group for Sarcopenia (AWGS). 1 , 2 With progressive population aging, the prevalence of sarcopenia will further increase in most geriatric settings worldwide. Importantly, sarcopenia is closely related to increased adverse outcomes such as falls, frailty, physical disability and mortality. 3 Accordingly, exploring the detailed molecular mechanisms underlying sarcopenia pathophysiology and designing novel preventive strategies for this syndrome will be required to promote healthy longevity.
Gastric inhibitory polypeptide (GIP) is a 42‐amino‐acid hormone that is released from intestinal K cells in response to ingestion of nutrients including fat or glucose and potentiates glucose‐dependent insulin secretion from pancreatic β‐cells. 4 The GIP receptor is expressed in adipocytes and its receptor signalling directly induces fatty acid incorporation into adipose tissue. 5 Besides, we previously reported that GIP receptor‐deficient mice fed a high‐fat diet did not develop obesity or insulin resistance. 6 , 7 However, it is unclear whether GIP receptor signalling promotes intramuscular fat accumulation as an extra‐pancreatic action.
Intramuscular adipose tissue (IMAT) is an ectopic fat accumulation in the interstitium within the muscle (i.e., outside the muscle fibres) 8 , 9 and is involved in loss of skeletal muscle strength and physical function. 10 Its accumulation is known to be enhanced under various conditions such as chronic hyperglycaemia 11 and aging. 12 , 13 IMAT is derived from mesenchymal stem cells, called fibro‐adipogenic progenitors (FAPs), in skeletal muscle, 8 , 14 and muscle quality decreases in parallel with the differentiation of FAPs into adipocytes. 15 Besides intramuscular ectopic fat deposition, FAPs play a crucial role in skeletal muscle regeneration. 15 , 16 Indeed, a recent experimental study has reported that FAP‐depleted mice exhibit muscle atrophy and loss of muscle stem cells. 17 Thus, FAPs appear to exert heterogenous functions according to various pathological conditions.
In the present study, we hypothesized that GIP receptor signalling may be a critical factor determining the differentiation of FAPs into adipocytes and promoting IMAT formation along with declines of muscle mass and strength with aging. To test this hypothesis, we first investigated the alterations of skeletal muscle mass and strength and IMAT formation in aged mice with a genetic deletion of GIP receptor signalling and next explored the molecular mechanisms underlying these alterations, focusing on the differentiation of FAPs into mature adipocytes by GIP and also glycerol‐induced IMAT formation in skeletal muscles of mice with and without a genetic or pharmacological deletion of GIP receptor signalling.
Materials and methods
Materials
Reagents and antibodies used in this study are listed with vendors and catalogue numbers in Table S1 .
Animal studies
GIP receptor (Gipr)‐knockout (Gipr −/−) mice were generated as previously described, 18 and male C57BL/6 strain Gipr −/− and wild‐type (Gipr +/+) mice were used in this study. For pathophysiological analyses of skeletal muscle and behavioural tests in Gipr −/− mice, the mice were kept with free access to normal diet (CE‐2 [Clea Japan, Tokyo, Japan] or CRF‐1 [Oriental Yeast Co., Ltd., Tokyo, Japan]) and water. For glycerol injection and high‐fat diet studies, the mice were housed with ad libitum access to high‐fat diet (HFD32 comprising 56.7% fat, 23.2% carbohydrate and 20.1% protein; Clea Japan) and water. All animal experiments were approved by the Animal Care and Use Committees of Akita University (protocol numbers a‐1‐0211 and b‐1‐0206, approved 14 May 2020) and Fujita Health University (protocol numbers AP19006 and DP18015, approved 22 February 2019). The experimental animals were handled in accordance with the Animal Welfare Guidelines of Akita University and ARRIVE guidelines.
Measurements of body composition, plasma triglyceride, grip strength and muscle weight
Whole body composition of 104‐week‐old Gipr +/+ and Gipr −/− mice was assessed using micro‐computed tomography (μCT). Mice were anaesthetized with isoflurane and imaged using CosmoScan GX II (Rigaku Corporation, Yamanashi, Japan). A calibrating phantom composed of air and water was scanned along with the animals. Contiguous slice images of the whole body were used for quantitative assessment using Analyze 12.0 (AnalyzeDirect, Overland Park, KS, USA). Weights of bone, lean and adipose tissue masses were determined and normalized by body weight as described previously. 19 Plasma triglyceride levels were measured on plasma samples collected after a 6‐h daytime fast by an autoanalyser (Fuji Dry‐Chem 5500, Fuji Film, Tokyo, Japan). Grip strength was determined using a model MK‐380Si grip strength metre (Muromachi Kikai, Tokyo, Japan). The values of grip strength were presented as the maximum value repeated 10 times for each mouse as described previously. 20 To measure muscle weight, the mice were killed using the cervical dislocation method under anaesthesia, and the muscles were dissected immediately. The average weight of bilateral muscles was calculated for the tibialis anterior (TA), extensor digitorum longus, soleus, gastrocnemius and quadriceps femoris muscles in each mouse.
Immunofluorescence staining and assessment of muscle fibre cross‐sectional area (CSA)
After the mice were killed under anaesthesia, the TA muscles were removed and rapidly frozen. The muscles were cut at a position 2.5 mm from the proximal side, and 10‐μm‐thick muscle tissue sections were prepared for immunofluorescence staining. The specimens were blocked with 1.5% bovine serum albumin for 1 h and incubated with primary antibodies at 4°C overnight followed by secondary staining. Rabbit anti‐perilipin (1:250; Sigma‐Aldrich, St. Louis, MO, USA), rat anti‐laminin (1:400; Santa Cruz Biotechnology, Dallas, TX, USA) and goat anti‐platelet‐derived growth factor receptor alpha (PDGFRα; 1:100; R&D Systems, Minneapolis, MN, USA) antibodies as a primary antibody and Alexa Fluor‐546 anti‐rabbit IgG (1:1000; Invitrogen, Carlsbad, CA, USA), Alexa Fluor‐555 anti‐rat IgG (1:1000; Invitrogen) and Alexa Fluor‐488 anti‐goat IgG (1:1000; Invitrogen) antibodies as a secondary antibody were used. The stained images were obtained using a model BZ‐9000 inverted fluorescence microscope (Keyence, Osaka, Japan). The IMAT area and muscle fibre CSA of the muscle sections were analysed using BZ‐II analyser software Version 2.2 (Keyence). The IMAT area was assessed using perilipin‐stained TA muscle tissues by counting the number of perilipin‐positive cells or by calculating the percentage of perilipin‐positive area for each mouse TA muscle. The muscle fibre CSA was measured using laminin‐stained TA muscle tissues. The strength of the fluorescence signal allowed for the identification of laminin‐positive basal lamina, and an inversion function provided for the identification of muscle fibre. By changing the lower limit in the histogram function, the small, incorrectly identified areas were eliminated. The CSA of each muscle fibre was determined, and then the average CSA was calculated for each mouse.
In situ hybridization and mRNA expression analysis
For in situ hybridization, the TA muscles were removed from 8‐week‐old Gipr +/+ mice. Sense and antisense riboprobes were directed against mouse Gipr mRNA (nucleotides 1344–1700; GenBank NM_001080815) and hybridized to the sections as described previously. 21 For mRNA expression analysis, total RNA was extracted from the TA muscle tissues using the RNeasy Mini Kit (QIAGEN, Hilden, Germany). Complementary DNA (cDNA) was synthesized using a Prime Script First‐Strand cDNA Synthesis Kit (TaKaRa Bio, Shiga, Japan). Quantitative real‐time reverse transcription PCR was performed using a Thermal Cycler Dice Real‐Time System (TaKaRa Bio) and SYBR Premix Ex Taq II (TaKaRa Bio). The relative expression levels of each transcript were calculated as the ratio to 18S ribosomal RNA (rRNA). Primer sequences are listed in Table S2 .
Cell isolation, purification and culture
Magnetic‐activated cell sorting (MACS) of FAPs was performed as previously described with slight modifications. 22 Briefly, 12‐week‐old Gipr +/+ and Gipr −/− mice were killed under anaesthesia, and the hind limb muscles were carefully dissected to remove the attached tendons and connective tissue. FAPs were isolated from these dissected muscles. To assess the degree of differentiation of the FAPs into mature adipocytes, Oil Red O staining was performed as previously described with slight modifications. 22 Detailed protocol for cell isolation, purification and culture is described in the supporting information.
Generation of muscle degeneration models and gastric inhibitory polypeptide receptor antagonist treatment
For the generation of muscle degeneration models, 50 μL of 50% (v/v) glycerol solution in phosphate‐buffered saline (PBS) was injected into bilateral TA muscles of 12‐week‐old Gipr +/+ and Gipr −/− mice. The mice were fed a high‐fat diet (HFD32; Clea Japan). On Day 14 after glycerol injection, the mice were killed under anaesthesia. The TA muscles were removed and used for immunofluorescence staining and mRNA expression analysis. For the experiments of GIP receptor antagonist treatment, 12‐week‐old Gipr +/+ mice were injected with 50% glycerol bilaterally into the TA muscles as described above. The mice were treated with GIP receptor antagonist, SKL‐14959 (Sanwa Kagaku, Mie, Japan), for 14 days. Untreated Gipr +/+ mice served as the control group. The SKL‐14959 was administered at 0.133% in a mixed HFD32 (Clea Japan) as described previously. 23 Amount of daily food intake was measured during the treatment. After 14‐day administration of SKL‐14959, the mice were killed under anaesthesia, and the removed TA muscles were used for immunofluorescence staining and mRNA and protein expression analyses. The protein expression levels of adipogenesis‐related proteins were analysed by western blot. Detailed protocol for western blot analysis is described in the supporting information.
Evaluation of behaviour
Behavioural tests were performed at 10–20 weeks of age in Gipr +/+ and Gipr −/− mice as described previously. 24 For the experiments of GIP receptor antagonist treatment, the tests were started after 3‐day administration of SKL‐14959 at 0.133% in a mixed high‐fat diet (HFD32) to Gipr +/+ mice at 9–10 weeks of age. Detailed protocol for behavioural tests is described in the supporting information.
Statistical analysis
All data are presented as mean ± SEM. Statistical analysis was performed using GraphPad Prism 9 software (GraphPad, San Diego, CA, USA). The significance of the difference between the two groups was assessed using two‐tailed Student's t‐test. Differences between multiple groups were determined using one‐way analysis of variance (ANOVA) followed by Bonferroni's multiple comparison test. Behavioural data were analysed using two‐way repeated measures ANOVA or two‐tailed Student's t‐test. Food intake data were analysed by two‐way repeated measures ANOVA. Statistical significance was set at P < 0.05.
Results
Aged Gipr −/− mice exhibit a greater proportion of lean tissue mass and increases in muscle strength and mass
Body composition analysis by μCT revealed that 104‐week‐old Gipr −/− mice had a greater proportion of lean tissue mass (non‐bone fat‐free mass) (73.7 ± 1.2% vs. 66.5 ± 2.7%, P < 0.05 vs. 104‐week‐old Gipr +/+ mice) and less adipose tissue mass (13.1 ± 1.3% vs. 19.4 ± 2.6%, P < 0.05 vs. 104‐week‐old Gipr +/+ mice) (Figure 1 A ). No statistically significant differences in body weight and plasma triglyceride levels were evident between Gipr +/+ and Gipr −/− mice at 12 and 84 weeks of age (Figure 1 B,C ). Although the grip strength of 12‐week‐old Gipr +/+ and Gipr −/− mice was not different (0.307 ± 0.014 vs. 0.320 ± 0.013 kg, not significant), an increase in grip strength was observed in 84‐week‐old Gipr −/− mice compared with 84‐week‐old Gipr +/+ mice (0.269 ± 0.011 vs. 0.202 ± 0.010 kg, P < 0.05) (Figure 1 D ). The masses of the TA, soleus, gastrocnemius and quadriceps femoris muscles, but not extensor digitorum longus muscle, of 84‐week‐old Gipr −/− mice were significantly increased as compared with those of 84‐week‐old Gipr +/+ mice (Figure 1 E ).
Figure 1.
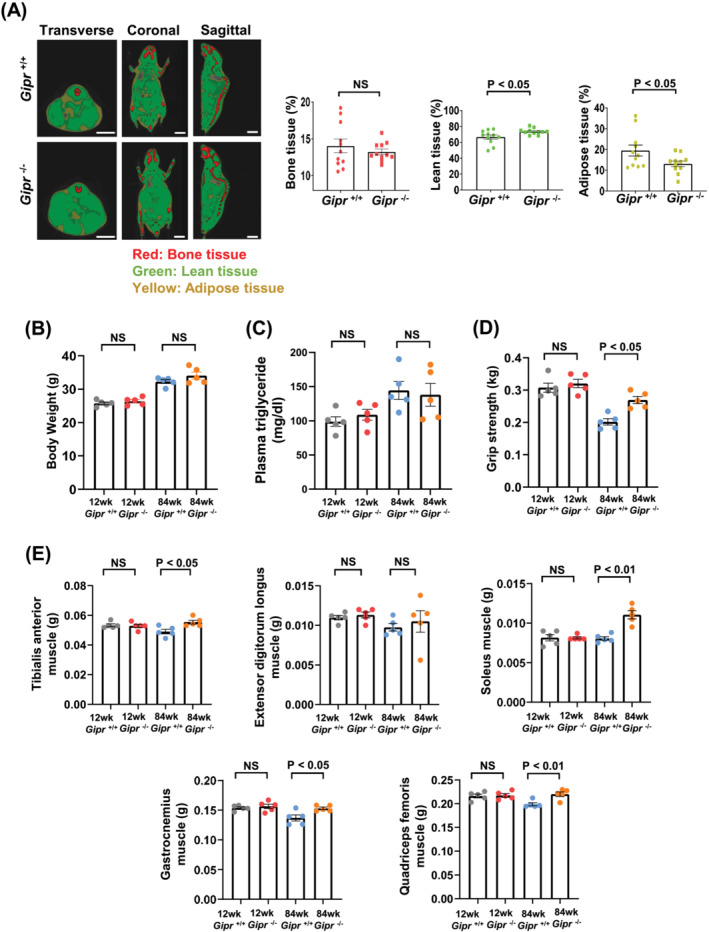
Aged Gipr −/− mice exhibit a greater proportion of lean tissue mass and increases in muscle strength and mass. (A) Representative micro‐computed tomography images of whole body (left) and quantitative analysis of body composition (right) of 104‐week‐old Gipr +/+ and Gipr −/− mice. The red, green and yellow areas represent bone tissue, lean tissue and adipose tissue, respectively. Bars indicate 1 cm. Data were normalized to body weight. n = 11 mice per group. (B) Body weight, (C) plasma triglyceride, (D) grip strength and (E) weights of the tibialis anterior, extensor digitorum longus, soleus, gastrocnemius and quadriceps femoris muscles of 12‐week‐old Gipr +/+ and Gipr −/− mice and 84‐week‐old Gipr +/+ and Gipr −/− mice. The muscle weights are shown as the average value of bilateral muscle weights in each mouse. n = 5 mice per group. All data are presented as mean ± SEM. NS, not significant.
Aged Gipr −/− mice show a greater muscle fibre diameter and a lesser intramuscular adipose tissue area in tibialis anterior muscle
Quantification of muscle fibre CSA in laminin‐stained TA muscle tissues revealed that average muscle fibre diameter in Gipr +/+ mice decreased with aging (Figure 2 A,B ). However, the decline in muscle fibres was attenuated in 84‐week‐old Gipr −/− mice (Figure 2 A,B ). PDGFRα‐positive cells, which are synonymous with FAPs in the TA muscle, were not significantly different among the groups (Figure 2A,C ). Perilipin is a major coat protein on the surfaces of lipid droplets in adipocytes, and it is used as a specific marker for lipid accumulation. 25 We assessed the IMAT area in the TA muscles of Gipr +/+ and Gipr −/− mice by counting the number of perilipin‐positive cells. The IMAT areas of 12‐week‐old Gipr +/+ and Gipr −/− mice were not significantly different (Figure 2A,D ). However, the IMAT area of 84‐week‐old Gipr +/+ mice was larger than that of 12‐week‐old Gipr +/+ mice (Figure 2A,D ). Eighty‐four‐week‐old Gipr −/− mice displayed a reduction in IMAT area compared with 84‐week‐old Gipr +/+ mice (Figure 2A,D ).
Figure 2.
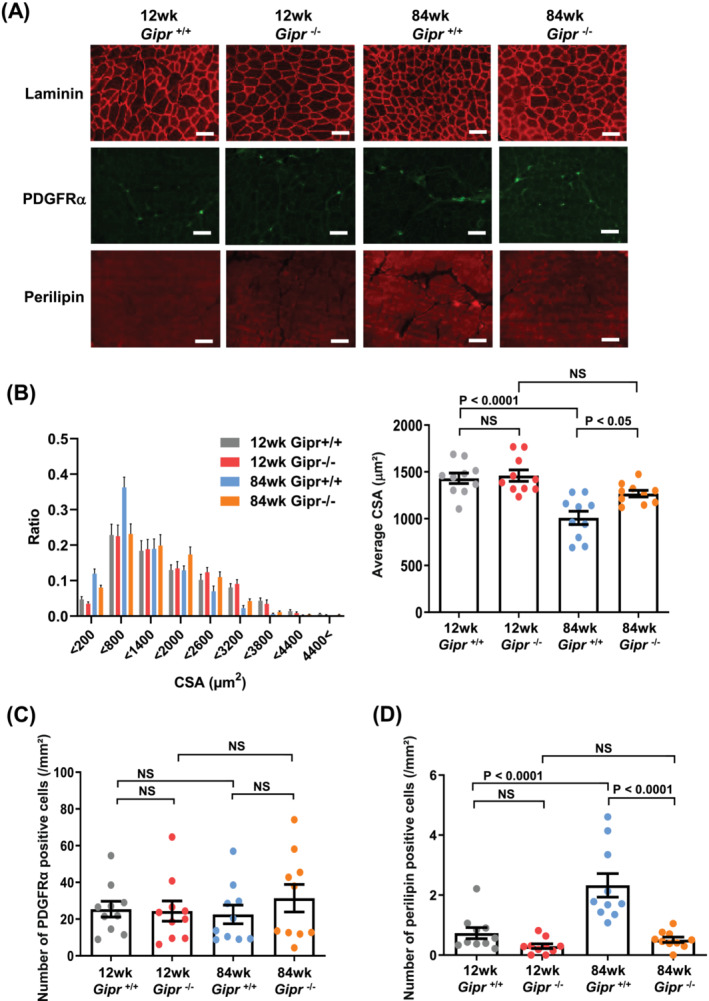
Aged Gipr −/− mice show a greater muscle fibre diameter and a lesser intramuscular adipose tissue area in tibialis anterior (TA) muscle. (A) Representative images of laminin, platelet‐derived growth factor receptor alpha (PDGFRα) and perilipin‐stained TA muscle tissues in 12‐week‐old Gipr +/+ and Gipr −/− mice and 84‐week‐old Gipr +/+ and Gipr −/− mice. Bars indicate 100 μm. (B) Distribution of muscle fibre cross‐sectional area (CSA) (left) and average muscle fibre CSA (right) measured using laminin‐stained TA muscle tissues. n = 10 TA muscles from 5 mice per group. (C) Number of PDGFRα‐positive cells and (D) number of perilipin‐positive cells per square millimetres of TA muscle tissues. n = 10 TA muscles from 5 mice per group. All data are presented as mean ± SEM. NS, not significant.
Gipr −/− mice exhibit slightly increased locomotor activity, decreased anxiety‐like behaviour and improved spatial learning and memory ability
We also examined behavioural phenotype including motor functions and emotional behaviours at 10–20 weeks of age in Gipr +/+ and Gipr −/− mice. Total distance and centre time in the open field test tended to be increased in Gipr −/− mice compared with Gipr +/+ mice (Figure 3 A ). In the light/dark transition test, Gipr −/− mice exhibited increased number of transitions between the dark and light chambers (Figure 3 B ). Gipr −/− mice initially fell off the rotarod in a shorter time than Gipr +/+ mice, but they could stay on the rod as well as Gipr +/+ mice after the number of trials was repeated (Figure 3 C ). In the Barnes maze test, the number of errors and distance travelled to reach the target hole was significantly decreased in Gipr −/− mice compared with Gipr +/+ mice (Figure 3 D ). In the social interaction test, Gipr −/− mice tended to increase total duration of active contacts and distance travelled and decrease mean duration of contacts compared with Gipr +/+ mice (Figure 3 E ). Thus, Gipr −/− mice exhibited slightly increased locomotor activity, decreased anxiety‐like behaviour and improved spatial learning and memory ability relative to Gipr +/+ mice.
Figure 3.
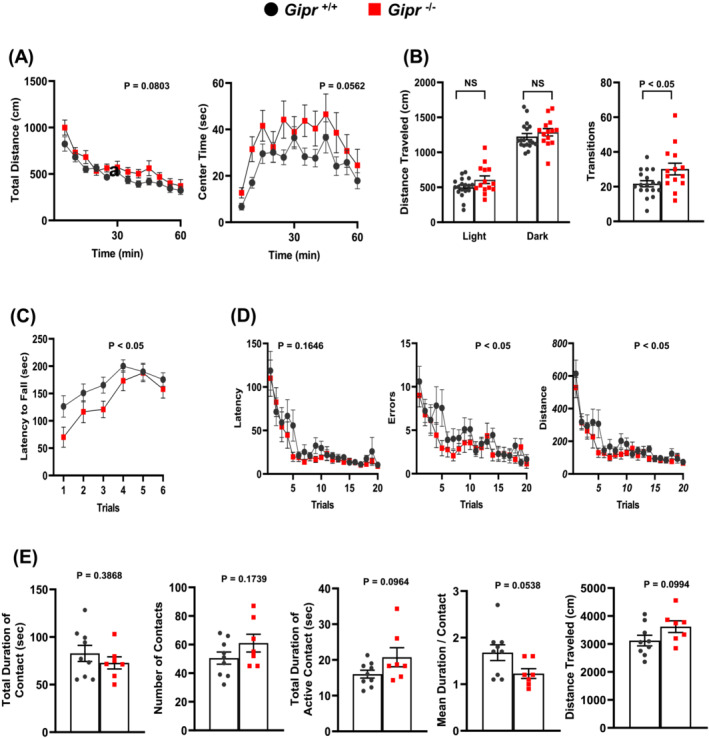
Gipr −/− mice exhibit slightly increased locomotor activity, decreased anxiety‐like behaviour and improved spatial learning and memory ability. The behavioural tests were performed at 10–20 weeks of age in Gipr +/+ and Gipr −/− mice. (A) Open field test, (B) light/dark transition test, (C) rotarod test, (D) Barnes maze test and (E) social interaction test. n = 18 for Gipr +/+ mice and n = 14 for Gipr −/− mice (A–D). n = 9 for pairs of Gipr +/+ mice and n = 7 for pairs of Gipr −/− mice (E). All data are presented as mean ± SEM. NS, not significant. P values indicate interaction between two factors of Gipr +/+ or Gipr −/− and time or trials (A, C, D).
Gastric inhibitory polypeptide promotes adipogenic differentiation of fibro‐adipogenic progenitors
In situ hybridization analysis in 8‐week‐old Gipr +/+ mice indicated that Gipr mRNA was morphologically expressed around muscle fibres, that is, in the interstitium, within the TA muscle (Figure 4 A ). To assess whether the detected Gipr gene expression originated from FAPs, we isolated FAPs from lower limb muscles of 12‐week‐old Gipr +/+ and Gipr −/− mice using MACS as CD45−, CD31−, α7‐integrin− and Sca‐1+ cells. Indeed, the isolated FAPs were highly enriched for the expression of Pdgfra, which is generally used as a cell marker of FAPs, 26 and the expression levels were not significantly different between FAPs from Gipr +/+ and Gipr −/− mice (Figure 4 B ). The FAPs isolated from Gipr +/+ mice exhibited high gene expression levels of Gipr (Figure 4 B ). In contrast, Gipr expression levels in the CD45+, CD31+ and α7‐integrin+ fraction consisted of immune, endothelial and satellite cells, respectively, were considerably lower than those in the fraction of FAPs in Gipr +/+ mice (Figure 4 B ).
Figure 4.
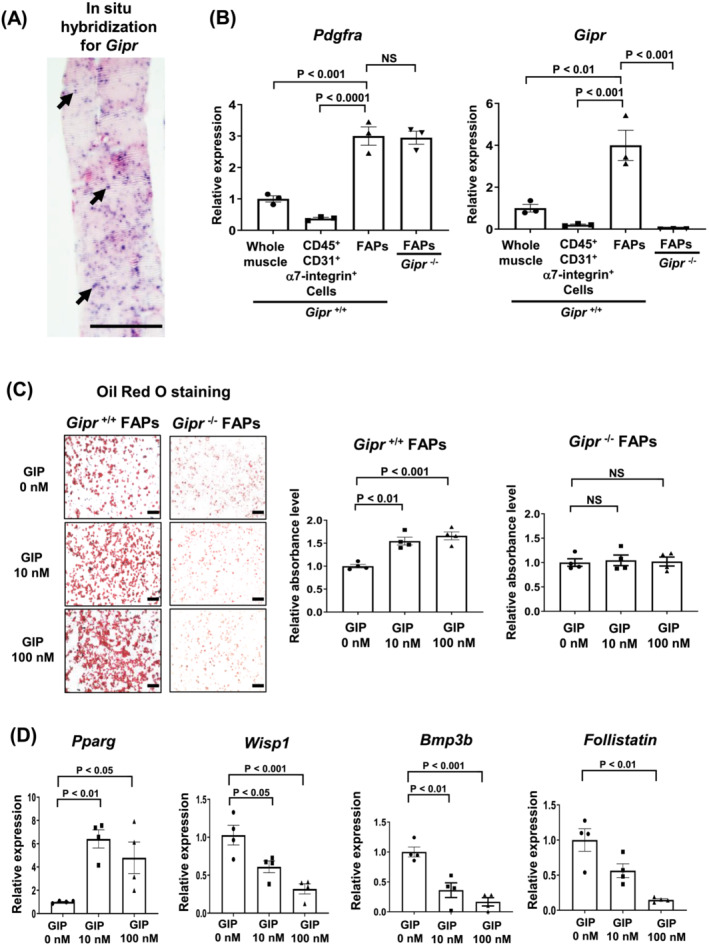
Gastric inhibitory polypeptide (GIP) promotes adipogenic differentiation of fibro‐adipogenic progenitors (FAPs) isolated from lower limb muscles of Gipr +/+ mice. (A) In situ hybridization analysis using antisense riboprobes of mouse Gipr mRNA in tibialis anterior muscle of 8‐week‐old Gipr +/+ mouse. Arrows indicate Gipr mRNA expression. Bar indicates 100 μm. (B) Relative mRNA expression levels of Pdgfra and Gipr in whole muscle, CD45+, CD31+ or α7‐integrin+ cells, and FAPs in lower limb muscle of 12‐week‐old Gipr +/+ mouse, and FAPs in lower limb muscle of 12‐week‐old Gipr −/− mouse. n = 3 mice per group. (C) Representative images (left) and relative absorbance levels at 492 nm (right) in Oil Red O staining in FAPs isolated from lower limb muscles of 12‐week‐old Gipr +/+ and Gipr −/− mice and cultured under the conditions of absence (0 nM) and presence (10 or 100 nM) of GIP. The absorbance at 492 nm denotes the effectiveness of adipogenic differentiation of FAPs. Bars indicate 100 μm. n = 4 mice per group. (D) Relative mRNA expression levels of Pparg, Wisp1, Bmp3b and follistatin in FAPs isolated from lower limb muscles of 12‐week‐old Gipr +/+ mice and cultured under the conditions of absence (0 nM) and presence (10 or 100 nM) of GIP. n = 4 mice per group. All data are presented as mean ± SEM. NS, not significant.
To investigate whether GIP promoted the differentiation of FAPs into mature adipocytes, we performed Oil Red O staining in the FAPs isolated from lower limb muscles of Gipr +/+ and Gipr −/− mice and cultured under the conditions of absence (0 nM) and presence (10 or 100 nM) of GIP, followed by the semi‐quantitative analysis by measurement of absorbance at 492 nm, which denotes the effectiveness of adipogenic differentiation of FAPs (Figure 4 C ). The addition of 10 and 100 nM of GIP in Gipr +/+ FAPs promoted adipogenesis 1.6‐ and 1.7‐fold as compared with the lack of GIP (P < 0.01 and P < 0.001 vs. 0 nM of GIP, respectively), whereas the GIP addition in Gipr −/− FAPs did not facilitate adipogenesis (Figure 4 C ).
Besides, the mRNA (Pparg) expression levels of peroxisome proliferator‐activated receptor gamma (PPARγ), which is a prominent regulator of adipogenesis, 27 were significantly increased by the GIP addition (Figure 4 D ). Undifferentiated FAPs have been recently reported to secrete favourable factors for efficient myogenesis, such as WNT1‐inducible signalling pathway protein 1 (WISP1), bone morphogenetic protein 3B (BMP3B) and follistatin. 28 , 29 , 30 The mRNA (Wisp1, Bmp3b and follistatin) expression levels of WISP1, BMP3B and follistatin in FAPs were significantly reduced along with adipogenic differentiation following GIP addition (Figure 4 D ).
Gastric inhibitory polypeptide receptor signalling is involved in adipogenesis following glycerol injury
Because an intramuscular glycerol injection induces IMAT development and disturbs muscle regeneration 31 and a high‐fat diet promotes the accumulation of subcutaneous and visceral fat, 6 their combination is expected to promote IMAT accumulation to a greater extent. Therefore, we performed glycerol injection into the TA muscles of 12‐week‐old Gipr +/+ and Gipr −/− mice followed by a high‐fat diet for 14 days or administration of GIP receptor antagonist at 0.133% in a mixed high‐fat diet for 14 days and examined IMAT accumulation and muscle regeneration. Amount of daily food intake was not different among the untreated Gipr +/+, untreated Gipr −/− and GIP receptor antagonist‐treated Gipr +/+ mouse groups (Figure 5 A ). Figure 5 B shows representative perilipin staining images and IMAT area of the TA muscles on Day 14 after glycerol injection or PBS injection as a control. Glycerol‐injected and untreated Gipr +/+ mice exhibited greater infiltration of adipocytes expressing perilipin on the surface of lipid droplets relative to PBS‐injected and untreated Gipr +/+ mice (6.54 ± 1.30 % vs. 0.42 ± 0.13 %, P < 0.001) (Figure 5 B ). In comparison, glycerol‐injected and untreated Gipr −/− mice showed less adipogenesis (IMAT area) than glycerol‐injected and untreated Gipr +/+ mice (1.39 ± 0.38 % vs. 6.54 ± 1.30 %, P < 0.001) (Figure 5 B ). Besides, glycerol‐injected and GIP receptor antagonist‐treated Gipr +/+ mice exhibited less IMAT area relative to glycerol‐injected and untreated Gipr +/+ mice (2.65 ± 0.36 % vs. 6.54 ± 1.30 %, P < 0.01) (Figure 5 B ). Quantification analysis in laminin‐stained muscle tissues revealed that the average CSA of TA muscle fibres in untreated Gipr −/− mice was nearly 1.5‐fold larger than that in untreated Gipr +/+ mice (P < 0.01) and also that the average TA muscle fibre CSA in GIP receptor antagonist‐treated Gipr +/+ mice was significantly increased as compared with that in untreated Gipr +/+ mice (P < 0.05) (Figure 5 C ). The mRNA expression levels of an adipogenesis regulator Pparg in the TA muscles were significantly lower in untreated Gipr −/− mice and GIP receptor antagonist‐treated Gipr +/+ mice than in untreated Gipr +/+ mice after glycerol injection (Figure 5 D ). In contrast, the mRNA expression levels of myogenesis promotors such as Wisp1, Bmp3b and follistatin in the TA muscles were significantly higher in untreated Gipr −/− mice than in untreated Gipr +/+ mice (Figure 5 D ). The mRNA expression levels of Wisp1, Bmp3b and follistatin in the TA muscles tended to be increased in GIP receptor antagonist‐treated Gipr +/+ mice relative to untreated Gipr +/+ mice, although their differences did not reach statistical significance (Figure 5 D ).
Figure 5.
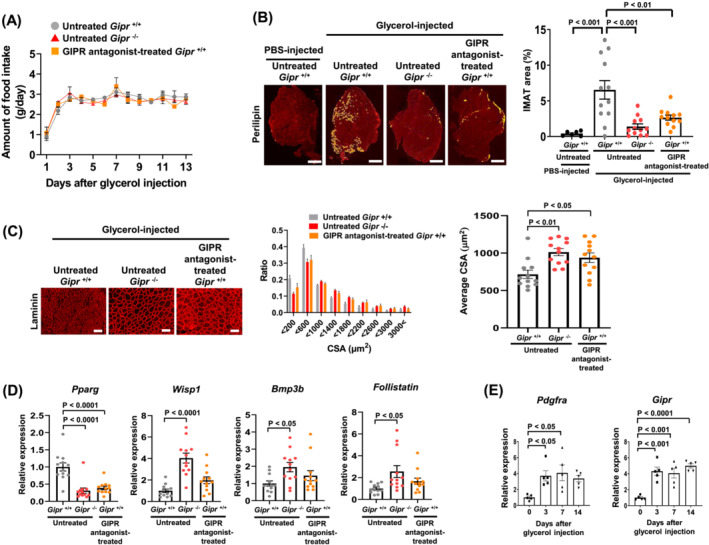
Gastric inhibitory polypeptide receptor (GIPR) signalling is involved in adipogenesis following glycerol injury. (A) Changes in amount of daily food intake in glycerol‐injected and untreated Gipr +/+ and Gipr −/− mice and glycerol‐injected and GIPR antagonist‐treated Gipr +/+ mice. Twelve‐week‐old mice were either treated or untreated with GIPR antagonist for 14 days after glycerol injection into the tibialis anterior (TA) muscles. All mice were fed with a high‐fat diet for 14 days. n = 6 mice per group. (B) Representative images (left) and intramuscular adipose tissue (IMAT) areas (right) of the TA muscle tissue sections stained with perilipin antibodies on Day 14 after phosphate‐buffered saline (PBS) or glycerol injection into the TA muscles of 12‐week‐old Gipr +/+ and Gipr −/− mice. Bars indicate 500 μm. n = 6 TA muscles from 3 mice in PBS‐injected mouse group. n = 12 TA muscles from 6 mice per glycerol‐injected mouse group. (C) Representative images (left), distribution of muscle fibre cross‐sectional area (CSA) (centre) and average muscle fibre CSA (right) analysed using laminin‐stained TA muscle tissues on Day 14 after glycerol injection into the TA muscles of 12‐week‐old Gipr +/+ and Gipr −/− mice. Bars indicate 100 μm. n = 12 TA muscles from 6 mice per group. (D) Relative Pparg, Wisp1, Bmp3b and follistatin expression levels of mRNA extracted from the TA muscles on Day 14 after glycerol injection into the TA muscles of 12‐week‐old Gipr +/+ and Gipr −/− mice. n = 12 TA muscles from 6 mice per group. (E) Relative mRNA expression levels of Pdgfra and Gipr in the TA muscles on Days 0, 3, 7 and 14 after glycerol injection into the TA muscles of 12‐week‐old Gipr +/+ mice. n = 5 TA muscles from 5 mice per group. All data are presented as mean ± SEM.
Next, we tested the gene expression in the TA muscles prior to and 3, 7 and 14 days following glycerol injection in 12‐week‐old Gipr +/+ mice. The mRNA expression levels of Pdgfra, a cell marker of FAPs, were increased following glycerol‐induced muscle injury as compared with those before injury (Figure 5 E ). In addition, Gipr mRNA expression levels were increased following glycerol‐induced muscle injury, as were Pdgfra expression levels (Figure 5 E ). Thus, we confirmed that glycerol injection enhanced gene expression of GIP receptor along with a cell marker of FAPs, PDGFRα, in the TA muscles, both of which could be involved in IMAT formation.
Gastric inhibitory polypeptide receptor antagonist decreases adipogenesis‐related protein expression levels in tibialis anterior muscle following glycerol injury
As PPARγ and fatty acid binding protein 4 (FABP4) are involved in IMAT formation as an adipogenesis‐related protein, we investigated their protein expression levels in the TA muscles of untreated Gipr +/+ and Gipr −/− mice and GIP receptor antagonist‐treated Gipr +/+ mice for 14 days after glycerol injection into the TA muscles. The PPARγ and FABP4 protein expression levels were significantly lower in the untreated Gipr −/− and GIP receptor antagonist‐treated Gipr +/+ mouse groups than in the untreated Gipr +/+ mouse group (Figure 6 A,B ).
Figure 6.
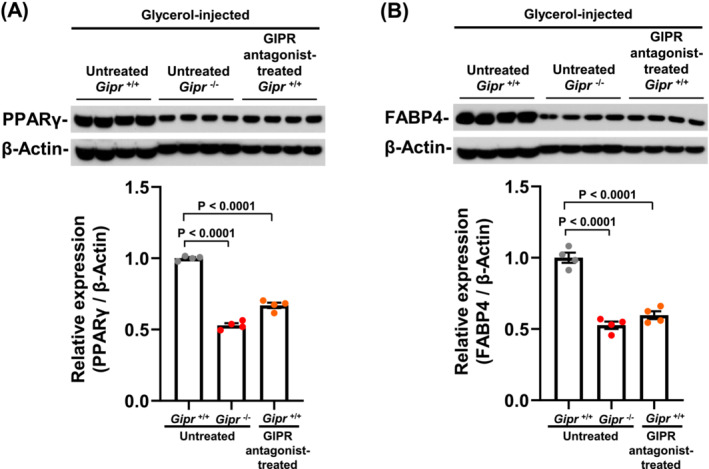
Gastric inhibitory polypeptide receptor (GIPR) antagonist decreases adipogenesis‐related protein expression levels in tibialis anterior (TA) muscle following glycerol injury. Western blot analyses for peroxisome proliferator‐activated receptor gamma (PPARγ) (A) and fatty acid binding protein 4 (FABP4) (B) in the TA muscles on Day 14 after glycerol injection into the TA muscles of 12‐week‐old Gipr +/+ and Gipr −/− mice. Upper and lower panels show representative western blots and their quantitative data, respectively. n = 4 TA muscles from 4 mice per group. All data are presented as mean ± SEM.
Gastric inhibitory polypeptide receptor antagonist increases locomotor activity
Behavioural tests were started after 3‐day administration of GIP receptor antagonist in a mixed high‐fat diet to Gipr +/+ mice at 9–10 weeks of age. There was no difference in behavioural phenotype evaluated by open field test and rotarod test between the untreated control and GIP receptor antagonist‐treated groups (Figure 7 A,C ). In light/dark transition test, the GIP receptor antagonist‐treated group exhibited a significant increase in distance travelled in light chamber, indicating that GIP receptor antagonist increases locomotor activity (Figure 7 B ).
Figure 7.
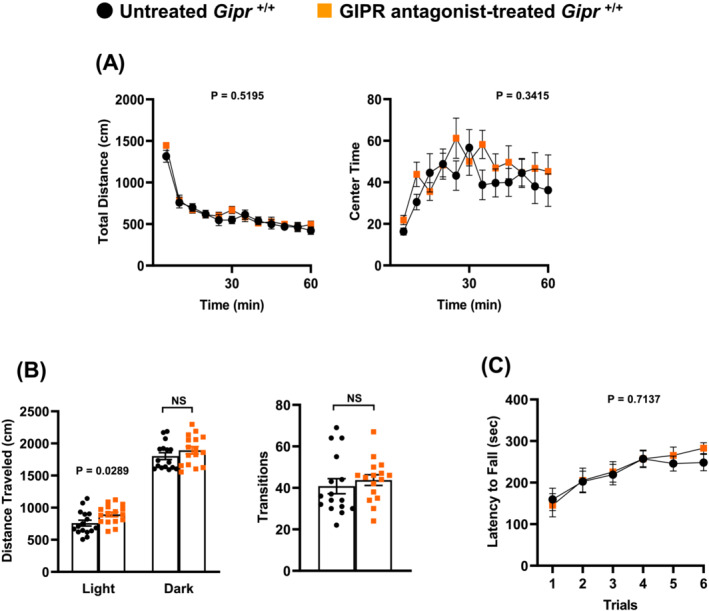
Gastric inhibitory polypeptide receptor (GIPR) antagonist increases locomotor activity. (A) Open field test, (B) light/dark transition test and (C) rotarod test. The behavioural tests were started after 3‐day administration of GIPR antagonist in a mixed high‐fat diet to Gipr +/+ mice at 9–10 weeks of age. n = 16 for untreated control Gipr +/+ mice and n = 16 for GIPR antagonist‐treated Gipr +/+ mice. All data are presented as mean ± SEM. NS, not significant. P values indicate interaction between two factors of untreated Gipr +/+ or GIPR antagonist‐treated Gipr +/+ and time or trials (A, C). NS, not significant.
Discussion
The present study was conducted to explore the role of GIP receptor signalling in age‐related declines of skeletal muscle mass and strength and the molecular mechanisms underlying these alterations and to evaluate the therapeutic potential of its blockade for sarcopenia treatment. We previously reported that 50‐week‐old Gipr −/− C57BL/6 mice exhibited a greater proportion of lean tissue mass than Gipr +/+ mice. 7 Zhu et al. reported decreased muscle mass and increased IMAT as a phenotype of sarcopenia in 72‐ to 88‐week‐old Gipr +/+ C57BL/6 mice. 32 However, it is unclear whether older Gipr −/− mice exhibit greater muscle mass and strength than older Gipr +/+ mice. Notably, we here demonstrated that 84‐week‐old Gipr +/+ mice showed a loss of muscle mass and weakened muscle strength with aging, whereas 84‐week‐old Gipr −/− mice did not display muscle mass loss with aging. Moreover, μCT analysis revealed that the lean tissue mass of the whole body in 104‐week‐old Gipr −/− mice was greater than that in 104‐week‐old Gipr +/+ mice. These findings suggest that GIP receptor signalling is closely associated with age‐related changes in skeletal muscle.
It is appreciated that IMAT is a pathological feature of muscle in sarcopenia. 33 This agrees with our observation of the increased IMAT area, as evidenced by the large number of perilipin‐positive cells, in 84‐week‐old Gipr +/+ mice showing decreased average muscle fibre diameter as compared with 12‐week‐old Gipr +/+ mice. Besides, average muscle fibre diameter was increased in 84‐week‐old Gipr −/− mice compared with 84‐week‐old Gipr +/+ mice. Given the evidence showing that the increase in muscle fibre diameter reflects the degree of muscle fibre regeneration, 34 our data indicate that muscle fibre regeneration in Gipr −/− mice is more effective than that in Gipr +/+ mice, suggesting the beneficial action of GIP receptor signalling blockade in muscle fibre regeneration. Regarding increases in muscle mass and strength via such enhanced muscle fibre regeneration, elevated physical activity also might affect them. Indeed, it has been reported that 24‐week‐old Gipr −/− mice show increased physical activity compared with 24‐week‐old Gipr +/+ mice. 35 Similarly, the present results demonstrated that Gipr −/− mice display higher locomotor activity caused by lower anxiety‐like behaviour and/or stronger desire for exploration and improved spatial learning and memory ability than Gipr +/+ mice at 10–20 weeks of age. This may be attributed to either the direct action of GIP receptor signalling blockade on the brain or the enhanced glucagon‐like peptide‐1 action in the brain by blocking the GIP action, as occurs in pancreatic β‐cells. 36 Unfortunately, the present study did not reveal whether such elevated physical activity affected increases in muscle mass and strength or whether increased muscle mass and strength contributed to physical activity enhancement in the aged Gipr −/− mice. To address this issue, further studies would be required.
Importantly, the concentration of plasma total GIP in Gipr +/+ mice has been reported to gradually increase with aging. 37 Furthermore, such increased GIP seems to be closely linked to adipogenesis with aging. Several direct adipocyte actions of GIP such as stimulation of adipogenesis and enhancement of lipoprotein lipase (LPL) have been identified. GIP enhances the activity of LPL on the cell surface of adipocytes that hydrolyses lipoprotein‐associated triglycerides to produce free fatty acids available for local uptake. 38 Free fatty acids and their derivatives act as ligands of PPARγ, which ultimately leads to the differentiation into mature adipocytes. 27 Given these lines of evidence, we hypothesized that FAPs of Gipr +/+ mice may be promoted to differentiate into mature adipocytes by GIP receptor signalling, whereas FAPs of Gipr −/− mice may maintain undifferentiated mesenchymal precursors. Expectedly, we observed that GIP addition to FAPs isolated from lower limb muscles of Gipr +/+ mice in vitro contributed to an increase in lipid droplets and an elevation in Pparg mRNA expression levels in adipogenically differentiated FAPs. This novel finding provides the first evidence that GIP receptor signalling operates similarly in adipocytes from common adipose tissue and FAPs. Factors synthesized by FAPs such as WISP1, BMP3B and follistatin support the differentiation of myogenic progenitors into mature muscle fibres. 28 , 29 , 30 It is noteworthy that Wisp1, Bmp3b and follistatin mRNA expression of FAPs was significantly downregulated along with GIP‐mediated promotion of FAPs to the differentiation into mature adipocytes in our in vitro study. Besides, we confirmed that muscle Wisp1, Bmp3b and follistatin mRNA expression levels were higher in Gipr −/− mice than in Gipr +/+ mice following glycerol injection into the TA muscles. Of the upregulated myogenic factors, follistatin has been well studied for its role in the regulation of muscle growth as an antagonist of myostatin that inhibits muscle growth. Indeed, transgenic mice overexpressing follistatin display increased muscle mass. 39 Furthermore, in a clinical trial involving patients with Becker muscular dystrophy treated with follistatin delivered by an adeno‐associated virus, increased muscle fibre size distribution with muscle hypertrophy was noted, and no adverse effects were apparent. 40 Considering that IMAT originates from the differentiation of FAPs into mature adipocytes, 26 the present findings collectively indicate that GIP contributes to the formation of IMAT and impairs muscle fibre regeneration by downregulating myogenesis factors such as WISP1, BMP3B and follistatin.
Another novel finding in the present study is that pharmacological blockade of GIP receptor signalling led to reduced IMAT area following glycerol injection into the TA muscles in Gipr +/+ mice. Nakamura et al. reported that the GIP receptor antagonist SKL‐14959 decreased triacylglycerol content in the liver and muscles, resulting in suppressed weight gain in diet‐induced obese mice. 23 We observed that the GIP receptor antagonists reduced the IMAT area and muscle Pparg mRNA levels and increased the muscle fibre diameter following glycerol injection into the TA muscles in Gipr +/+ mice. Unexpectedly, the GIP receptor antagonists did not significantly upregulate the muscle Wisp1, Bmp3b and follistatin mRNA expression levels. These findings may be attributed to a lower dosage of GIP receptor antagonist administered to the mice. In the present study, like Gipr −/− mice, GIP receptor antagonist treatment increased locomotor activity in Gipr +/+ mice, although the treatment term was short. This may indicate that the GIP receptor antagonist contributes to enhancing locomotor activity through promoting muscle fibre regeneration in mice. Taken together, our experimental data suggest that the GIP receptor antagonist treatment may be a novel therapeutic strategy for sarcopenia.
There are several limitations to this study. First, this study investigated the influences of systemic, but not muscle‐specific, GIP receptor deficiency and antagonism on muscle phenotypes. Second, we have not examined the direct effects of favourable factors for efficient myogenesis such as WISP1, BMP3B and follistatin on muscle regeneration. Therefore, further studies are required to support the present findings.
In summary, our study demonstrates that GIP receptor signalling could be responsible for the development of sarcopenia accompanied by aging via promoting the differentiation of FAPs into mature adipocytes in skeletal muscles and the following IMAT formation and thereby reducing muscle regeneration (Figure 8 ). Furthermore, it is likely that blockade of GIP receptor signalling facilitates an increase in muscle mass without any adverse influence on cognitive function and physical activity. Finally, the present findings suggest that pharmacological GIP receptor antagonism may serve as a novel therapeutic approach for sarcopenia.
Figure 8.
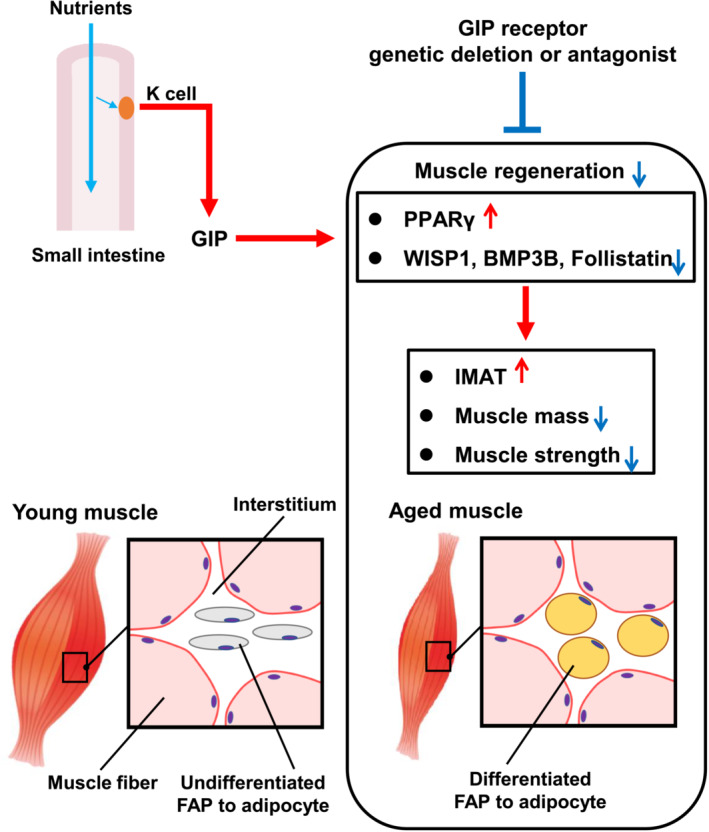
Proposed mechanism of age‐related muscle mass and strength reduction by gastric inhibitory polypeptide (GIP) and muscle protection by inhibition of GIP receptor signalling. BMP3B, bone morphogenetic protein 3B; FAP, fibro‐adipogenic progenitor; IMAT, intramuscular adipose tissue; PPARγ, peroxisome proliferator‐activated receptor gamma; WISP1, WNT1‐inducible signalling pathway protein 1.
Conflict of interest statement
The authors declare no conflicts of interest.
Supporting information
Data S1. Supporting Information.
Table S1. Reagent and antibody list.
Table S2. Primer list.
Acknowledgements
We thank Kaoru Sakamoto, Kayoko Kagaya, Hiromi Fujishima and Takahito Jomori for their technical support. This work was supported by Japan Agency for Medical Research and Development (AMED) (JP20ek0210111), Suzuken Memorial Foundation (21‐092), JSPS KAKENHI (16H06276, 22H04922, 23K16764) and MEXT Promotion of Distinctive Joint Research Center Program (JPMXP0618217663, JPMXP0621467949). The authors of this manuscript certify that they comply with the ethical guidelines for authorship and publishing in the Journal of Cachexia, Sarcopenia and Muscle. 41
Takahashi Y., Fujita H., Seino Y., Hattori S., Hidaka S., Miyakawa T., et al (2023) Gastric inhibitory polypeptide receptor antagonism suppresses intramuscular adipose tissue accumulation and ameliorates sarcopenia, Journal of Cachexia, Sarcopenia and Muscle, 14, 2703–2718, doi: 10.1002/jcsm.13346
Contributor Information
Hiroki Fujita, Email: hirofuji@gipc.akita-u.ac.jp.
Yuichiro Yamada, Email: yamada.yuuichiro@a3.kepco.co.jp.
References
- 1. Cruz‐Jentoft AJ, Bahat G, Bauer J, Boirie Y, Bruyere O, Cederholm T, et al. Sarcopenia: revised European consensus on definition and diagnosis. Age Ageing 2019;48:16–31. [DOI] [PMC free article] [PubMed] [Google Scholar]
- 2. Chen LK, Woo J, Assantachai P, Auyeung TW, Chou MY, Iijima K, et al. Asian Working Group for Sarcopenia: 2019 consensus update on sarcopenia diagnosis and treatment. J Am Med Dir Assoc 2020;21:300–307.e2. [DOI] [PubMed] [Google Scholar]
- 3. Cruz‐Jentoft AJ, Sayer AA. Sarcopenia. Lancet 2019;393:2636–2646. [DOI] [PubMed] [Google Scholar]
- 4. Baggio LL, Drucker DJ. Biology of incretins: GLP‐1 and GIP. Gastroenterology 2007;132:2131–2157. [DOI] [PubMed] [Google Scholar]
- 5. Seino Y, Yabe D. Glucose‐dependent insulinotropic polypeptide and glucagon‐like peptide‐1: incretin actions beyond the pancreas. J Diabetes Investig 2013;4:108–130. [DOI] [PMC free article] [PubMed] [Google Scholar]
- 6. Miyawaki K, Yamada Y, Ban N, Ihara Y, Tsukiyama K, Zhou H, et al. Inhibition of gastric inhibitory polypeptide signaling prevents obesity. Nat Med 2002;8:738–742. [DOI] [PubMed] [Google Scholar]
- 7. Yamada C, Yamada Y, Tsukiyama K, Yamada K, Yamane S, Harada N, et al. Genetic inactivation of GIP signaling reverses aging‐associated insulin resistance through body composition changes. Biochem Biophys Res Commun 2007;364:175–180. [DOI] [PubMed] [Google Scholar]
- 8. Goodpaster BH, Bergman BC, Brennan AM, Sparks LM. Intermuscular adipose tissue in metabolic disease. Nat Rev Endocrinol 2022;19:285–298. [DOI] [PubMed] [Google Scholar]
- 9. Ogawa M, Belavy DL, Yoshiko A, Armbrecht G, Miokovic T, Felsenberg D, et al. Effects of 8 weeks of bed rest with or without resistance exercise intervention on the volume of the muscle tissue and the adipose tissues of the thigh. Physiol Rep 2020;8:e14560. [DOI] [PMC free article] [PubMed] [Google Scholar]
- 10. Biltz NK, Collins KH, Shen KC, Schwartz K, Harris CA, Meyer GA. Infiltration of intramuscular adipose tissue impairs skeletal muscle contraction. J Physiol 2020;598:2669–2683. [DOI] [PMC free article] [PubMed] [Google Scholar]
- 11. Goodpaster BH, Krishnaswami S, Resnick H, Kelley DE, Haggerty C, Harris TB, et al. Association between regional adipose tissue distribution and both type 2 diabetes and impaired glucose tolerance in elderly men and women. Diabetes Care 2003;26:372–379. [DOI] [PubMed] [Google Scholar]
- 12. Waters DL. Intermuscular adipose tissue: a brief review of etiology, association with physical function and weight loss in older adults. Ann Geriatr Med Res 2019;23:3–8. [DOI] [PMC free article] [PubMed] [Google Scholar]
- 13. Marcus RL, Addison O, Kidde JP, Dibble LE, Lastayo PC. Skeletal muscle fat infiltration: impact of age, inactivity, and exercise. J Nutr Health Aging 2010;14:362–366. [DOI] [PMC free article] [PubMed] [Google Scholar]
- 14. Pagano AF, Brioche T, Arc‐Chagnaud C, Demangel R, Chopard A, Py G. Short‐term disuse promotes fatty acid infiltration into skeletal muscle. J Cachexia Sarcopenia Muscle 2018;9:335–347. [DOI] [PMC free article] [PubMed] [Google Scholar]
- 15. Chen W, You W, Valencak TG, Shan T. Bidirectional roles of skeletal muscle fibro‐adipogenic progenitors in homeostasis and disease. Ageing Res Rev 2022;80:101682. [DOI] [PubMed] [Google Scholar]
- 16. Giuliani G, Rosina M, Reggio A. Signaling pathways regulating the fate of fibro/adipogenic progenitors (FAPs) in skeletal muscle regeneration and disease. FEBS J 2022;289:6484–6517. [DOI] [PubMed] [Google Scholar]
- 17. Wosczyna MN, Konishi CT, Perez Carbajal EE, Wang TT, Walsh RA, Gan Q, et al. Mesenchymal stromal cells are required for regeneration and homeostatic maintenance of skeletal muscle. Cell Rep 2019;27:2029–2035.e5. [DOI] [PMC free article] [PubMed] [Google Scholar]
- 18. Miyawaki K, Yamada Y, Yano H, Niwa H, Ban N, Ihara Y, et al. Glucose intolerance caused by a defect in the entero‐insular axis: a study in gastric inhibitory polypeptide receptor knockout mice. Proc Natl Acad Sci U S A 1999;96:14843–14847. [DOI] [PMC free article] [PubMed] [Google Scholar]
- 19. Beaucage KL, Pollmann SI, Sims SM, Dixon SJ, Holdsworth DW. Quantitative in vivo micro‐computed tomography for assessment of age‐dependent changes in murine whole‐body composition. Bone Rep 2016;5:70–80. [DOI] [PMC free article] [PubMed] [Google Scholar]
- 20. Takahashi Y, Shimizu T, Kato S, Nara M, Suganuma Y, Sato T, et al. Reduction of superoxide dismutase 1 delays regeneration of cardiotoxin‐injured skeletal muscle in KK/Ta‐Ins2 Akita mice with progressive diabetic nephropathy. Int J Mol Sci 2021;22:5491. [DOI] [PMC free article] [PubMed] [Google Scholar]
- 21. Fujita H, Morii T, Fujishima H, Sato T, Shimizu T, Hosoba M, et al. The protective roles of GLP‐1R signaling in diabetic nephropathy: possible mechanism and therapeutic potential. Kidney Int 2014;85:579–589. [DOI] [PubMed] [Google Scholar]
- 22. Heredia JE, Mukundan L, Chen FM, Mueller AA, Deo RC, Locksley RM, et al. Type 2 innate signals stimulate fibro/adipogenic progenitors to facilitate muscle regeneration. Cell 2013;153:376–388. [DOI] [PMC free article] [PubMed] [Google Scholar]
- 23. Nakamura T, Tanimoto H, Mizuno Y, Okamoto M, Takeuchi M, Tsubamoto Y, et al. Gastric inhibitory polypeptide receptor antagonist, SKL‐14959, suppressed body weight gain on diet‐induced obesity mice. Obes Sci Pract 2018;4:194–203. [DOI] [PMC free article] [PubMed] [Google Scholar]
- 24. Shoji H, Takao K, Hattori S, Miyakawa T. Age‐related changes in behavior in C57BL/6J mice from young adulthood to middle age. Mol Brain 2016;9:11. [DOI] [PMC free article] [PubMed] [Google Scholar]
- 25. Itabe H, Yamaguchi T, Nimura S, Sasabe N. Perilipins: a diversity of intracellular lipid droplet proteins. Lipids Health Dis 2017;16:83. [DOI] [PMC free article] [PubMed] [Google Scholar]
- 26. Uezumi A, Fukada S, Yamamoto N, Takeda S, Tsuchida K. Mesenchymal progenitors distinct from satellite cells contribute to ectopic fat cell formation in skeletal muscle. Nat Cell Biol 2010;12:143–152. [DOI] [PubMed] [Google Scholar]
- 27. Francis GA, Fayard E, Picard F, Auwerx J. Nuclear receptors and the control of metabolism. Annu Rev Physiol 2003;65:261–311. [DOI] [PubMed] [Google Scholar]
- 28. Lukjanenko L, Karaz S, Stuelsatz P, Gurriaran‐Rodriguez U, Michaud J, Dammone G, et al. Aging disrupts muscle stem cell function by impairing matricellular WISP1 secretion from fibro‐adipogenic progenitors. Cell Stem Cell 2019;24:433–446.e7. [DOI] [PMC free article] [PubMed] [Google Scholar]
- 29. Uezumi A, Ikemoto‐Uezumi M, Zhou H, Kurosawa T, Yoshimoto Y, Nakatani M, et al. Mesenchymal Bmp3b expression maintains skeletal muscle integrity and decreases in age‐related sarcopenia. J Clin Invest 2021;131. [DOI] [PMC free article] [PubMed] [Google Scholar]
- 30. Zhu J, Li Y, Lu A, Gharaibeh B, Ma J, Kobayashi T, et al. Follistatin improves skeletal muscle healing after injury and disease through an interaction with muscle regeneration, angiogenesis, and fibrosis. Am J Pathol 2011;179:915–930. [DOI] [PMC free article] [PubMed] [Google Scholar]
- 31. Pagano AF, Demangel R, Brioche T, Jublanc E, Bertrand‐Gaday C, Candau R, et al. Muscle regeneration with intermuscular adipose tissue (IMAT) accumulation is modulated by mechanical constraints. PLoS ONE 2015;10:e0144230. [DOI] [PMC free article] [PubMed] [Google Scholar]
- 32. Zhu S, Tian Z, Torigoe D, Zhao J, Xie P, Sugizaki T, et al. Aging‐ and obesity‐related peri‐muscular adipose tissue accelerates muscle atrophy. PLoS ONE 2019;14:e0221366. [DOI] [PMC free article] [PubMed] [Google Scholar]
- 33. Mogi M, Kohara K, Nakaoka H, Kan‐No H, Tsukuda K, Wang XL, et al. Diabetic mice exhibited a peculiar alteration in body composition with exaggerated ectopic fat deposition after muscle injury due to anomalous cell differentiation. J Cachexia Sarcopenia Muscle 2016;7:213–224. [DOI] [PMC free article] [PubMed] [Google Scholar]
- 34. Kang X, Yang MY, Shi YX, Xie MM, Zhu M, Zheng XL, et al. Interleukin‐15 facilitates muscle regeneration through modulation of fibro/adipogenic progenitors. Cell Commun Signal 2018;16:42. [DOI] [PMC free article] [PubMed] [Google Scholar]
- 35. Hansotia T, Maida A, Flock G, Yamada Y, Tsukiyama K, Seino Y, et al. Extrapancreatic incretin receptors modulate glucose homeostasis, body weight, and energy expenditure. J Clin Invest 2007;117:143–152. [DOI] [PMC free article] [PubMed] [Google Scholar]
- 36. Seino Y, Yamazaki Y. Roles of glucose‐dependent insulinotropic polypeptide in diet‐induced obesity. J Diabetes Investig 2022;13:1122–1128. [DOI] [PMC free article] [PubMed] [Google Scholar]
- 37. Kanemaru Y, Harada N, Shimazu‐Kuwahara S, Yamane S, Ikeguchi E, Murata Y, et al. Absence of GIP secretion alleviates age‐related obesity and insulin resistance. J Endocrinol 2020;245:13–20. [DOI] [PMC free article] [PubMed] [Google Scholar]
- 38. Kim SJ, Nian C, McIntosh CH. Activation of lipoprotein lipase by glucose‐dependent insulinotropic polypeptide in adipocytes. A role for a protein kinase B, LKB1, and AMP‐activated protein kinase cascade. J Biol Chem 2007;282:8557–8567. [DOI] [PubMed] [Google Scholar]
- 39. Lee SJ, McPherron AC. Regulation of myostatin activity and muscle growth. Proc Natl Acad Sci U S A 2001;98:9306–9311. [DOI] [PMC free article] [PubMed] [Google Scholar]
- 40. Mendell JR, Sahenk Z, Malik V, Gomez AM, Flanigan KM, Lowes LP, et al. A phase 1/2a follistatin gene therapy trial for Becker muscular dystrophy. Mol Ther 2015;23:192–201. [DOI] [PMC free article] [PubMed] [Google Scholar]
- 41. von Haehling S, Morley JE, Coats AJS, Anker SD. Ethical guidelines for publishing in the Journal of Cachexia, Sarcopenia and Muscle: update 2021. J Cachexia Sarcopenia Muscle 2021;12:2259–2261. [DOI] [PMC free article] [PubMed] [Google Scholar]
Associated Data
This section collects any data citations, data availability statements, or supplementary materials included in this article.
Supplementary Materials
Data S1. Supporting Information.
Table S1. Reagent and antibody list.
Table S2. Primer list.


