

Abstract
Vomocytosis is a process that occurs when internalized fungal pathogens escape from phagocytes without compromising the viability of the pathogen and the host cell. Manual quantification of time-lapse microscopy videos is currently used as the standard to study pathogen behavior and vomocytosis incidence. However, human-driven quantification of vomocytosis (and the closely related phenomenon, exocytosis) is incredibly burdensome, especially when a large volume of cells and interactions needs to be analyzed. In this study, we designed a MATLAB algorithm that measures the extent of colocalization between the phagocyte and fungal cell (Cryptococcus neoformans; CN) and rapidly reports the occurrence of vomocytosis in a high throughput manner. Our code processes multichannel, time-lapse microscopy videos of cocultured CN and immune cells that have each been fluorescently stained with unique dyes and provides quantitative readouts of the spatiotemporally dynamic process that is vomocytosis. This study also explored metrics, such as the rate of change of pathogen colocalization with the host cell, that could potentially be used to predict vomocytosis occurrence based on the quantitative data collected. Ultimately, the algorithm quantifies vomocytosis events and reduces the time for video analysis from over 1 h to just 10 min, a reduction in labor of 83%, while simultaneously minimizing human error. This tool significantly minimizes the vomocytosis analysis pipeline, accelerates our ability to elucidate unstudied aspects of this phenomenon, and expedites our ability to characterize CN strains for the study of their epidemiology and virulence.
Keywords: Vomocytosis, Algorithm, Detection, Fluorescence, Time-Lapse Microscopy, Quantification, Macrophage, Cryptococcus neoformans, Cell Tracking
Introduction
Innate immune cells, such as macrophages (MΦs) and dendritic cells (DCs), use a mechanism called “phagocytosis” for the ingestion and elimination of microorganisms, foreign substances, and apoptotic cells larger than 0.5 μm in diameter.1 Consequently, this phenomenon plays a crucial role in both the innate and adaptive immune response. To study phagocytosis and determine its occurrence quantitatively, time-lapse microscopy is often used.2 Although time-lapse microscopy has served as a powerful tool for identifying and visualizing phagocytic events, manual evaluation of these time-lapse videos is time-consuming, laborious, and error-prone.3 The limitations of conventional quantification methods for phagocytosis events have led to an increased effort over the past decade to create high throughput computer algorithms that recognize phagocytosis events and replace manual quantification.4
A more recently discovered phenomenon known as “vomocytosis” has also garnered attention in quantitative studies. Vomocytosis is where an internalized fungal pathogen escapes from a phagocyte without compromising the viability of both the pathogen and the host cell.5 This mechanism has been observed and measured in Cryptococcus neoformans (CN) infections of macrophages, neutrophils, and dendritic cells.6−8 CN infections are known to affect immunocompromised patients, disseminating from the lungs to the central nervous system. Notably, vomocytosis is thought to be one of CN’s core mechanisms of immune evasion that allows for traversal through the blood–brain barrier and eventual dissemination into the brain environment.9 Therefore, elucidating the mechanisms behind vomocytosis may lead to cures for Cryptococcal Meningitis and could even influence other fields, such as drug delivery.
Similar to phagocytosis, time-lapse microscopy is primarily utilized to visualize and quantify vomocytosis events by CN in vitro. Since vomocytosis events occur over a range of 5 to 12 h after coincubation, long-term tracking of immune cells and fungi is required.10 Predictably, human quantification of vomocytosis occurrence can become burdensome, especially when a large volume of cells and interactions needs to be analyzed. The dependence on human quantification greatly impedes progress toward comprehensive understanding of vomocytosis and stunts advancement toward the development of effective medicines for CN-related infections.
The difficulties in manual quantification of large-scale cell microscopy videos have sparked interest in algorithmic or other objective methodologies to investigate cell tracking and interactions. To expedite and homogenize quantification of phagocytosis events, several pre-existing methods in the literature use algorithms to recognize phagocytosis events. An algorithm to investigate the phagocytosis of the fungus Aspergillus fumigatus conidia by macrophages in a confrontation assay was conducted through the use of thresholding, segmentation, and object-based classification from confocal laser microscopy images.11 Another algorithm focused on tracking and identifying the phagocytic interactions between polymorphonuclear neutrophils and the fungus Candida glabrata through multichannel time-lapse microscopy.4 Although algorithms to identify phagocytic events exist, there are no algorithms allowing for automated cell tracking and quantification of vomocytosis in time-lapse microscopy videos. Interestingly, a multi-fluorophore reporter system composed of two in situ staining steps and a flow cytometry readout was developed to measure vomocytosis rates, bypassing the need for microscopy imaging altogether.12
Although the methods used to track cells are transferable from phagocytosis applications, techniques to quantify phagocytosis events cannot be used to quantify vomocytosis events. Fundamentally, in phagocytosis, immune cells must be tracked until evidence of pathogen internalization is seen. Therefore, there is no need to track the particulate after internalization and colocalization occurs with the host cells.13 This differs with vomocytosis where immune cells with colocalized pathogens must be tracked until evidence of pathogen escape is observed. Once expelled from the cell, the pathogen no longer requires tracking, as the goal is to identify the expulsion event.
To address this strategic difference between the two phenomena, we designed a novel MATLAB algorithm that tracks immune cells throughout a time-lapse microscopy video. This computational process measures the extent of colocalization between the phagocyte and CN and rapidly reports the occurrence of vomocytic events in a high throughput manner. Our code processes multichannel, time-lapse microscopy videos of cocultured CN and immune cells that have each been fluorescently stained with unique dyes. Applied computer vision principles were then used to empower the programmatic derivation of image meaning from our visual microscopy data. This derivation elucidated key features of image frame(s), such as cell boundaries, cell shape, and cell movement. Afterward, we performed a pixel-by-pixel analysis that provided quantitative representations of spatiotemporal processes in real time (Figure 1).
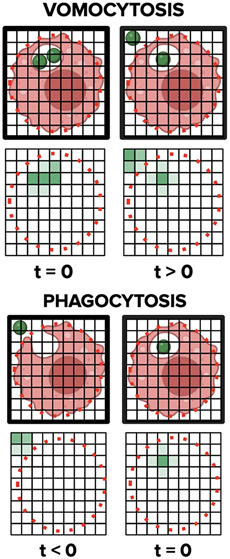
Figure 1.

Process workflow for a facile vomocytosis quantification algorithm. A) .avi files were exported from the BZ-X analyzer, and individual image frames were extracted from the movie. Host immune cells (red/green) and fungal pathogens (green/blue) were viewed through two separate fluorescent channels. Each image was then segmented, cellular entities were tracked, and pixel data were quantified with the objective of evaluating vomocytosis incidence. B) Representative diagrams showing how fungal pathogen colocalization changes during vomocytosis and phagocytosis.
Ultimately, we anticipate that the development of this novel tool will greatly minimize the vomocytosis analysis pipeline, accelerate our ability to elucidate unstudied aspects of this phenomenon, and expedite our ability to characterize CN strains for the study of their epidemiology and virulence.
Methods
Cell Culture
Bone marrow derived macrophages (BMDMs) were obtained from 8–12 weeks old, male and female, C57BL/6J mice in accordance with guidelines approved by the University of California, Davis, Animal Care and Use Committee (IACUC) using a modified 10-day protocol.14 For reference, the IACUC protocol number is 21840. Mice were euthanized by CO2 asphyxiation followed by cervical dislocation, and the tibias and femurs were harvested for the isolation of bone marrow cells. The bone marrow cells were obtained by flushing the shaft of the long bones with a 25G needle using RPMI medium with l-glutamine and 25 mM HEPES (Mediatech, Manassas, VA) containing 1% fetal bovine serum (Mediatech) and 1% penicillin/streptomycin (Hyclone) and mixed to make a homogeneous suspension. The suspension was then strained using 70 μm cell strainers (Becton Dickinson, NJ, United States), and cells were collected at 1800 rpm for 5 min. The red blood cells (RBCs) were lysed with ACK lysis buffer (Lonza, Walkersville, MD) followed by centrifugation at 1800 rpm for 5 min to recover leukocytes. Leukocytes were then resuspended in DMEM/F-12 1:1 with l-glutamine (Cellgro, Herndon, VA), 10% fetal bovine serum, 1% sodium pyruvate (Lonza, Walkersville, MD), 1% nonessential amino acids (Lonza, Walkersville, MD), 1% penicillin/streptomycin (Hyclone), and L929 conditioned media. These cells were plated on tissue culture flasks for 2 days to remove adherent cells. At 2 days, the nonadherent cells were transferred to low attachment plates and cultured in fresh BMDM media for expansion of macrophage precursor cells. At 6 days, cells were transferred to tissue culture plates to allow for cell adhesion and proliferation. At 10 days, the cells were seeded on 8-well chambered slides (Nunk Lab-Tec II, ThermoFisher) at a cell density of 75,000 cells per well for DCs or 50,000 cells per well for MΦs and used for CN infections and time-lapse studies.
C. neoformans Infections and Time-lapse Imaging Experiments
C. neoformans strain H99, graciously provided by the Gelli Lab at UC Davis, was used to infect mammalian cells. For reference, we received biological user authorization to use the fungus Cryptococcus neoformans for our investigations (Protocol # BUA-R2542). These fungal cells were initially grown on yeast extract peptone dextrose (YPD) agar at 30 °C until visible colonies formed. Next, a single colony of C. neoformans was grown overnight in 10 mL of YPD broth at 30 °C in a shaking incubator at 150 rpm. The next day, macrophages seeded the day before at a cell density of ∼2.5 × 10⁴ cells/cm2, were stained with 1 μM lipophilic dye that integrates into the cell plasma (CellMask Deep Red Plasma Membrane Stain, Invitrogen, USA).
These cells were coincubated with CNs opsonized with pooled human antibody serum and 18B7 antibody and stained with calcofluor white stain (Sigma, USA) at a 5:1 fungal cell:phagocyte infection ratio for 2 h. Extracellular fungi were removed by washing five times with a warm and fresh medium.
Subsequently, fluorescent time-lapse microscopy videos of the coincubated culture were performed for 14 h using the Keyence BZ-X700 Series Microscope. Samples were kept at 37 °C and 5% CO2 in the microscope imaging chamber under sufficient humidity provided by a water bath. Images were taken every 4 min for 14 h and compiled into single movie files (.avi) for analysis using BZX-Analyzer (Figure 2A).
Figure 2.

Methods: cell culture, image processing, and nearest neighbor linking. A) Experimental procedure for cell staining, culturing, and imaging. MΦs and CNs were stained with different dyes and were coincubated for 2 h. Noninternalized CNs were removed by washing with fresh medium. Time-lapse microscopy was performed for 14 h, immediately after washing. B) Unprocessed grayscale image of immune cells with internalized CN. C) Segmented image. D) Labeled image after boundary evaluation and cell identification. E) Image overlay of red fluorescent channel (host immune cell) and green fluorescent channel (CN). F) Segmentation and labeling of fluorescent image. G) Diameter of a macrophage measured in pixels. H) Visualization of the nearest neighbor linking strategy used to track cells across multiple frames. The NNA measures Euclidean distances from the cell of interest in Frame n to the centroid of all of the labeled cells in Frame n – 1. It follows that the cell in Frame n – 1 which has the smallest distance to the cell of interest in Frame n would likely be its temporal predecessor. In this manner, the identities of cells can be linked through time.
Movies were blinded by a third party before manual scoring for vomocytosis and macrophage integrity. Vomocytosis was scored visually on select videos using the following preset guidelines:
-
(1)
A vomocytosis event was defined as the expulsion of internalized CN from an infected MΦ or other innate immune cell, regardless of the number of CN expelled, if expelled simultaneously.
-
(2)
Vomocytosis events were scored as independent phenomena if they occur in different frames or from different MΦ.
-
(3)
Vomocytosis events were discounted if the host BMDM subsequently undergoes lysis or apoptosis within 30 min.
Image Segmentation and Tracking
Each image of the time-lapse imaging experiment went through image segmentation. This process was implemented via thresholding and ultimately promoted a more accurate programmatic understanding of the image and the extraction of regular patterns. As depicted in Figure 2B and 2C, segmentation divided a frame into two distinct regions based on various parameters, most notably through a threshold value T. A segmented image clearly differentiates the regions of interest (ROI) from the background. Dark and homogeneous pixel subsets in the image delineated areas of interest, or cells.
By comparing the image intensity at every pixel location Ii,j with T, the program determined whether to turn the pixel at position i,j either black or white, binarizing the entire image. Along with the removal of image noise and background, cell boundaries were easily determined via edge detection strategies due to the high signal-to-noise ratio and high contrast created by the prior segmentation process. Because it is difficult to analyze raw image data without preprocessing the image to automate the analysis process, through the process of image segmentation via thresholding, the image becomes much easier and more accurate to process programmatically. Specifically, in the case of the cells stained with CellMask Deep Red, a T value was compared to each pixel location in the red color channel to binarize the image in preprocessing. After testing several different integer values from 0 to 255, a T value of 20 was selected. If Ii,j > 20, the corresponding pixel becomes white. Conversely, if Ii,j < 20, the corresponding pixel becomes black. After segmenting the image, cell boundaries are traced, and each object is given a numeric ID, as shown in Figure 2D.
A size-based checkpoint was also used to enhance the clarity of the segmented images. To distinguish macrophages from fluorophore residue and cellular debris, an area of 100 pixels was set as the floor threshold.15 A floor threshold area of 100 pixels translates to a diameter of 11.28 pixels for a circular cell. We found that this baseline effectively eliminated any artifacts or smaller debris from the processed image. The macrophage pictured in Figure 2G with a diameter of approximately 17 pixels provides insight into the average size of an immune cell under our microscopy and algorithmic settings.
Tracking these cells over multiple image frames and eventually through an entire video was the next step. In order to best identify vomocytic events, experiments were run with relatively low cell density (26,300 cells/cm2), which translated to 50–75 cells in the viewing frame using a 10× objective. These parameters allowed for the effective implementation of a nearest neighbor linking approach (NNA), which employs an assessment of distance minimization, for cell tracking.16 With NNA, each cell’s boundary information was stored as a polygonal shape, which allowed for ease of centroid analysis and the application of the Euclidean strategy over multiple frames. This methodology stored the centroid location of all cells in Frame n – 1 and compared these coordinate pairs with the centroid location of the cell in question in Frame n. The centroid location (point A at the center of Cell A) in Frame n – 1 that has the smallest Euclidean distance to the centroid of interest (point B at the center of the cell in question) in Frame n would indicate that the cell in question is likely Cell A. NNA allowed for a higher degree of confidence when determining cell identity preservation over time by minimizing the occurrence of two or more cells being assigned the same ID due to having Euclidean distances similar to the same predecessor cell in Frame n – 1. Our program sorts through and delineates the identities of each cell in Frame n, allowing for comprehensive tracking of each cell. This NNA is depicted in Figure 2H.
Pixel-by-Pixel Color Analysis
After validating both the cell identification and tracking components of the algorithm, we derived pixel-based information that offered quantitative data about the occurrence of a vomocytic event. The previously discussed segmentation and tracking procedures were applied to the fluorescent image overlay of the coincubated mammalian cells and pathogen, stained with CellMask Deep Red and calcofluor, respectively (Figure 2E and 2F). This overlay enables a programmatic assessment of the extent of pathogen internalization in the host cell.
The color map information on the overlay, which contained an RGB value for each pixel in the image, was stored. Then, for a given mammalian cell #X, the fluorescence intensity of the pathogen’s corresponding RGB component was extracted within its established boundaries, and this pixel data was represented with their arithmetic mean. For instance, in the case of the experiment in Figure 3 in which green was applied to differentiate calcofluor fluorescence, we calculated “how green” the red host immune cell was at each frame of the microscopy video.
Figure 3.

Corroboration of photographical and analytical evidence of vomocytosis. A) Macrophage #6 captured at regular intervals between Frames 1 and 25. B) Graph of green internal fluorescence (px) vs time. Red points on the plot denote frames (12–14) in which the fluorescence value is dropping rapidly. C) Derivative of green internal fluorescence (px/frame) vs time. Red points on the plot denote frames (12–14) in which the derivative value is the most negative. D) Macrophage #12 captured at regular intervals between Frames 1 and 25. E) Graph of green internal fluorescence (px) vs time. F) Derivative of green internal fluorescence (px/frame) vs time.
After the acquisition of pixel data, a process
needed to be established
to streamline vomocytosis event determination. To do this, we calculated
the minimum value of the derivative of each cell’s internal
fluorescence over time (the total green pixel summation inside the
host immune cell at each frame). We hypothesized that for a vomocytic
event the green internal fluorescence of a host immune cell will rapidly
decrease over ∼5 image frames as the fungal pathogen leaves
the cell boundary. This will lead to highly negative raw derivative
values. If a vomocytosis event does not occur, then the cell’s
internal fluorescence may still decay, but the magnitude of the rate
of decay would be significantly less than an expulsion event. The
integral area between the derivative curve and a horizontal line at  was also tested. The definite integral
of the time derivative gives the total duration of the potential
vomocytosis event. In other words, we are able to see how much time
the cell experienced a rate of decay larger than −500 px/frame.
A large area symbolizes a large net change in the internal fluorescence.
Using a combination of these metrics allows the algorithm to gate
for true vomocytosis events with a higher probability while filtering
out some false positives, which may have large negative derivative
values but small area under the curve.
was also tested. The definite integral
of the time derivative gives the total duration of the potential
vomocytosis event. In other words, we are able to see how much time
the cell experienced a rate of decay larger than −500 px/frame.
A large area symbolizes a large net change in the internal fluorescence.
Using a combination of these metrics allows the algorithm to gate
for true vomocytosis events with a higher probability while filtering
out some false positives, which may have large negative derivative
values but small area under the curve.
Data and Statistical Analysis
GraphPad Prism 9 was used to create all column graphs and perform all statistical analyses. Continuous data of fluorescence metric values in the different sample groups were determined to be non-normal using a Shapiro–Wilk normality test. Therefore, statistical comparisons between groups were conducted using a nonparametric Kruskal–Wallis test corrected for multiple comparisons using Dunn’s test. For comparisons between only two groups, a statistical evaluation was completed using a nonparametric Mann–Whitney test. Original time-lapse movies, upon which manual scoring was performed, are freely available upon request. All column graphs, generated on GraphPad Prism 9, display the individual data points, mean, and standard error of the mean (SEM).
Results
Validation of ‘Rate of Fluorescence Decay’ as a Metric of Vomocytosis
We present internal fluorescence data (green channel only) from two different macrophages, one that participated in a vomocytosis event and another that did not, to study whether any differences in acquired metrics emerged from the comparison. Figure 3 provides both visual and quantitative insight into how the algorithm converts image data into quantitative numerical readouts. In Figure 3A, we observe Macrophage #6 at different time points between Frames 1 and 25 in a time-lapse microscopy video. In Frame 1, it is evident that the 2 CNs are well within the boundaries of the host immune cell. However, in Frame 20, the C. Neoformans cell, which was previously within the blue boundary line of the host cell, has escaped. This vomocytosis event is clearly captured by the corresponding plots. Figure 3B shows a graph of internal fluorescence (px) vs time. For clarity, all references to “fluorescence” or “internal fluorescence” relate only to the specific color layer that corresponds to the fungal pathogen, and not all 3 color layers (red, green, and blue) together. Furthermore, the “time” axis can be easily read in units of frame number as well as minutes. Each tick mark represents 5 frames, which is equal to 20 min in real time. In this graph, a precipitous decrease in fluorescence of 4721 px is observed from Frames 12 to 14, signaling that a significant amount of “green”, or fungal pathogen, is leaving the boundaries of the host immune cell. A similar conclusion can be drawn by looking at the graph in Figure 3C, in which the large negative value of the derivative (−1307 px/frame) indicates that the internal fluorescence of the host immune cell is rapidly decaying near the Frame 12 time point. This observation corroborates our hypothesis that a vomocytic event has occurred.
Contrary to Macrophage #6, it is evident that Macrophage #12 in Figure 3D does not demonstrate a vomocytic event during the 25 frames shown in the figure. However, there is still observable fluorescence decay. The notable difference between the decays exemplified in Figure 3B and 3E is their rate at distinct points. Figure 3E illustrates a more gradual decline of internal fluorescence from a value of 7779 to 3636 px over 20 image frames due to nonvomocytosis factors such as photobleaching or fluorophore reactivity. Furthermore, the derivative plot in Figure 3F oscillates at near-zero values, demonstrating that the decay in the internal fluorescence was gradual.
Exploring Impacts of Noise on Long-Term Fluorescence Tracking
After testing the algorithm on a shorter video with a length of 20 image frames, we then evaluated the algorithm’s capacity to analyze longer videos with a length of 100 frames (400 min or 6.67 h). After this time point, we found that the fluorescence intensity in the time-lapse microscopy video diminished significantly, to where vomocytic fluorescence decay and nonvomocytic fluorescence decay are indistinguishable. In Figure 4, raw fluorescence data for all immune cells in a time-lapse microscopy video is displayed. The graph in Figure 4A features data from a heat-killed control and shows that no vomocytosis events occurred, which correlated to no large declines in internal fluorescence over 100 frames. Conversely, in Figure 4B (live CN), several trajectories are distinct. For instance, the topmost trajectory (boxed in red and visualized in Figure 4E) experiences a steep decline in fluorescence from Frames 70 to 100 and does indeed experience a vomocytosis event (based on visual inspection). It is also interesting to note that the internal fluorescence value of Macrophage #6 is significantly higher than all other cells in the video.
Figure 4.

Reducing noise in long-term fluorescence tracking. A) Fluorescence trajectories of all macrophages, which were coincubated with heat-killed CN, present in a time-lapse microscopy video. B) Fluorescence trajectories of all macrophages, which were coincubated with live CN, present in a time-lapse microscopy video. C) Fluorescence trajectories of all macrophages, which were coincubated with heat-killed CN, present in a time-lapse microscopy video after being convolved with a 7-frame blurring function. D) Fluorescence trajectories of all macrophages, which were coincubated with live CN, present in a time-lapse microscopy video after being convolved with a 7-frame blurring function. E) Macrophage #6 captured at regular intervals between Frames 1 and 100, which corresponds to the trajectory in the red box. F) Quantitative metrics that compare heat-killed trajectory data before and after the noise-filtering function is applied. G) Quantitative metrics that compare live trajectory data before and after the noise-filtering function is applied.
One observation that was particularly striking in the data was the consistency of the noise across cells. Many of the sharp peaks or valleys in the raw fluorescence data were seen in most cells with nonresidual levels of fluorescence and occur at the same time point. We considered convolving the raw data with a blurring function as a potential strategy for removing higher frequency noise in the data.17 For simplicity, we employed a moving rectangular pulse with a width of 7 units (Figure 4C and 4D). In effect, this convolution produces a 7-frame moving average, which removes the frame-to-frame fluctuations that are primarily caused by changes in microscope focus or alterations in Z-stack selections.18 To determine whether convolution affected the quantitative metrics used to screen for vomocytosis events, the fluorescence range and minimum derivative value were calculated for both the raw and convolved data.
Beginning with the heat-killed scenario, it is evident that the blurred trajectory in Figure 4C is less jagged compared to that in Figure 4A. The table in Figure 4F presents a numerical analysis that compares the raw and convolved trajectory in the blue boxes. We see that the fluorescence range in Frames 50–80 is −5185 px for the raw trajectory and −2753 px for the convolved trajectory, which gives a percent change of 46.9%. This is what we would expect, given that the convolution removed many of the sharp peaks and valleys and ultimately resulted in a flatter curve. Similarly, the minimum value of the derivative also drops from −827.5 to −269.6143 px/frame after convolution. This approach silences the incidence of sudden frame-to-frame variations in fluorescence, which is reflected in the lower magnitude of the derivative.
Comparing the two plots for live CNs (Figure 4D and 4B), we see that convolution results in a smoother curve. More importantly, blurring does not distort the overall shape of the curve. The convolved trajectory maintains both the steepness of the fluorescence drop(s) and the rough plateau in Frames 80–90. The table in Figure 4G presents a numerical analysis that compares the raw and convolved trajectory in the red boxes. The fluorescence range in Frames 70–100 is −24,920 px for the raw trajectory and −24,394 px for the convolved trajectory. Contrary to the heat-killed scenario, the fluorescence range before and after convolution does not vary significantly and comes out to approximately a 2.11% change. The minimum value of the derivative is −1661.3 px/frame before convolution and becomes −1693.2 px/frame after convolution, equaling a 1.92% change.
Based on these results, we conclude that the employment of a 7-frame blurring function effectively lowers the fluorescence range and (magnitude of) the minimum value of the derivative in nonvomocytic trajectories while maintaining the values of the parameters in vomocytic trajectories. This noise-filtering approach, as well as other advanced signal processing methods, may serve to exacerbate the quantitative differences between cells that are involved in vomocytosis and cells that have internalized CN but do not exhibit vomocytosis.
Applying Fluorescence vs Time Data to Verify Coincubation Protocol and Phagocytic Uptake
We quantitatively assessed the efficacy of the coincubation protocol, including the infection ratio of CN to immune cells, the extent of phagocytic uptake by immune cells, as well as other parameters. When trajectories for all cells in the video are graphed, 2 populations of cells emerge (Figure 5). Below the horizontal line (∼5000 px) is the average inherent fluorescence of phagocytes, meaning that these immune cells do not have any internalized CNs. This 5000 px benchmark became visually apparent when plotting trajectories of cells from several different experiments on the same graph.
Figure 5.

Line of demarcation separating macrophages with and without internalized CNs. A) This line at 5000 px offers quantitative insight into the success of the coincubation protocol used and can be used to adjust the CN:phagocyte ratio in future experiments. B) Macrophage #16, which has no internalized CNs, captured at regular intervals between Frames 1 and 100. C) Macrophage #36, which has internalized CNs, captured at regular intervals between Frames 1 and 100.
Contrarily, all trajectories above the horizontal line correspond to cells with internalized fungal pathogens. The ratio of the number of trajectories above the line of demarcation to the number below provides a way to numerically determine the extent of phagocytosis. Depending on the experimental design, a lower ratio can suggest that the coincubation procedure needs to be modified due to poor phagocytic uptake or that the experiment needs to be repeated. In the example given in Figure 5A, 7 trajectories are above the line of demarcation, and 30 fall below, indicating that roughly 18.9% (7 out of 37) of host cells were infected with at least one CN. This percentage is a metric of phagocytic uptake and is comparable to phagocytosis rates found in literature. Nelson et al. quantified the percent of cryptococcal uptake by various macrophage subsets and found that phagocytosis rates broadly range from ∼5–100%.19 For instance, the macrophage subtype CD14+CD1c– had a mean percent cryptococcal uptake of 40%.19 To corroborate the graphical data in Figure 5A, visual evidence of two macrophages, one with CN internalization and another without, are shown in Figure 5B and 5C along with their corresponding mean internal fluorescence values over the 100 frames of analysis. These two macrophages were chosen from the 63 that were visually analyzed. The mean internal fluorescence value of Macrophage #16 (no CN internalization) was 1820.24 px while the mean internal fluorescence value of Macrophage #36 (CN internalized) was 12,024.18 px.
Distinguishing between Event Categories
Trajectories from vomocytosis time-lapse videos fall into three generic categories: (1) vomocytosis event, (2) internalized CN with no vomocytosis events, and (3) no internalized CN. In Figure 6A, five trajectories that clearly represented each category were selected to be analyzed further. The blue lines represent cells with no internalized CN. Distinguishing characteristics of trajectories in this category are the near-zero value of fluorescence, lack of noise/fluctuations, and no sharp declines in fluorescence value. The green lines represent cells with internalized CN that did not perform a vomocytosis event. Distinguishing characteristics of trajectories in this category are the nonzero value of fluorescence, presence of noise/fluctuations, and no sharp declines in fluorescence value. Finally, the red line represents a cell with internalized CN that performed a vomocytosis event. Distinguishing characteristics of trajectories in this category are the nonzero value of fluorescence, presence of noise/fluctuations, and sharp decline in fluorescence value during the event. Each event category and its corresponding trajectory characteristics are summarized in Figure 6B. Snapshots of the cells analyzed in the plot are shown in Figure 6C.
Figure 6.

Characterization of the event categories. A) Fluorescence trajectories of 5 macrophages, categorized by event type (red = vomocytosis event, green = internalized CN with no events, blue = no CN internalization), across 100 frames. B) Trajectory characteristics (near-zero fluorescence value, presence of noise/fluctuations, and sharp decline in fluorescence) whose presence or absence define the 3 classifications of events. C) Corresponding 4 macrophages captured at regular intervals between Frames 1 and 100, each boxed in the color of the category within which it falls.
Contrasting Metrics across Event Categories
To fully validate whether the metrics acquired by our algorithm can be used to classify vomocytosis events, we manually evaluated 63 cells across ten different time-lapse microscopy videos from multiple experiments and appropriately placed each cell into one of the 3 event categories. Manual evaluation of time-lapse microscopy videos was performed until at least 10 vomocytosis events were recorded. The 5000 px filter in Figure 5A was applied to remove the “No CN Internalization” group before downstream analysis.
To discriminate between the “CN Stays Internalized” and “CN Vomocytosed” groups, several different metrics were assessed. Figure 7A depicts the minimum derivative value of the internal fluorescence. The “CN Vomocytosed” group possessed the most negative minimum derivative values, which were significantly different from those of cells where only phagocytosis was observed. A second metric for distinguishing vomocytosis through this algorithm is measuring the range of raw fluorescence values for each cell (maximum minus minimum). The bar graph on the right (Figure 7B) depicts this data. The “CN Stays Internalized” group has a lower range compared to the “CN Vomocytosed” group.
Figure 7.

Functional quantitation of vomocytosis using algorithm. A) Bar graph that compares the minimum derivative value of MΦs with CN that stay internalized for the duration of analysis and CN vomocytosed. (Comparison of two samples was performed using a nonparametric Mann–Whitney test.) B) Bar graph that compares the fluorescence range (maximum fluorescence value minus minimum fluorescence value) of MΦs with CN that stay internalized for the duration of analysis and CN vomocytosed. (Comparison of two samples was performed using a nonparametric Mann–Whitney test.) C) Bar graph that compares the local (± 5 frames) fluorescence range surrounding the point with the most negative (normalized) percent change of MΦs with CN that stay internalized for the duration of analysis and CN vomocytosed. (Comparison of two samples was performed using a nonparametric Mann–Whitney test.).
Ultimately, comparing the local (± 5 frames) fluorescence range surrounding the point with the most negative (normalized) percent change in fluorescence yielded the best separation between the two groups, as shown in Figure 7C. Calculating the local fluorescence range around the point with the most negative percent change for the “CN Stays Internalized” and “CN Vomocytosed” groups results in a false positive rate of 13.3% and a false negative rate of 18.2%.
Discussion
In this work, we propose a novel methodology for quantifying the occurrence of vomocytosis, or nonlytic exocytosis of CNs from innate immune cells, based on measuring the extent of colocalization between the fungal pathogen and the host cell. This method records pathogen fluorescence data within the boundaries of each host cell across time and offers a way to discriminate between the different trajectory types based on fluctuations in internal fluorescence. Considering that the desired application of the algorithm was to screen many videos quickly, reducing the computational burden was paramount to minimizing the runtime for each video. Eliminating the need to precisely track each pathogen by using fluorescence as an indicator of pathogen presence significantly lowered the algorithm’s complexity.
The first step in our algorithm’s workflow is threshold-based segmentation. In order to compensate for variability in microscopy recording conditions and innate levels of fluorescence in the images, adaptive thresholding is vital to ensure consistency in the data the algorithm processes.20 Currently, our algorithm does not have a set procedure to determine optimal thresholding and leaves it up to the user to manipulate the threshold level used for cell segmentation. In the future, the algorithm can be improved and made more versatile with the addition of automated and optimized thresholding. Automated cell segmentation has been implemented in algorithms that identify objects with areas that vary widely in time.20 In these instances, the assumption that the total ROI area remains constant over time is invalid. An example of such an application is segmenting calcium-imaging data sets of neurons that change in brightness on a frame-to-frame time scale.20 An automated approach eliminated the high level of tuning that was previously required for each individual data set and was even able to detect low-intensity neurons that were initially undetected by human eyes.20 Considering the global pixel intensities of each image before separating static background from relevant data provides a way to remove frame-to-frame and video-to-video variance and consequently increase the precision of segmentation.
Initially, the algorithm was trained on bright-field microscopy images with the rationale of presenting a more difficult environment to uncover and identify any areas of ambiguity. Since the purpose of this research is more focused on elucidating fungal behavior (vomocytosis) rather than on the optimization of image detection and tracking, we chose to utilize simple yet effective methodologies. Threshold-based segmentation provided sufficient resolution on the image frames for the algorithm to delineate the host immune cell boundaries. By binarizing only the fluorescent channel images corresponding to the immune cell, our algorithm isolates host cell boundaries and can apply those boundaries in relation to the location of the pixels in the fluorescent channel corresponding to the fungal pathogens. Separately investigating the two channels at the same time point (immune cell and pathogen) allows for the ease of segmenting cell boundaries. Algorithms that solely rely on bright-field time-lapse microscopy videos often segment both the host cell as well as the particulate or pathogen and differentiate them based on size or shape, which adds an additional layer of complexity. Dual segmentation of both the host and pathogen has been used to study interactions of macrophages and Conidia.15 Mech et al. developed an algorithm that discriminates immune cells from Conidia based on their clearly distinct areas, computed to be 3800 ± 1400 px and 180 ± 30 px, respectively.15 The threshold area was set to be 450 px.15 All objects with areas larger than 450 px were classified as macrophages, and all objects with areas below the threshold were considered to be Conidia.15 Unlike the methodology used for the quantification of phagocytosis events, vomocytosis quantification requires tracking the current internalization state of the pathogen within the immune cells and utilization of that data to evaluate the occurrence of an expulsion event. Simply applying threshold-based segmentation to bright-field time-lapse microscopy images would not be possible due to the high spatial resolution needed to quantify the internalized fungi.
In addition to threshold-based segmentation, nearest-neighbor tracking (NNT) is highly accurate in low cell density and low cell motion use cases.16 The frequency of frame capture is chosen by the researcher and is limited only by the storage capacity of the computer, as well as potential software restrictions. With each frame of recordings in our experiments taken 4 min apart, the cells do not migrate far enough during that time, making NNT applicable. Furthermore, the viewing window can be selected on the well plate to focus on areas with fewer cells, providing a means of limiting the cell density. We have found that the algorithm performs best in scenarios with 50–75 cells and becomes less reliable as the number of cells per frame increases past 100. Through this methodology, our algorithm effectively delineates and tracks cells through multiple frames. However, one of the unresolved challenges with NNT is the computational burden of the approach. To analyze one time-lapse microscopy video on the order of 215 image frames, the algorithm takes roughly 10 min, depending largely on the cell density in each frame. The nearest-neighbor algorithm is computationally very expensive. If there are, on average, N cells in each frame, the number of comparisons that the computer must perform is NN. For an entire video, the number of comparisons is amplified by the number of frames. If we assume a cell density of 30 cells per frame and a video with a length of 215 frames, we get a staggering 4.43 × 1046 iterations. This number can be decreased by several orders of magnitude by including a parameter called maximum displacement (mD) to constrain the distance that a cell can move in one frame.16 The algorithm will search for comparison targets only within a region with a radius of mD instead of the whole frame altogether. This approach has been used in particle tracking studies to “discard unlikely bonds and reduce computation time.”16 However, it was noted that careful adjustment and calibration of this parameter is necessary based upon particle speed and density.
Though we chose a nearest-neighbor tracking approach, there are more advanced cell tracking algorithms that would allow the algorithm to function without as many limitations. A more complex example of such an algorithm is a network-based approach, where information on the spatiotemporal relationships of cells is stored graphically.21 Mathematical models (partial differential equations) can also be used to predict cell movement via a watershed transform.21 Choosing between the various tracking methods boils down to a trade-off between complexity, efficiency, and performance.
The current algorithm is limited to the analysis of fluorescent microscopy videos because it relies on two separate fluorescent channels to distinguish between host immune cells and fungal pathogens. As a result, the fluorescence of the fungal pathogens serves as a key marker or indicator for vomocytosis. Ultimately, an algorithm that can take in brightfield (black/white or grayscale) videos would decrease the time it takes to stain each cell type before coincubation. However, this would require additional evaluative strategies to discern differences between immune cells and pathogens in the same frame as well as a complex boundary analysis to determine expulsions. By applying fluorescence markers and using multiple color channels to analyze the expulsion events, we managed to greatly simplify the algorithm and optimize the processing and segmenting operations in the analysis of fluorescently stained cells and pathogens.
However, choosing suitable fluorescent dyes is imperative for the optimal functioning of the algorithm. We found that lipophilic dyes that stained the cell membrane did not provide enough clarity in the time-lapse microscopy images, especially when working with irregularly shaped immune cells due to their spine-like projections. The data that support this are not included in the manuscript but are available from the corresponding author upon request. We opted for cytoplasmic staining (carboxyfluorescein succinimidyl ester, CFSE), which significantly intensified fluorescence signals and allowed for a clearer cellular view. The enhanced definition provided by the CFSE greatly improved our algorithm’s detection of cell boundaries. Although the different stains improved the quality of visual definition, it is still important to regulate the exposure time during imaging due to photobleaching, which negatively affects the ability of our algorithm to threshold and segment cells accurately.22
Other parameters also need to be calibrated when performing the fluorescence microscopy experiment, such as the illumination power. An extremely high illumination power causes photobleaching, which renders a large portion of the microscopy unusable. However, a low illumination power provides low-quality images and a low signal-to-noise ratio that makes most image frames tough to analyze precisely. Another parameter is the cell density. Choosing a well location where the spacing between cells is apparent and the total number of cells in the frame is not exorbitant again makes the algorithm more efficient. Balancing these parameters provides the rationale for our experimental design of a lower cell density and lower exposure.
Even when parameters are balanced though, fluorescence microscopy can be especially susceptible to nonhomogenous staining due to differences in metabolism between internalized CNs, differences in cells’ Z coordinates, and number of pathogens internalized. These serve as possible explanations for the observation that Macrophage #6 in Figure 4E has a heightened fluorescence value.
Finally, our pixel-based analysis approach has the potential to be applied to other dynamic cellular processes, such as with intracellular nucleic acids and protein expression. This approach offers a quantitative way to digest microscopy images that can be used to corroborate data from RNA-seq, Western blot, or flow cytometry. Pixel-based counting also brings the additional advantage of temporal data or how fluorescence changes with time. An example of data that could be gathered via application of our algorithm includes subcellular localization, especially whether proteins are entering the phagosome, nucleus, or mitochondria, and how the location of these molecules change over time.23 We also foresee the algorithm providing deeper insight into other processes where cellular boundaries are breached or modified such as exocytosis, trogocytosis, and extracellular vesicle formation.
Conclusion
In summary, this study documents the development of a MATLAB algorithm that screens cellular time-lapse microscopy videos in a high throughput manner. The algorithm measures the extent of fungal pathogen colocalization in each host immune cell across time with the rationale that large negative rates of change in a host cell’s internal fluorescence indicate that a CN is leaving the boundaries of the host immune cell. Using an automated algorithm to intake image data and quantify vomocytosis events consistently reproduced the results of a more time-consuming manual quantification process of the same time-lapse microscopy images. In utilizing an algorithmic approach to process multichannel time-lapse microscopy imaging, accurate, higher throughput, and less human error-prone quantification can occur, acting as an effective methodology for analyzing vomocytosis events. In future investigations, we aim to further validate the algorithm by using it to measure vomocytosis rates in different conditions, such as varied infection rates and drug treatments and cell types. We believe that this tool, by facilitating the study of vomocytosis, could lead to breakthroughs in finding a cure for cryptococcal meningitis and has broad influence on other fields as well. To this end, we hope to apply the algorithm to the quantification of other expulsion processes, including those involving drug-loaded fluorescent particles.
Acknowledgments
We are grateful to the Gelli Lab at UC Davis for providing the CN strains used in this study. Additionally, we thank the George Lab at UC Davis for graciously allowing us to use their confocal equipment and aiding in performing confocal imaging. We acknowledge support from the following sources: NIH grant R01AI139399 (J.S.L.), NIH grant R35GM125012 (J.S.L.), NIGMS-funded Pharmacology Training Program grant T32GM099608 (N.P.), and NSF GRFP grant 1650042 (N.P.).
Supporting Information Available
The Supporting Information is available free of charge at https://pubs.acs.org/doi/10.1021/cbmi.3c00102.
The authors declare no competing financial interest.
Supplementary Material
References
- Uribe-Querol E.; Rosales C. Phagocytosis: Our Current Understanding of a Universal Biological Process. Front. Immunol. 2020, 11, 1066. 10.3389/fimmu.2020.01066. [DOI] [PMC free article] [PubMed] [Google Scholar]
- Antony P. P. M. A.; Trefois C.; Stojanovic A.; Baumuratov A. S.; Kozak K. Light microscopy applications in systems biology: opportunities and challenges. Cell Commun. Signal. 2013, 11 (24), 24. 10.1186/1478-811X-11-24. [DOI] [PMC free article] [PubMed] [Google Scholar]
- Al-Ali H.; Gao H.; Dalby-Hansen C.; Peters V. A.; Shi Y.; Brambilla R. High content analysis of phagocytic activity and cell morphology with PuntoMorph. J. Neurosci. Methods 2017, 291, 43–50. 10.1016/j.jneumeth.2017.08.004. [DOI] [PMC free article] [PubMed] [Google Scholar]
- Brandes S.; Dietrich S.; Hünniger K.; Kurzai O.; Figge M. T. Migration and interaction tracking for quantitative analysis of phagocyte–pathogen confrontation assays. Med. Image Anal. 2017, 36, 172–183. 10.1016/j.media.2016.11.007. [DOI] [PubMed] [Google Scholar]
- Cruz-Acuña M.; Pacifici N.; Lewis J. S. Vomocytosis: Too Much Booze, Base, or Calcium?. mBio 2019, 10 (6), e02526. 10.1128/mBio.02526-19. [DOI] [PMC free article] [PubMed] [Google Scholar]
- Sharma N. K.; Sarode S. C.; Sarode G. S.; Patil S. Vomocytosis by macrophages: a crucial event in the local niche of tumors. Future Oncol. 2019, 15 (14), 1545–1550. 10.2217/fon-2019-0078. [DOI] [PubMed] [Google Scholar]
- Yang X.; Wang H.; Hu F.; Chen X.; Zhang M. Nonlytic exocytosis of Cryptococcus neoformans from neutrophils in the brain vasculature. Cell Commun. Signal. 2019, 17 (1), 117. 10.1186/s12964-019-0429-0. [DOI] [PMC free article] [PubMed] [Google Scholar]
- Pacifici N.; Cruz-Acuña M.; Diener A.; Tu A.; Senthil N.; Han H.; Lewis J. S. Vomocytosis of Cryptococcus Neoformans Cells from Murine, Bone Marrow-Derived Dendritic Cells. PLoS One 2023, 18 (3), e0280692 10.1371/journal.pone.0280692. [DOI] [PMC free article] [PubMed] [Google Scholar]
- Santiago-Tirado F. H.; Onken M. D.; Cooper J. A.; Klein R. S.; Doering T. L. Trojan Horse Transit Contributes to Blood-Brain Barrier Crossing of a Eukaryotic Pathogen. mBio 2017, 8 (1), e02183. 10.1128/mBio.02183-16. [DOI] [PMC free article] [PubMed] [Google Scholar]
- Bojarczuk A.; Miller K. A.; Hotham R.; Lewis A.; Ogryzko N. V.; Kamuyango A. A.; Frost H.; Gibson R. H.; Stillman E.; May R. C.; Renshaw S. A.; Johnston S. A. Cryptococcus neoformans Intracellular Proliferation and Capsule Size Determines Early Macrophage Control of Infection. Sci. Rep. 2016, 6 (1), 21489. 10.1038/srep21489. [DOI] [PMC free article] [PubMed] [Google Scholar]
- Kraibooj K.; Schoeler H.; Svensson C.-M.; Brakhage A. A.; Figge M. T. Automated quantification of the phagocytosis of Aspergillus fumigatus conidia by a novel image analysis algorithm. Front. Microbiol. 2015, 6, 549. 10.3389/fmicb.2015.00549. [DOI] [PMC free article] [PubMed] [Google Scholar]
- Pacifici N.; Rojalin T.; Carney R. P.; Lewis J. S. A Multi-Fluorophore Staining Scheme for Identification and Quantification of Vomocytosis. Chem. Biomed. Imaging 2023, 10.1021/cbmi.3c00050. [DOI] [PMC free article] [PubMed] [Google Scholar]
- Al-Zaben N.; Medyukhina A.; Dietrich S.; Marolda A.; Hünniger K.; Kurzai O.; Figge M. T. Automated tracking of label-free cells with enhanced recognition of whole tracks. Sci. Rep. 2019, 9 (1), 3317. 10.1038/s41598-019-39725-x. [DOI] [PMC free article] [PubMed] [Google Scholar]
- Sangsuwan R.; Thuamsang B.; Pacifici N.; Allen R.; Han H.; Miakicheva S.; Lewis J. S. Lactate Exposure Promotes Immunosuppressive Phenotypes in Innate Immune Cells. Cell. Mol. Bioeng. 2020, 13 (5), 541–557. 10.1007/s12195-020-00652-x. [DOI] [PMC free article] [PubMed] [Google Scholar]
- Mech F.; Thywißen A.; Guthke R.; Brakhage A. A.; Figge M. T. Automated Image Analysis of the Host-Pathogen Interaction between Phagocytes and Aspergillus fumigatus. PLoS One 2011, 6 (5), e19591 10.1371/journal.pone.0019591. [DOI] [PMC free article] [PubMed] [Google Scholar]
- Mazzaferri J.; Roy J.; Lefrancois S.; Costantino S. Adaptive settings for the nearest-neighbor particle tracking algorithm. Bioinformatics 2015, 31 (8), 1279–1285. 10.1093/bioinformatics/btu793. [DOI] [PubMed] [Google Scholar]
- Fuentes-Aguilar R. Q.; Garcia-Gonzalez A.. Chapter 19: Evaluation of mechanical variables by registration and analysis of electromyographic activity. In Biosignal Processing and Classification Using Computational Learning and Intelligence. Torres-García A. A.; Reyes-García C. A.; Villaseñor-Pineda L.; Mendoza-Montoya O., Eds., Academic Press, 2022; pp 407–427. 10.1016/B978-0-12-820125-1.00032-4. [DOI] [Google Scholar]
- Ranney K. I.; Tom K.; Tadas D.; Tesny N.; Magill A.; Diehl W. Magnitude-based pulse width estimation via efficient edge detection. J. Appl. Remote Sens. 2022, 16 (1), 016509 10.1117/1.JRS.16.016509. [DOI] [Google Scholar]
- Nelson B. N.; Daugherty C. S.; Sharp R. R.; Booth J. L.; Patel V. I.; Metcalf J. P.; Jones K. L.; Wozniak K. L. Protective interaction of human phagocytic APC subsets with Cryptococcus neoformans induces genes associated with metabolism and antigen presentation. Front. Immunol. 2022, 13, 1054477. 10.3389/fimmu.2022.1054477. [DOI] [PMC free article] [PubMed] [Google Scholar]
- Shen S. P.; Tseng H. A.; Hansen K. R.; Wu R.; Gritton H. J.; Si J.; Han X. Automatic Cell Segmentation by Adaptive Thresholding (ACSAT) for Large-Scale Calcium Imaging Datasets. eneuro 2018, 5 (5), ENEURO.0056-18.2018. 10.1523/ENEURO.0056-18.2018. [DOI] [PMC free article] [PubMed] [Google Scholar]
- Emami N.; Sedaei Z.; Ferdousi R. Computerized cell tracking: Current methods, tools and challenges. Vis. Inform. 2021, 5 (1), 1–13. 10.1016/j.visinf.2020.11.003. [DOI] [Google Scholar]
- Sasaki A. Recent advances in the standardization of fluorescence microscopy for quantitative image analysis. Biophys. Rev. 2022, 14 (1), 33–39. 10.1007/s12551-021-00871-0. [DOI] [PMC free article] [PubMed] [Google Scholar]
- Zhu L.; Liu Q.; Yang B.; Ju H.; Lei J. Pixel Counting of Fluorescence Spots Triggered by DNA Walkers for Ultrasensitive Quantification of Nucleic Acid. Anal. Chem. 2018, 90 (11), 6357–6361. 10.1021/acs.analchem.8b01146. [DOI] [PubMed] [Google Scholar]
Associated Data
This section collects any data citations, data availability statements, or supplementary materials included in this article.