Abstract
The canonical model of striatal function predicts that animal locomotion is associated with opposing regulation of protein kinase A (PKA) by dopamine in direct and indirect pathway striatal projection neurons (dSPNs and iSPNs, respectively). However, the precise PKA dynamics in dorsolateral SPNs during locomotion remain to be determined. It is also unclear whether other neuromodulators may be involved. Here, we show that PKA activity in both SPN types was essential for normal locomotion. We then measured PKA activity within individual SPNs of the mouse dorsolateral striatum during locomotion by performing two-photon fluorescence lifetime imaging of a PKA sensor via gradient index lenses. Consistent with the canonical view, dopamine activated PKA activity in dSPNs during locomotion via the D1 receptor. However, iSPNs exhibited an unexpected, larger increase in PKA activity, which was largely abolished by blocking A2A adenosine receptors. Consistently, fiber photometric measurements of an adenosine sensor revealed an acute rise of extracellular adenosine during locomotion. Functionally, antagonism of dopamine or adenosine receptors resulted in distinct changes in SPN PKA activity, neuronal activity, and locomotion. Together, our results reveal that acute adenosine accumulation interplays with dopamine release to orchestrate PKA activity in SPNs and proper striatal function during animal locomotion.
The dorsolateral striatum plays a critical role in animal locomotion1–4. Approximately 95% of striatal neurons are spiny projection neurons (SPNs), which are further divided into direct and indirect pathway SPNs (dSPNs and iSPNs, respectively) based on their projections3–7. The balance between dSPN and iSPN activity is critical for motor execution8,9, and an imbalance in dSPN and iSPN function is associated with movement disorders10,11.
Striatal control of locomotion is regulated by neuromodulators, among which dopamine (DA) regulation has been extensively studied3,4,7,12,13. In the current model, dopamine release during locomotion4,14 increases the intracellular cAMP concentration and, in turn, increases the activity of protein kinase A (PKA) in dSPNs via Gs-coupled type-1 dopamine receptors (D1Rs)3,6,7,12. Concurrently, dopamine inhibits PKA in iSPNs via Gi/o-coupled type-2 dopamine receptors (D2Rs). PKA tilts the balance between dSPNs and iSPNs by regulating neuronal excitability and plasticity7,15–18. However, how dopamine release translates into SPN PKA activity in vivo during locomotive behavior has not been examined directly. The functional importance of PKA activity in animal locomotion also remains to be determined.
The role of other neuromodulators13 – many of which also signal through PKA – during locomotion is less understood. For example, the Gs-coupled A2A adenosine receptor (A2AR) is selectively expressed in iSPNs3,19–21. In vitro studies suggest that the activation of A2A receptors increases PKA activity, excitatory synaptic transmission, neuronal excitability, and long-term potentiation in iSPNs18,22,23. In addition, the Gi-coupled A1 adenosine receptors are expressed in dSPNs and at the presynaptic termini of many inputs20. Antagonism and knockout of adenosine receptors alter animal locomotive behavior either positively or negatively, depending on the specific condition24–27. The psychomotor stimulant caffeine also largely works as a non-selective adenosine receptor antagonist, with its locomotive effect ascribed to the striatum20,28. However, whether adenosine is released during locomotion and how it interacts with dopamine to modulate intracellular PKA during behavior remain unknown13,20,29.
Here, we imaged the PKA activity sensor tAKARα30 with single-cell resolution in the dorsolateral striatum during behavior using two-photon fluorescence lifetime imaging microscopy (2pFLIM)30–32 via a gradient-index (GRIN) lens. Together with optogenetics, behavioral pharmacology, and fiber photometry, we found a previously unobserved neuromodulatory regulation of PKA signaling events in iSPNs during animal locomotion elicited by acute adenosine accumulation.
In vivo PKA imaging in individual SPNs
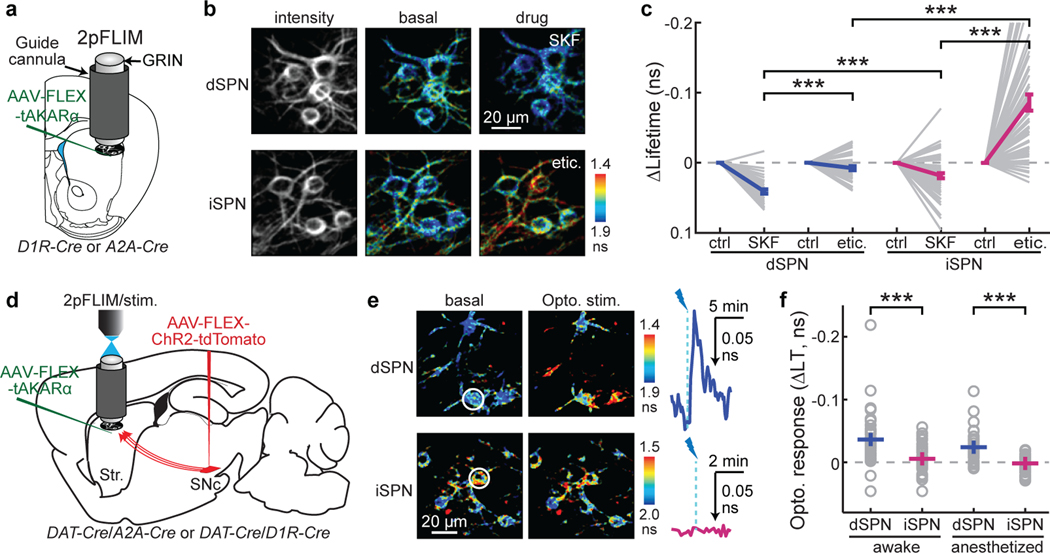
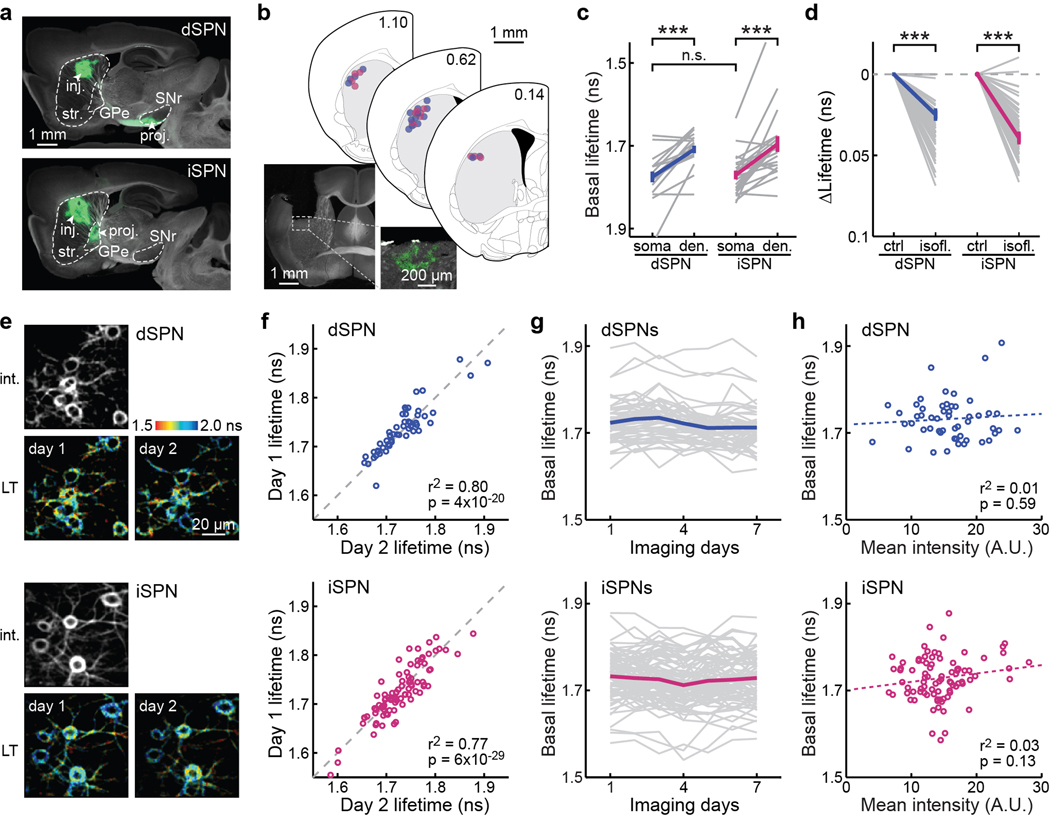
Despite recent progress33–36, it remains challenging to visualize PKA activity with cellular resolution in deep brain structures of behaving animals. To do so in individual dSPNs or iSPNs, we stereotaxically injected an adeno-associated virus (AAV) in the dorsolateral striatum of Drd1a-cre (MMRRC#036196) or Adora2a-cre (MMRRC#036158) mice, respectively, to express tAKARα in a Cre-dependent manner (Fig. 1a; see also Extended Data Fig. 1a). 2pFLIM imaging of tAKARα was carried out in head-fixed, awake mice via a GRIN lens positioned in an implanted cannula (Fig. 1a and Extended Data Fig. 1b). Individual neurons and their proximal dendrites could be resolved (Fig. 1b). Notably, both dSPN and iSPN dendrites exhibited shorter lifetimes, corresponding to higher PKA activities, compared to their respective somata under basal conditions (Extended Data Fig. 1c). Nevertheless, the remaining study focused on neuronal somata because of their greater brightness and thereby higher signal-to-noise ratios. There appeared to be a tonic level of PKA activity in both SPN types under the basal condition because it could be lowered by isoflurane anesthesia (Extended Data Fig. 1d). In addition, different SPNs of the same type exhibited heterogeneous basal lifetimes that were stable across days and were not dependent on the sensor expression level (Extended Data Fig. 1e–1h), suggesting a cell-specific basal set point of PKA activity. Overall, these results establish in vivo PKA imaging in the dorsolateral striatum and reveal tonic PKA activity in SPNs under basal conditions.
Fig. 1. In vivo PKA activity imaging reveals cell type-specific modulation of PKA by dopamine.
a, Schematic 2pFLIM imaging of in vivo PKA activity in the striatum via a GRIN lens. b & c, Representative images (b) and quantification (c) of basal PKA activity in dSPN or iSPN somata and its response to SKF83566 (SKF, D1R antagonist) and eticlopride (etic., D2R antagonist). n (neurons/mice) = 38/6 for dSPNs and 63/8 for iSPNs. Within the same SPN type, two-tailed paired Student’s t-test with Bonferroni correction, from left to right, p = 4.5×10⁻⁸ and 4.1×10⁻¹³; dF = 37 and 62; t = 7.3 and 9.5. For the same drug across SPN types, two-tailed unpaired Student’s t-test with Bonferroni correction, from left to right, p = 1.9×10⁻⁴ and 5.3×10⁻⁸; dF = 99 and 99; t = 4.3 and 6.2. All lifetime data are plotted on inverted y-axes. d, Schematic of the experiment in panel e and f. Channelrhodopsin ChR2 was expressed in SNc dopaminergic neurons. Their projection axons in the striatum (Str.) were photostimulated through the GRIN lens during PKA imaging. Stim.: photo stimulation. e & f, Representative images and their corresponding traces in awake mice (e), and collective peak responses in both awake and anesthetized mice (f) of PKA activity in dSPNs and iSPNs elicited by optogenetic dopamine release. From left to right, Δlifetime (ns) = −0.036 ± 0.006, −0.005 ± 0.004, −0.024 ± 0.004, and 0.002 ± 0.003; n (neurons/mice) = 41/5, 36/4, 35/4, and 32/4. Two-tailed unpaired Student’s t-test, from left to right, p = 1.5×10⁻⁴ and 2.6×10⁻⁶; dF = 75 and 65; t = −4.0 and −5.2. All error bars represent SEM and their centers represent the mean. ***: p ≤ 0.001.
SPN-specific regulation of PKA by DA
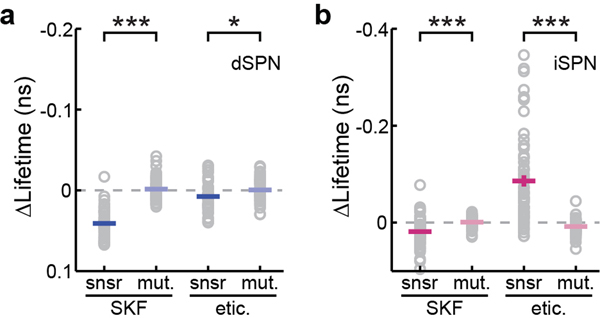
We next asked how PKA activities in SPNs were modulated by dopamine. Midbrain dopaminergic neurons spontaneously fire at low frequencies, likely resulting in a tonic level of dopamine37. To investigate the effect of tonic dopamine, we used systemic (intraperitoneal) injections to administer dopamine receptor antagonists. The PKA activity in dSPNs was decreased by administration of the D1R antagonist SKF83566 (0.2 mg/kg), as reflected by increased tAKARα lifetimes (Δlifetime = 0.041 ± 0.003 ns; p < 0.001 cf. control; Fig. 1c; note that all lifetime data are plotted on inverted y-axes). In contrast, SKF83566 administration resulted in a much smaller effect in iSPNs (Δlifetime = 0.018 ± 0.004 ns; p < 0.001 cf. dSPNs; Fig. 1c). The D2R antagonist eticlopride (0.1 mg/kg) minimally affected dSPNs (Δlifetime = 0.008 ± 0.003 ns; p < 0.001 cf. SKF83566; Fig. 1c), but greatly increased basal PKA activity in iSPNs (Δlifetime = −0.086 ± 0.012 ns; p < 0.001 cf. both eticlopride in dSPNs and SKF83566 in iSPNs; Fig. 1c). As a control, a phosphorylation-deficient mutant sensor (T391A30) did not detect any changes (Extended Data Fig. 2). These results indicate that tonic dopamine increases PKA activity in dSPNs while suppressing PKA in iSPNs. Interestingly, despite such opposing regulation by tonic dopamine, the average basal PKA activities in dSPNs and iSPNs were nearly identical (Extended Data Fig. 1c), suggestive of potential homeostatic regulation towards a desired set point at the population level.
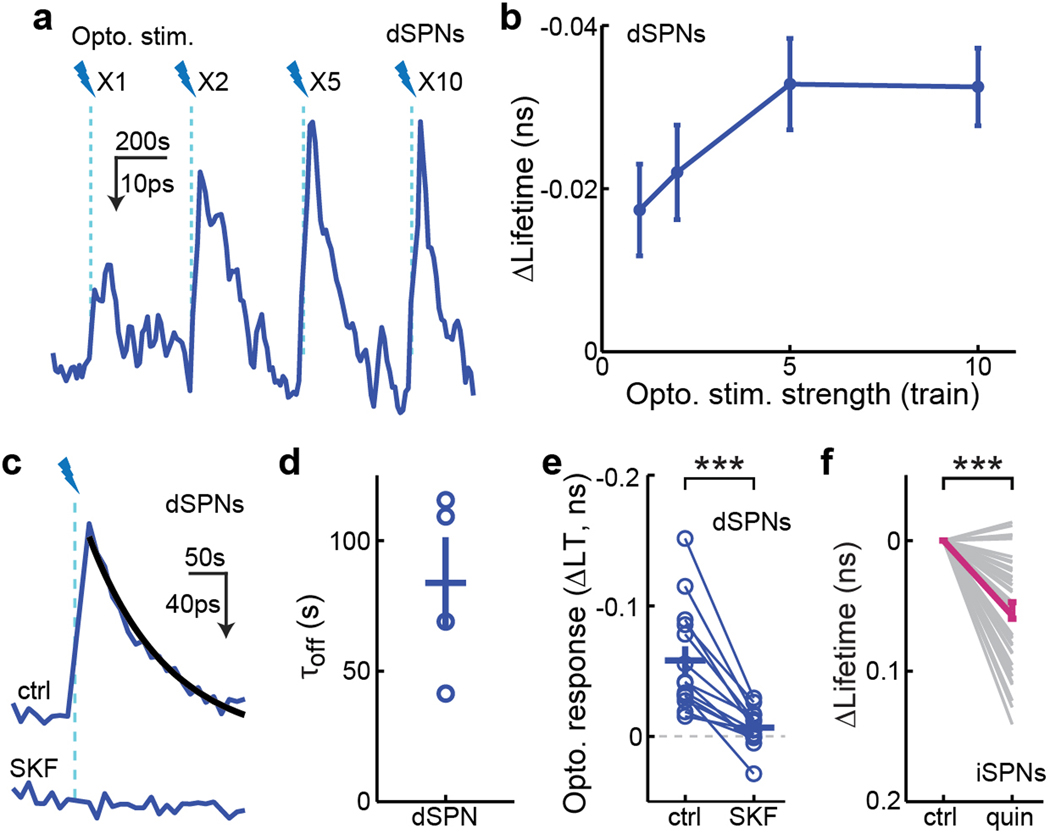
In addition to their tonic activity, dopaminergic neurons projecting to the dorsal striatum can also fire in phasic bursts, such as during locomotion14,37,38. To examine the effect of phasic dopamine release, we virally expressed tAKARα in dSPNs or iSPNs, and ChR2 in dopaminergic neurons of the substantia nigra pars compacta (Fig. 1d). One to ten trains (1 train/s) of 20 Hz blue light (15.5 mW, 470 nm, 10 × 1.5-ms pulses) were delivered via the imaging GRIN lens8,39. This optogenetic stimulation of dopaminergic axons in awake mice resulted in a robust, dose-dependent increase in PKA activity in dSPNs with a decay time constant of 84 ± 17 s (Fig. 1e and 1f, and Extended Data Fig. 3a–3d). This increased PKA activity in dSPNs was sustained in anesthetized mice (Fig. 1f) and was blocked by the D1R antagonist SKF83566 (Extended Data Fig. 3c and 3e), confirming that it was mediated by direct dopamine release. Surprisingly, optogenetic dopamine release in both awake and anesthetized mice did not decrease PKA activity in iSPNs (Fig. 1e and 1f). In contrast, systemic administration of the D2R agonist quinpirole (1 mg/kg) resulted in decreased PKA activity (Extended Data Fig. 3f). A possible explanation would be that optogenetically-released dopamine is only accessible to a subset of D2 receptors that have been fully activated by tonic dopamine release in iSPNs (see Discussion). Together, these observations provide in vivo evidence that PKA activities in dSPNs and iSPNs are differentially regulated by tonic and phasic releases of dopamine in the dorsolateral striatum.
Locomotion activates PKA in both SPNs
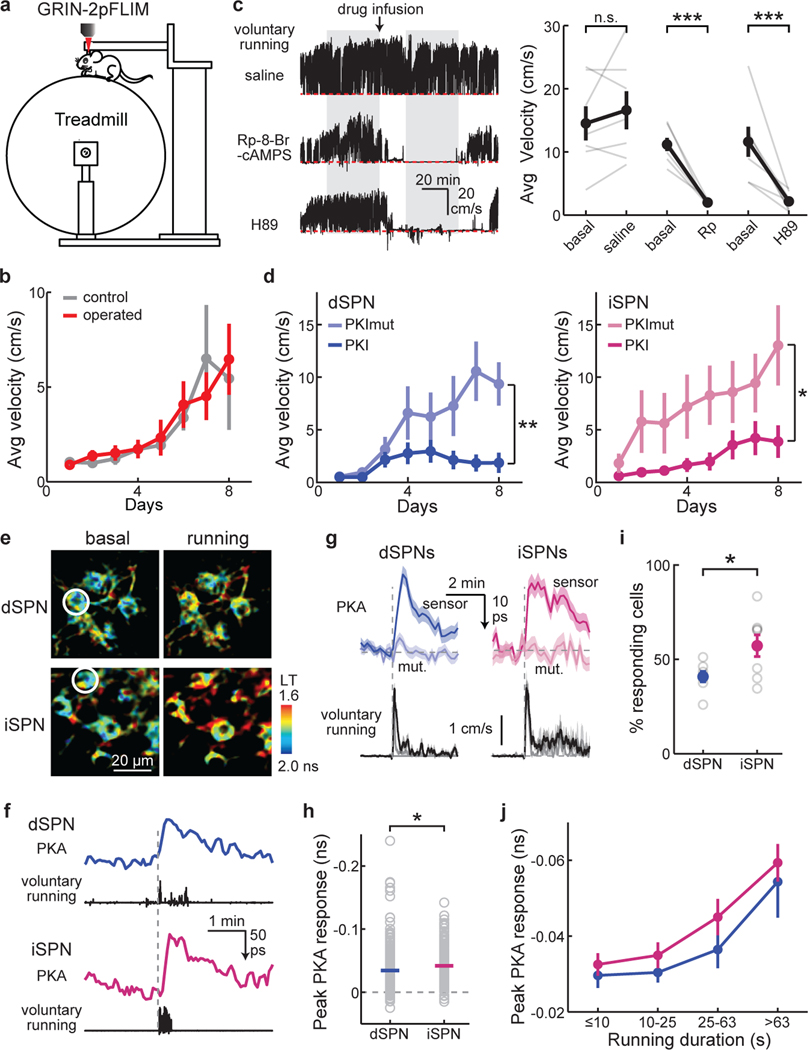
Animal locomotion is accompanied by phasic release of dopamine in the dorsal striatum14,40, which is thought to tilt the functional balance between dSPNs and iSPNs by increasing PKA activity in dSPNs and reducing PKA activity in iSPNs. However, the results from optogenetic stimulation (Fig. 1e and 1f) suggested that phasic dopamine would not decrease PKA activity in iSPNs in vivo. We therefore examined directly the relationship between locomotion and PKA activity in SPNs using a treadmill locomotion paradigm (Fig. 2a). Notably, implantation of the GRIN lens did not affect mouse treadmill running under our conditions (Fig. 2b).
Fig. 2. Locomotion requires PKA activity and increases PKA activity in both dSPNs and iSPNs.
a, Schematic of the head-fixed locomotion experimental paradigm on a treadmill during 2pFLIM imaging. b, Wildtype mice with and without GRIN lens implantation exhibited comparable running adaptation across days. n (mice) = 8 for operated, and 10 for control. c, Representative running-speed traces (left) and the collective quantification (right) of wildtype mice voluntarily running on the treadmill with the indicated local drug infusion. The measurement window (gray zones), time of drug application (arrow), and zero velocity (red dashed lines) are indicated. Rp: Rp-8-Br-cAMPS. n (mice) = 7, 7, 7 from left to right. Two-tailed paired Student’s t-test on data normalized to the baseline, from left to right, p = 0.20, 3.1×10⁻⁷, 1.8×10⁻⁵; dF = 6, 6, 6; t = −1.4, 24.4, 12.3. d, Animal velocity on the treadmill across 8 days with PKI or its mutant (PKImut) expressed in dSPNs or iSPNs. n (mice) = 8 for both groups of dSPNs, 10 for PKImut in iSPNs, and 13 for PKI in iSPNs. Two-tailed unpaired Student’s t-test on day 8 for dSPNs and iSPNs, respectively, p = 0.0052 and 0.024; dF = 14 and 21; t = −3.3 and −2.4. e & f, Representative images (e) and example response traces (f) of voluntary running-elicited PKA activity responses in dSPNs and iSPNs. g, Averaged voluntary running-induced responses (top) from tAKARα (sensor) or its mutant (mut.) and corresponding running traces (bottom) aligned at movement onset from dSPNs and iSPNs. h, Collective peak amplitudes of voluntary running-elicited PKA responses. Δlifetime (ns) = −0.034 ± 0.002 for dSPNs and −0.042 ± 0.002 for iSPNs. Two-tailed Student’s t-test, p = 0.016; dF = 431; t = −2.4. For panels e–h , n (neuronal bouts/bouts/mice) = 247/46/9, 192/29/4, 186/38/7, and 70/10/4 for dSPNs, dSPN mutant sensor, iSPNs, and iSPN mutant sensor, respectively. i, Fraction of dSPNs and iSPNs that exhibited above-threshold (3x S.D. of baseline) PKA response to voluntary running. n (mice) = 7 and 8 for dSPNs and iSPNs, respectively. Two-tailed Student’s t-test, p = 0.03; dF = 13; t = −2.4. j, The dependence of PKA responses on locomotion duration, in dSPNs (blue) and iSPNs (magenta). For the curve from left to right, n (neuronal bouts) = 54, 109, 55, 29 for dSPNs from 9 mice, and 44, 60, 43, 39 for iSPNs from 7 mice. All error bars and error bands represent SEM and their centers represent the mean. n.s.: p > 0.05; *: p ≤ 0.05; **: p ≤ 0.01; ***: p ≤ 0.001.
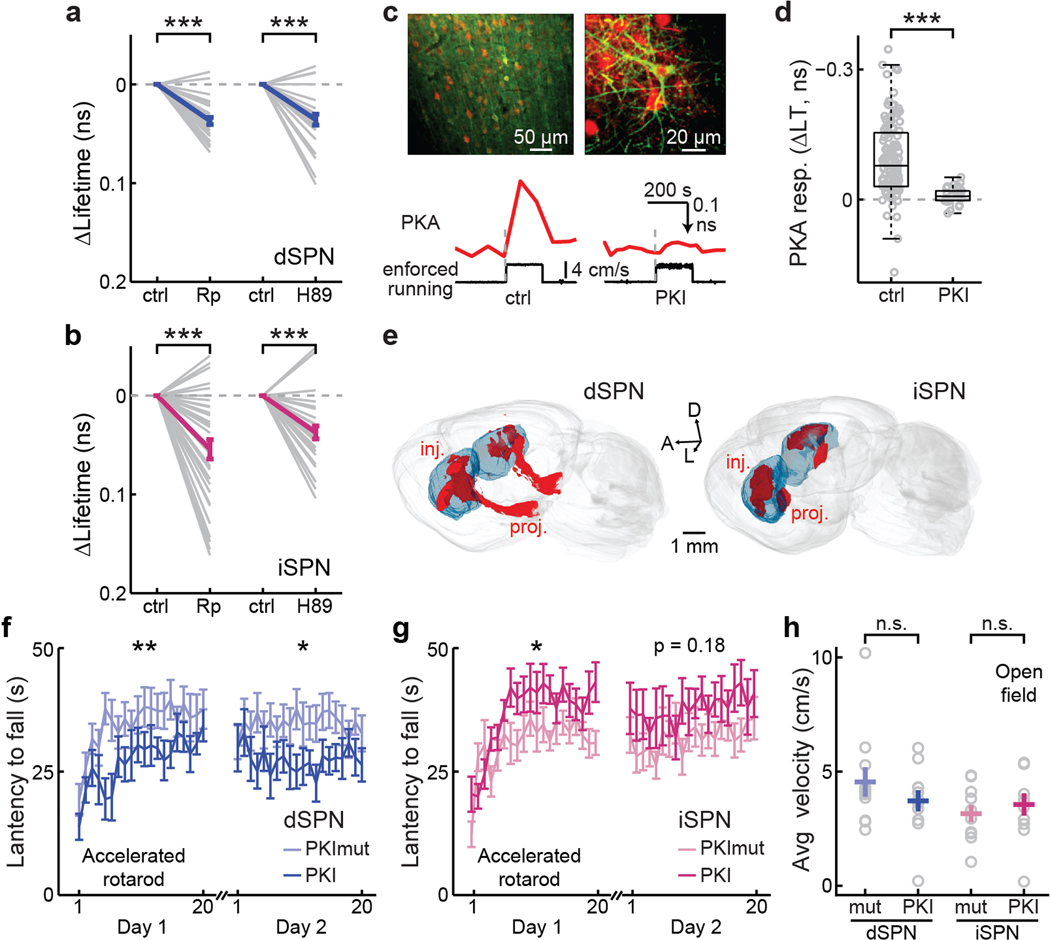
We first tested whether animal locomotion is affected by the manipulation of PKA activity. Two antagonists that disrupt PKA activity via different mechanisms (Extended Data Fig. 4a and 4b), Rp-8-Br-cAMPS and H89 (for both, 4 µg/µL x 1 µL), were individually and locally infused into the dorsolateral striatum of wildtype mice that had been fully habituated on the treadmill. Either antagonists, but not saline, reduced locomotion by >80% (Fig. 2c). To test the functional significance of PKA activity in specific neuronal types, we expressed protein kinase inhibitor (PKI; a PKA inhibiting protein) selectively in dSPNs or iSPNs by injecting a Cre-dependent PKI-P2A-mRuby3-expressing AAV into the corresponding Cre-driver lines, with mRuby3 serving as a transfection marker. Control experiments confirmed that the PKI expression was sufficient to suppress PKA activity in vivo (Extended Data Fig. 4c and 4d). As shown in Fig. 2b, mice progressively increased their running over successive days. However, this increase was largely attenuated in mice that expressed PKI in dSPNs or in iSPNs (8 bilateral injections/animal to cover the dorsolateral striatum; Extended Data Fig. 4e) compared to their respective littermates expressing a mutant, non-functional PKI (Fig. 2d). In an accelerating rotarod task, while PKI expression in dSPN impaired animal performance, PKI expression in iSPNs resulted in enhanced performance in the first day, but not in subsequent days (Extended Data Fig. 4f and 4g). The movement speed of PKI-expressing animals in an open field box was not altered (Extended Data Fig. 4h). These results suggest that PKA activity in both iSPNs and dSPNs is essential for different aspects of locomotion and locomotive adaptation.
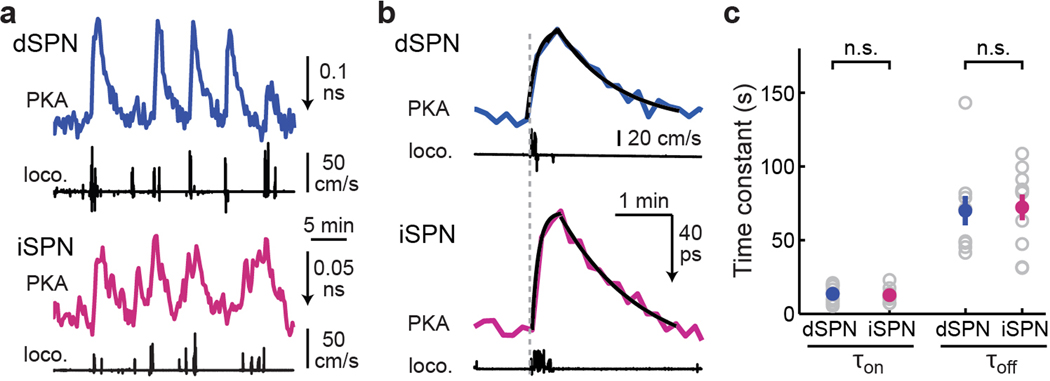
We next asked how PKA activity in dSPNs and iSPNs changed during locomotion. Surprisingly, increased PKA activity was observed not only in dSPNs, but also in iSPNs during locomotion using tAKARα but not its phosphorylation-deficient mutant (Fig. 2e–2g, Extended Data Fig. 5a, and Supplementary Video 1 and 2). In fact, averaged PKA activity was slightly larger in iSPNs than in dSPNs (Fig. 2h). Using a threshold of 3x the standard deviation (S.D.) of baseline, a higher percentage of iSPNs exhibited above-threshold PKA responses compared to dSPNs (Fig. 2i). While PKA activity from individual running events varied (the spread in Fig. 2h), on average longer running events resulted in larger increases in both dSPNs and iSPNs (Fig. 2j). To examine the kinetics of locomotion-induced PKA responses, we imaged selected fields of view (FOVs) at high frame rates and integrated the signal across the entire FOV to achieve a high signal-to-noise ratio. Only short-duration (<30 s) running bouts preceded by a quiescent period of >100 s were included. Locomotion-elicited PKA activity in both SPN types exhibited similar kinetics, with an onset time constant (τon) of ~12 s and an offset time constant (τoff) of ~70 s (Extended Data Fig. 5b and 5c).
Overall, these results indicate that locomotion requires striatal PKA function and is associated with increased PKA activity in both SPN types. The PKA activity increase in iSPNs was unexpected even when considering that phasic dopamine release does not suppress PKA activity in these neurons (Fig. 1e and 1f). We hypothesized that a neuromodulator other than dopamine may be involved.
A2AR mediates iSPN PKA activity increase
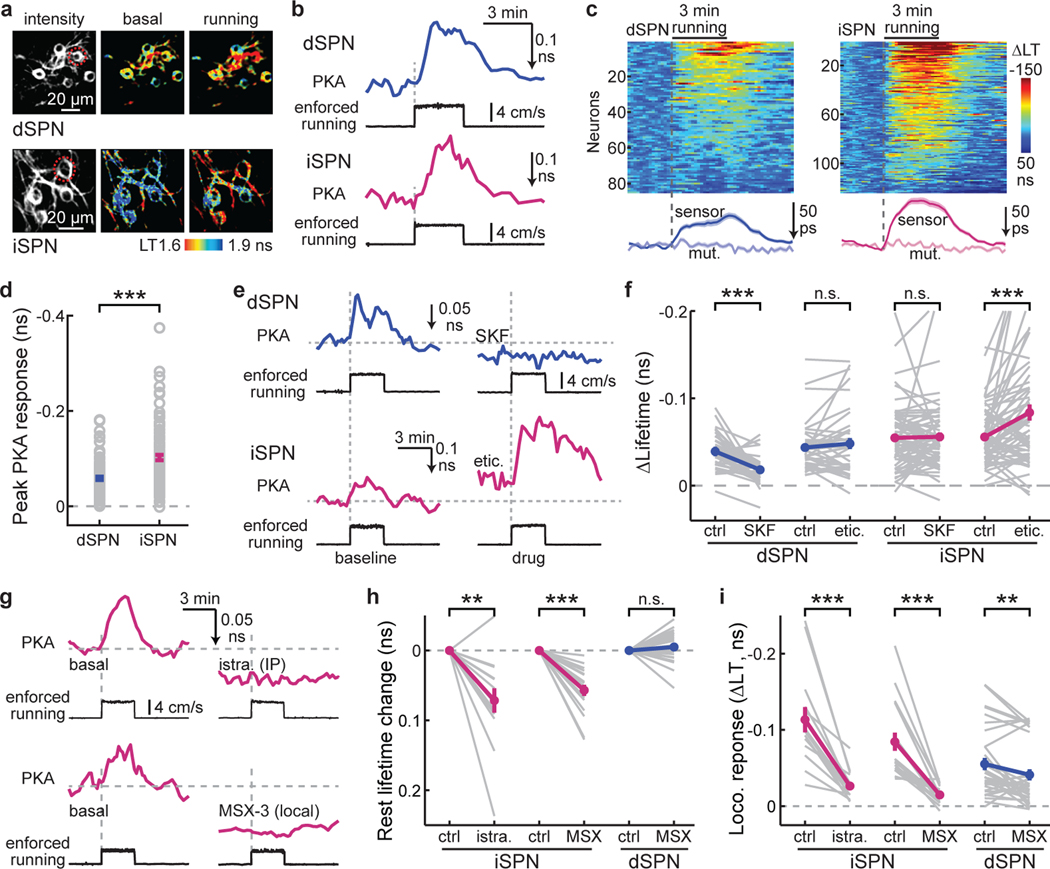
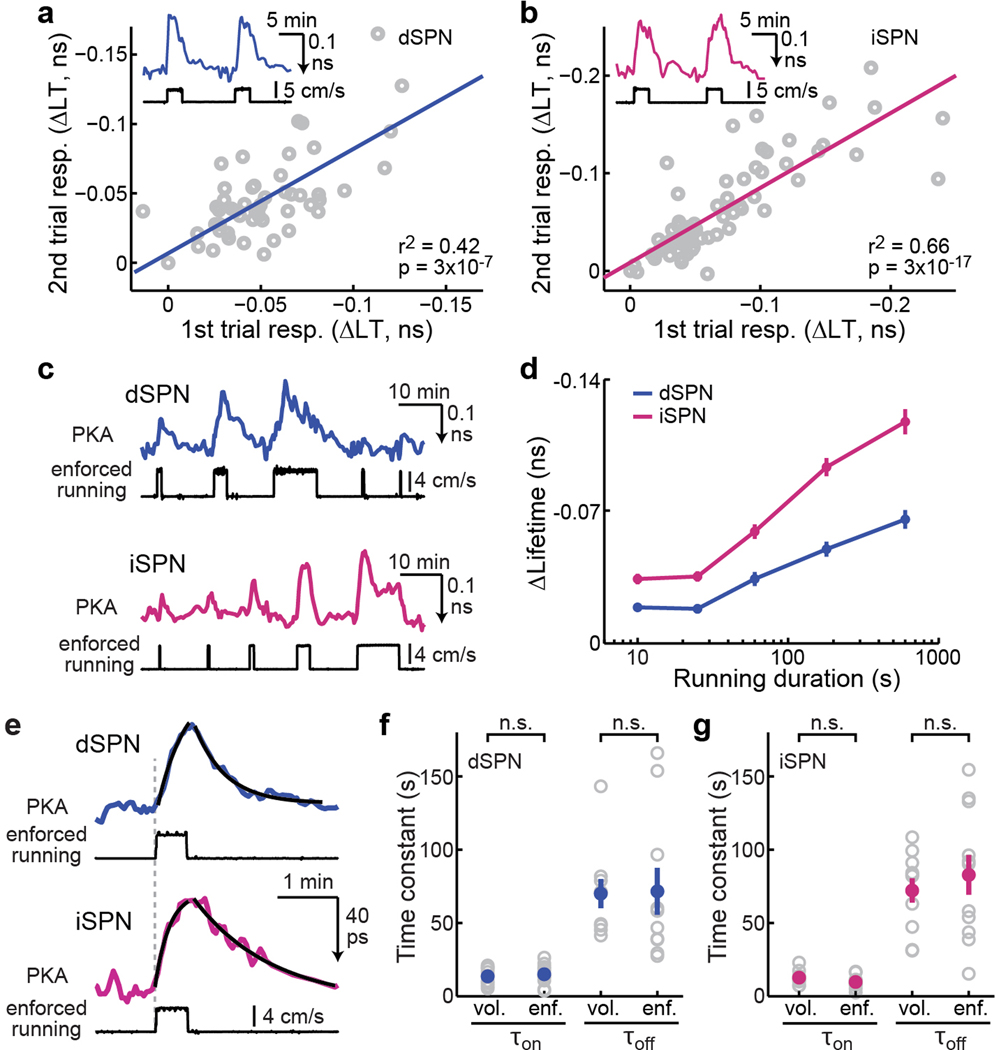
To investigate the mechanism underlying locomotion-elicited PKA activity in SPNs, we performed pharmacological dissection using the enforced locomotion paradigm41,42, which allows for precise and repeatable control of the timing and speed. Similar to voluntary running, enforced locomotion resulted in PKA activity increases in both dSPNs and iSPNs, as detected by tAKARα but not by its phosphorylation-deficient mutant (Fig. 3a–3c, and Supplementary Video 3 and 4), with iSPNs exhibiting a larger response than dSPNs (Fig. 3d). The PKA activity in both SPN types was reversible and repeatable (Extended Data Fig. 6a and 6b) and was positively related to the running duration (Extended Data Fig. 6c and 6d). When a short duration of running (25 s) was used, the onset and offset kinetics of PKA activity in dSPNs and iSPNs were similar to those of voluntary running (Extended Data Fig. 6e–6g), suggesting that the PKA activities elicited by the two paradigms were similar. Systemic injection of the D1R antagonist SKF83566, but not of the D2R antagonist eticlopride, significantly reduced locomotion-induced PKA responses in dSPNs (Fig. 3e and 3f), confirming that this PKA activity is dopamine-dependent. In contrast, SKF83566 did not affect PKA responses in iSPNs, and eticlopride significantly increased locomotion-elicited PKA activity in these neurons (Fig. 3f). The lack of blockade of iSPN PKA response by antagonism of either dopamine receptor types supports the idea that this PKA activity is not driven by dopamine.
Fig. 3. A2AR mediates PKA activity increases in iSPNs.
a & b, Representative images (a) and example traces (b) of PKA responses to enforced running in dSPNs and iSPNs. n (FOVs/mice) = 12/7 and 19/9, respectively. c, Raster plots (top) of PKA responses and their average (bottom) of dSPNs and iSPNs triggered by enforced running. The averaged traces from the mutant PKA sensor (mut.) are also shown. d, Collective peak amplitudes of 3-min enforced running-elicited PKA responses of dSPNs and iSPNs. Δlifetime (ns) = −0.058 ± 0.004 for dSPNs and −0.102 ± 0.005 for iSPNs. For panels c & d, n (neurons/mice) = 85/7 for dSPN and 124/9 for iSPN. Two-tailed Student’s t-test, p = 1.5×10⁻⁸; dF = 207; t = 5.9. e & f, Representative trace (e) and collective changes (f) of enforced locomotion-elicited PKA response in dSPNs and iSPNs before and after intraperitoneal injection of either SKF83566 (SKF) or eticlopride (etic.). n (neurons/mice) = 38/6 for dSPNs and 63/8 for iSPNs. Two-tailed paired Student’s t-test, from left to right, p = 2.4×10⁻⁶, 0.28, 0.82, 6.4×10⁻⁴; dF = 37, 37, 62, 62; t = −5.6, 1.1, 0.2, 3.6. g, Representative traces of enforced running-induced PKA response in iSPNs before and after intraperitoneal (IP) injection of istradefylline (istra), or local infusion of MSX-3. h & i, Collective changes of basal (h) and enforced running-induced PKA activity (i) in iSPNs or dSPNs elicited by the indicated local drug infusion. For both panels from left to right, n (neurons/mice) = 14/4, 18/6, and 32/5. Two-tailed paired Student’s t-test, from left to right, p = 0.0012, 1.6×10⁻⁶, 0.18, 4.9×10⁻⁵, 9.2×10⁻⁶, 0.0061; dF = 13, 17, 31, 13, 17, and 31; t = −4.1, −7.2, 1.4, −5.9, −6.3, and −2.9. All error bars and error bands represent SEM and their centers represent the mean. n.s.: p > 0.05; **: p ≤ 0.01; ***: p ≤ 0.001.
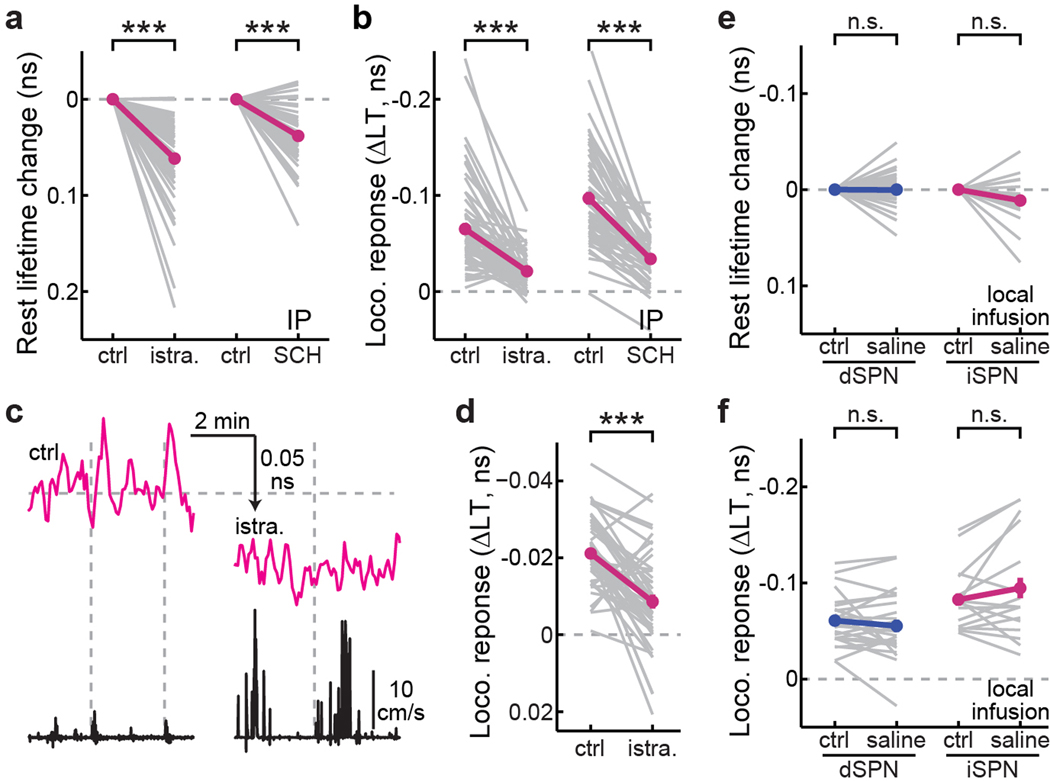
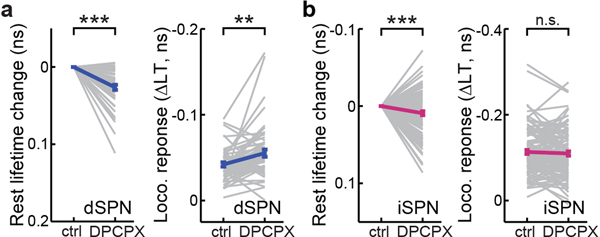
We hypothesized that locomotion-elicited PKA activity in iSPNs may be driven by the A2A adenosine receptor, which is selectively expressed in iSPNs in the striatum and couples to the Gs pathway3,19–21. To test this hypothesis, we administered several independent A2AR antagonists. Systemic administrations of either istradefylline (2 mg/kg) or SCH58261 (5 mg/kg) decreased PKA activity in iSPNs under resting conditions (Fig. 3g and Extended Data Fig. 7a), suggesting that a tonic level of adenosine exists. Importantly, locomotion-elicited PKA activity in iSPNs was nearly completely abolished by either drug (Fig. 3g and Extended Data Fig. 7b). Similar results were observed for the PKA activity elicited by voluntary running (Extended Data Fig. 7c and 7d). To verify that this effect was due to A2A receptors within the striatum, we performed local infusion. Local infusion of either istradefylline (5 µg/µL x 1 µL) or another A2AR antagonist MSX-3 (2.5 µg/µL x 1 µL), but not saline, reduced basal PKA activity and blocked locomotion-induced PKA activity in iSPNs (Fig. 3g–3i and Extended Data Fig. 7e and 7f). In contrast, local infusion of MSX-3 did not change basal PKA activity, and only slightly altered locomotion-induced PKA activity in dSPNs (26% decrease in dSPNs, cf. 83% decrease in iSPNs; Fig. 3h and 3i). The A1R antagonist DPCPX (2 mg/kg) increased locomotion-elicited PKA activity in dSPNs while decreasing their basal PKA activity (Extended Data Fig. 8a), presumably reflecting the complex expression pattern of A1 adenosine receptors both in dSPNs and in presynaptic axons20. DPCPX also resulted in a statistically significant, but small decrease in iSPN basal PKA activity and had no effect on locomotion-elicited PKA activity in iSPNs (Extended Data Fig. 8b).
Locomotion elevates adenosine level
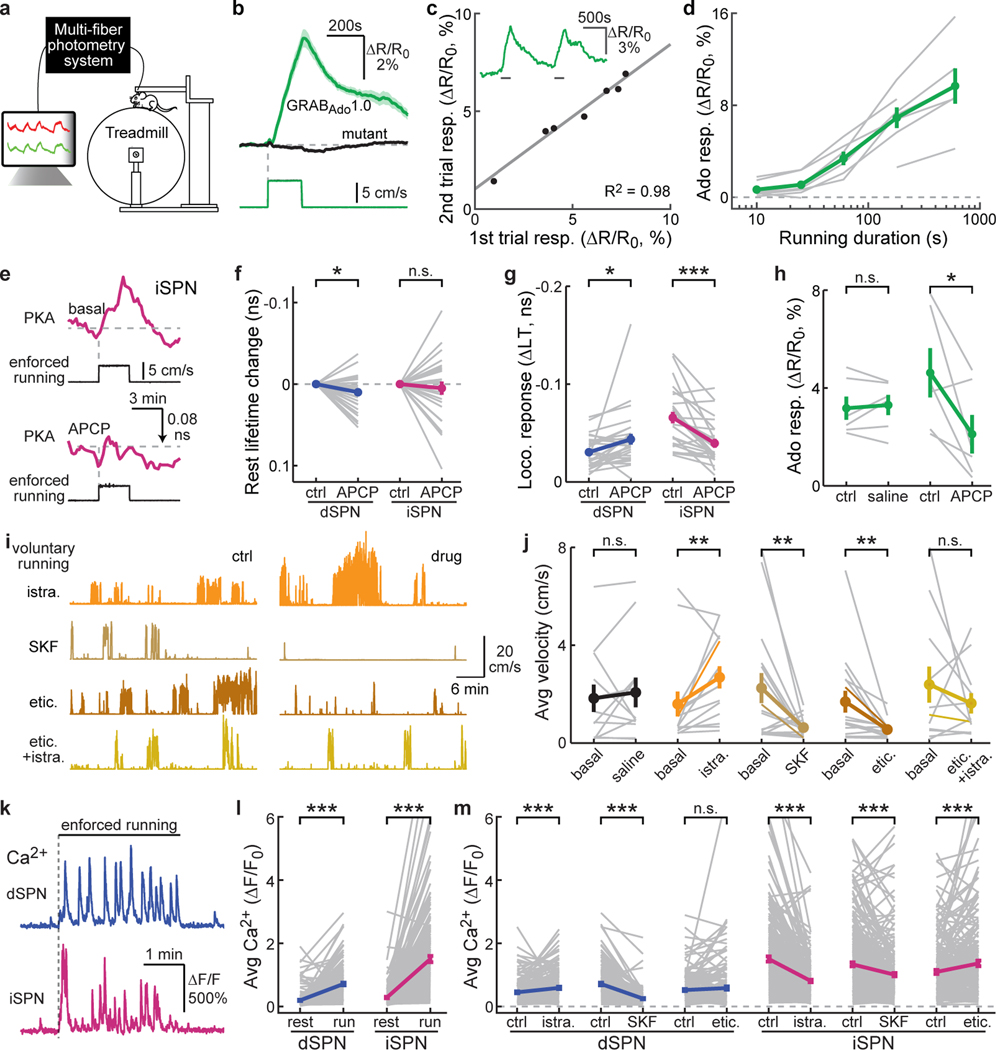
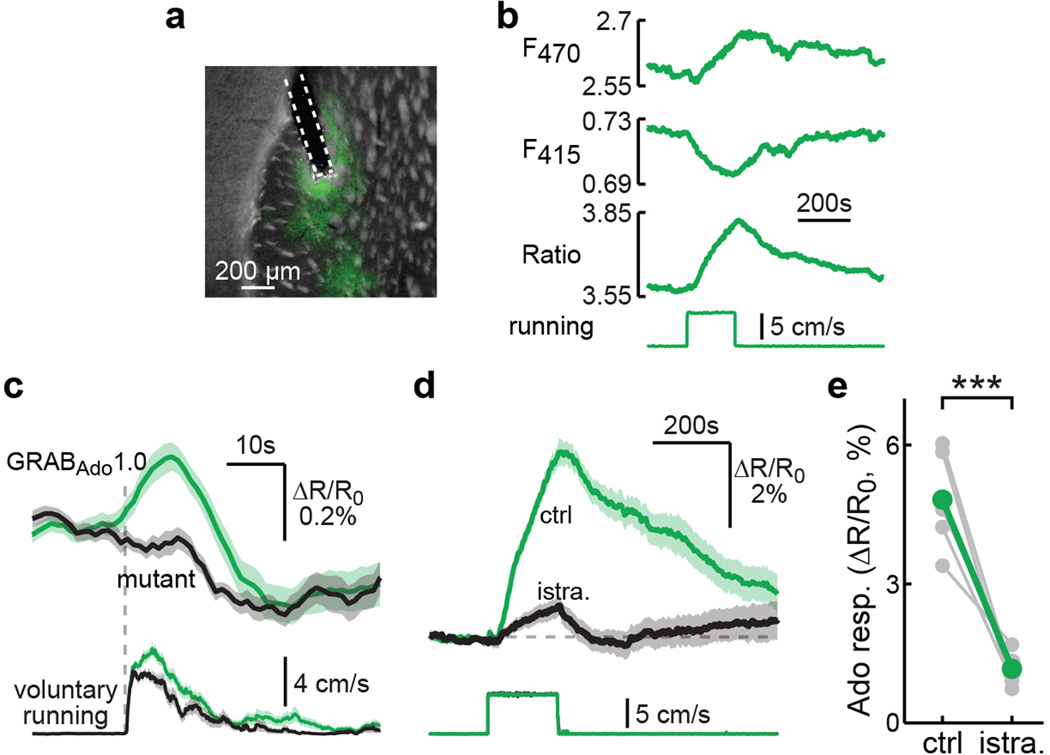
The above results suggest that adenosine is acutely released in the dorsolateral striatum during locomotion. We therefore directly examined adenosine dynamics in vivo using the newly developed adenosine sensor GRABAdo1.043. This sensor was expressed across neuronal types in the dorsolateral striatum of wildtype mice via AAV injections and measured using fiber photometry (Fig. 4a and Extended Data Fig. 9a). GRABAdo1.0, but not a mutant sensor that cannot bind adenosine43, gave rise to a time-locked signal increase (ΔR/R0; see Methods) when the mouse was subjected to enforced locomotion (Fig. 4b and Extended Data Fig. 9b). Similar to PKA activity in iSPNs, the adenosine accumulation was reversible and repeatable (Fig. 4c), and monotonically increased with the running duration (Fig. 4d). Consistently, GRABAdo1.0 also reported a clear signal increase during animal voluntary running compared to the mutant sensor (Extended Data Fig. 9c). This increase in adenosine was largely abolished by the systemic administration of the A2AR antagonist istradefylline, which is consistent with the fact that the sensor was developed based on the A2A adenosine receptor (Extended Data Fig. 9d and 9e). These results indicate that locomotion results in adenosine accumulation in the striatum, which is likely the source of the PKA activity increase in iSPNs.
Fig. 4. Locomotion results in acute adenosine accumulation.
a, Schematic of fiber photometric recording while mice run on a treadmill. b, Averaged response of GRABAdo1.0 (green) and its mutant (black) elicited by enforced running. n (bouts/mice) = 33/6 for GRABAdo1.0 and 20/5 for mutant. c, Example trace (inset) and correlation of adenosine responses to two consecutive enforced running trials. n = 7 mice. d, Running duration-adenosine response relationship. From left to right time points, n = 7, 7, 6, 7, and 6. e, Representative traces of enforced running-induced PKA responses in iSPNs before and after local infusion of APCP. f & g, Collective changes of basal (f) and enforced running-induced PKA activity (g) in iSPNs and dSPNs after local infusion of APCP. From left to right, n (neurons/mice) = 28/4 and 26/6 for both panels. Two-tailed paired Student’s t-test, from left to right, p = 0.025, 0.54, 0.021, 4.9×10⁻⁵; dF = 27, 25, 27, 25; t = −2.4, −0.6, 2.5, −4.9. h, Collective changes of the GRABAdo1.0 response to 5 min enforced running before and after local infusion of saline or APCP. n (mice) = 6 for both. Two-tailed paired Student’s t-test, from left to right, p = 0.65 and 0.041; dF = 5 and 5; t = −0.48 and 2.73. i & j, Example traces (i) and collective running velocity (j) before and after intraperitoneal injection of the indicated drugs. From left to right, n (mice) = 12, 14, 16, 16, and 12. Two-tailed paired Student’s t-test on data normalized to the respective basal values on the log scale, from left to right, p = 0.42, 0.0024, 0.0086, 0.0017, 0.74; dF = 11, 13, 15, 15, 11; t = −0.8, −3.8, 3.0, 3.8, 0.3. k & l, Representative traces (k) and collective calcium responses (l) elicited by 3-min enforced running in dSPNs and iSPNs. n (neurons/mice) = 179/7 for dSPNs and 258/6 for iSPNs. Two-tailed paired Student’s t-test, from left to right, p = 2.9×10⁻²⁴ and 7.8×10−39; dF = 178 and 257; t = −11.9 and −15.5. m, Collective enforced running-elicited calcium responses before and after intraperitoneal injection of indicated drugs in dSPNs and iSPNs. From left to right, n (mice/neurons) = 171/6, 179/7, 188/6, 258/6, 290/7, and 214/6. Two-tailed paired Student’s t-test, from left to right, p = 2.9×10⁻⁵, 1.5×10⁻²⁷, 0.16, 6.2×10⁻²², 3.2×10⁻⁹, 7.1×10⁻⁴; dF = 170, 178, 187, 257, 289, 213; t = −4.3, 13.0, −1.4, 10.6, 6.1, −3.4. All error bars and error bands represent SEM and their centers represent the mean. n.s.: p > 0.05; *: p ≤ 0.05; **: p ≤ 0.01; ***: p ≤ 0.001.
We next explored the upstream mechanism of adenosine rise. Extracellular conversion from ATP is thought to be a major mechanism of adenosine production20. To test this possibility, we locally infused APCP (1 µg/µL x 1 µL) to antagonize CD73, an essential nucleotidase for this conversion. This manipulation significantly attenuated the PKA activity increase in iSPNs during locomotion without affecting basal PKA activity (Fig. 4e–4g). APCP also slightly decreased basal PKA activity and increased locomotion-elicited PKA activity in dSPNs (Fig. 4f and 4g). Correspondingly, local infusion of APCP also dramatically attenuated the increase of adenosine during locomotion, as measured with GRABAdo1.0 (Fig. 4h). These results suggest that the rise of adenosine is in part mediated by the extracellular metabolism of ATP. Notably, our earlier result suggests the presence of a tonic level of adenosine (Fig. 3h). The basal PKA activity, however, was not affected by APCP, suggesting that tonic and locomotion-elicited adenosine may be produced via distinct mechanisms (see also ref 44).
A2AR modulates locomotion and iSPN Ca2+
How does adenosine-elicited PKA activity in iSPNs affect animal locomotion? We showed earlier that PKA activity in iSPNs was essential for normal locomotion (Fig. 2c and 2d). Here, we further addressed this question by pharmacological blockade of the A2A adenosine receptor and compared this to the blockade of dopamine receptors. Systemic injection of the A2AR antagonist istradyfelline resulted in acute increases in animal locomotion on the treadmill (Fig. 4i and 4j). In contrast, both the D1R antagonist SKF83566 and D2R antagonist eticlopride resulted in decreased animal locomotion (Fig. 4i and 4j), which was consistent with previous observations45. Interestingly, when eticlopride and istradyfelline were applied simultaneously, the effects of these two drugs canceled each other out (Fig. 4i and 4j), suggesting that dopamine and adenosine are functionally antagonistic to each other. Overall, both adenosine and dopamine modulate animal locomotion, but in opposing directions.
How do dopamine and adenosine affect locomotion? One plausible mechanism is that their regulation of PKA modulates neuronal excitability and synaptic transmission in SPNs3,7,16,18,22,23, thereby changing the firing activity of these cells. We therefore examined how A2AR and dopamine receptor antagonism affected dSPN and iSPN calcium activities during animal locomotion using in vivo two-photon imaging of GCaMP6s via the GRIN lens. Consistent with prior studies4,46,47, enforced locomotion elicited robust calcium signals in both type of SPNs (Fig. 4k and 4l, and Supplementary Video 5 and 6). Importantly, systemic injection of the A2AR antagonist istradefylline significantly reduced this calcium activity in iSPNs (Fig. 4m). A small increase in the calcium activity in dSPNs was also observed (30% increase, cf. 46% decrease in iSPNs), possibly due to reduced lateral inhibition from iSPNs48. In contrast, blockade of the D1 dopamine receptor with SKF83566 greatly reduced calcium activity in dSPNs and, to a much less extent, in iSPNs (65% decrease in dSPNs, cf. 24% in iSPNs). Blocking the D2 receptor with eticlopride resulted in increased calcium activity in iSPNs without a detectible change in dSPNs (Fig. 4m). These results suggest that dopamine and adenosine regulate animal behavior by altering the SPN activity in the dorsolateral striatum.
Conclusion and discussion
To our knowledge, this is the first report of PKA activity imaging with cellular resolution in the striatum of behaving mice. We found that animal locomotion was regulated by PKA activity and was associated with elevated PKA activity in both dSPNs and iSPNs. Among these observations, the PKA activity increase in iSPNs was unexpected. Additional evidence suggests that this PKA activity in iSPNs is likely driven by an acute accumulation of extracellular adenosine via the A2A adenosine receptor. To date, little is known about whether, when, and where adenosine is released during animal behavior. The results herein provide direct evidence of acute adenosine accumulation in the striatum during locomotion. Moreover, our results suggest that both adenosine and dopamine are important for normal locomotion, possibly via their distinct roles in regulating SPN activity. In addition, recent studies have found that dSPNs and iSPNs are concurrently activated during locomotion45–47. Our results provide a potential mechanism: PKA activity is concurrently elevated in both SPN types, which presumably increases synaptic transmission and neuronal excitability18,22,23. Overall, it appears that dopamine and adenosine coordinate with each other in the striatum to orchestrate animal locomotion, and thus provide a new basis for understanding striatal function. Other neuromodulators, such as opioids, acetylcholine, and serotonin, have also been suggested to play roles in the striatum and may couple to PKA. In the future, it will be interesting to investigate when and where these neuromodulators are released and how they interact with the dopamine-adenosine system to fine-tune PKA activity and striatal function.
Our results also provide new insights into the actions of dopamine in the striatum. Specifically, the classic model predicts that dopamine would lower the excitability and gain of iSPNs by suppressing cAMP/PKA. Our results indicate that, although tonic dopamine indeed decreases PKA activity in iSPNs to the neuron-specific set point, additional phasic dopamine release does not further decrease PKA activity in these neurons (Fig. 1e and 1f), which is consistent with a recent study in the nucleus accumbens34. Interestingly, global activation of D2 receptors can decrease iSPN PKA activity (Extended Data Fig. 3f). One possibility is that there are two pools of D2 receptors, such as synaptic and extrasynaptic receptors. Dopamine released from tonic firing of dopaminergic axons saturates the function of synaptic, but not extrasynaptic, D2 receptors. Notably, although there is ongoing discussion regarding that D2 receptors may exhibit a high affinity for dopamine49, such saturation can potentially also occur at the intracellular signaling level and can be pathway specific. Future experiments will be required to distinguish between these possibilities.
The direct and indirect striatal pathways are thought to form a “go and no-go” system whose balance controls animal action2–4,6. However, dopamine’s action in both dSPNs and iSPNs is prokinetic. Adenosine enhances iSPN PKA activity and limits dopamine increase of dSPN PKA activity – both of which would reduce locomotion. Thus, dopamine and adenosine appear to be two opposing neuromodulators that form a push-pull system. One possible function is to support fine motor control. PKA signaling and dopamine’s effects on SPN physiology last for minutes (e.g., Fig. 2g, see also ref 16). The existence of an opposing modulatory mechanism may enhance the kinetics and degree of motor control. Another potential function is to suppress competing action plans mediated by different ensembles of SPNs. In future studies, it will be interesting to compare the timing, kinetics, and spatial organization of both extracellular neuromodulator concentrations and intracellular PKA responses between dopamine and adenosine releases during animal behaviors. The differences may affect the window of action selection, initiation, switching, and learning. Interestingly, for both dSPNs and iSPNs, the PKA response to locomotion is heterogeneous across cells (Fig. 3c). This may be mediated by differential access to neuromodulators or by cell-variable expression of downstream signaling components. Regardless of the mechanism, heterogeneity in PKA activity dynamics may potentially contribute to SPN ensembles that have been observed using calcium imaging (e.g., ref 47).
Notably, although acute blockade of adenosine receptors increases locomotion, prolonged disruptions of A2A receptors (i.e., in knockout mice) has been found to lead to lower levels of locomotion and impaired habituative behaviors24,26,27. When we expressed PKI in iSPNs, the animal’s short-term motor learning on the accelerated rotarod was enhanced on the first day (Extended Data Fig. 4g), but their adaptation to a treadmill over multiple days was decreased (Fig. 2d), suggesting potential tradeoffs between short-term versus long-term benefits. In addition, while our study was focused on neuronal somata, there may be interesting differences in PKA dynamics in other subcellular compartments, such as neuronal dendrites. Finally, the loss of dopamine in the striatum is known to result in brain disorders, such as Parkinson’s disease. Adenosine receptors have been suggested to be potential therapeutic targets50. With the direct revelation of adenosine accumulation and its signaling consequences, our results may facilitate the design of strategies to treat striatal dysfunction.
Methods
Experimental animals
All animal experiments and handling were conducted in accordance with the US National Institutes of Health Guide for the Care and Use of Laboratory Animals and were approved by the Institutional Animal Care and Use Committee (IACUC) of the Oregon Health & Science University (#IP00000420). Transgenic mice used in this study included: Drd1a-cre (MMRRC#036916), Adora2a-cre (MMRRC#036158), and DAT-IRES-cre (Jax#006660). Wildtype C57BL/6 mice were acquired from Charles River or were home-bred within 5 generations from Charles River breeders. Mice of 2–8 months of age and of both sexes with approximately equal proportions were used and were maintained on a 12-h light-dark cycle, with food and water available ad libitum.
For all animal experiments, mice were randomly assigned to the control or experimental group in such a manner that the age and sex were approximately equally distributed across groups. The number of mice used was empirically determined based on previous experience and the variability of data. The experimenter was not blinded to the animal identity due to the lengthy time required to maintain these animals and the need to perform genotyping before surgery and experiments. However, the assignment of individual animals to experimental groups was random. All data for the same experiment were collected under identical conditions, and all data analyses were performed using the same code across different conditions and genotypes for the same type of experiment. Each experiment included mice from multiple breedings, and the experimental results were qualitatively the same across different cohorts of mice. As a check of data analyses, optogenetics experiments, voluntary locomotion elicited PKA responses, and fiber-photometric responses were analyzed independently by two individuals using independently derived code. The results were qualitatively the same.
Virus injections
Used viruses included AAV1-hSyn-tAKARα (custom made), AAV8-FLEX-hSyn-tAKARα (custom made), AAV8-FLEX-hSyn-tAKARα-T391A (custom made), AAV1-CAG-FLEX-GFP (UPenn, lot #V0827), AAV1-CAG-FLEX-GCaMP6s (Addgene #100833), AAV5-CAG-FLEX-ChR2-tdTomato (Addgene #18917), AAV9-hSyn-GRABAdo1.0 (WZ Biosciences), AAV9-hSyn-GRABAdo1.0mut (WZ Biosciences), AAV1-CAG-FLEX-PKI-P2A-mRuby3 (custom made), and AAV1-CAG-FLEX-PKImut-P2A-mRuby3 (custom made). For imaging experiments in the dorsolateral striatum, 100 nL of the appropriate viral vectors were pressure-injected via a glass pipette into the dorsal striatum (positions relative to bregma: anterior-posterior [AP]: +1.00 mm; medial-lateral [ML]: +/− 2.4 mm; dorsal-ventral [DV]: −2.65 mm). To achieve broad expression of PKI in the dorsal striatum, eight injections were made across both hemispheres of the striatum (positions relative to bregma: AP: −0.9 mm, −0.4 mm, 0.3 mm, 0.8 mm; ML: +/− 1.8 mm, +/− 2.3 mm, +/− 2.8 mm, +/− 3 mm; DV: 3 mm, 3.2 mm, 2.9 mm, 3.5 mm, respectively). For the PKI experiments involving Drd1a-cre mice, 50 nL of virus diluted to approximately the same titer (~1.2 × 10¹³ GC/mL for both AAV-FLEX-PKI-P2A-mRuby3 and AAV-FLEX-PKImut-P2A-mRuby3 for) was injected into the above locations. For Adora2a-cre mice, 80 nL virus of ~0.6 × 10¹³ was injected.
Dorsal striatum window implant surgery
Three hours before starting the surgery, mice (typically P45–65) were treated with the anti-inflammatory agent dexamethasone (4 mg/kg). Carprofen (5 mg/kg) was administered just prior to the surgery. Mice were then anesthetized with isoflurane (4% for induction and 1.5% for maintenance) and mounted on a stereotaxic device with body temperature being maintained by a heating pad. For regular striatum imaging, a ~1.4-mm craniotomy was performed over the dorsal striatum (relative to bregma: AP: +1.00 mm; ML: 2.4 mm), and a small amount of brain tissue above the striatum was aspirated. Following the craniotomy and aspiration, a guide cannula (316 stainless-steel tubing, 1.27 mm outer diameter, 1.1 mm inner diameter, and 3.6 mm length) with a glass coverslip glued and sealed at one end with UV glue (NOA81) was implanted at the site of the craniotomy. The guide cannula was then sealed and attached to the skull with Metabond (No.1469SB) and further stabilized with cyanoacrylate glue (00005–12-Merchant) and dental acrylic cement (459–4073). A head plate was then mounted to the skull with Metabond and dental cement. For simultaneous imaging and local drug infusion, a small diameter craniotomy (~0.7 mm) was made right next to the regular 1.4 mm craniotomy to allow the implantation of an additional infusion cannula (0.64 mm outer diameter), which was glued to the side of the guide cannula. The tip of the infusion cannula was made to be approximately 100 μm longer than the guide cannula. Imaging was performed at least one month post-surgery to allow for full recovery of the animal.
Histology
To locate the potential field of view (FOV), mice retired from imaging experiments were anesthetized with isoflurane and then fixed via cardiac perfusion with 50 mL cold phosphate-buffered saline PBS (Fisher) followed by 50 mL of 4% paraformaldehyde and then another 30 mL of PBS. Brains were dissected out and post-fixed in 4% paraformaldehyde overnight. 100-μm coronal sections were sliced using a vibratome (Leica VT1200S) and imaged with a Zeiss Axio Zoom V16 microscope. FOV centers were determined by overlaying section images onto corresponding brain atlas sections.
Pharmacology and local infusion
All drugs were dissolved in saline unless noted otherwise. Drug concentration for systemic (intraperitoneal) injection (in mg/kg): 0.2 SKF83566 hydrobromide, 0.1 eticlopride hydrochloride, 2 istradefylline (in DMSO), 5 SCH58261 (in DMSO), 2 DPCPX (in DMSO), or 1 quinpirole. To test the behavior effect of PKA inhibition, 1 μL H89 or Rp-8-Br-cAMPS with a concentration of 4 μg/μL was bilaterally infused into the dorsal striatum through a pre-mounted guide cannula (0.64 mm outer diameter, RWD catalog No.62001). The drugs were continuously infused with a size-matched injector (0.41 mm outer diameter, RWD catalog No.62201) at a rate of 0.1 μL/min through a New Era Pump System (Dura-NE-1000x). The integrated running distance within 40 min before and 20 min after drug infusion was compared to determine the drug effect. For simultaneous imaging and local application of drugs, 1 μL of (μg/μL) 4 H89, 4 Rp-8-Br-cAMPS, 1 SKF83566 hydrobromide, 5 istradefylline, or 2.5 MSX-3 was locally infused into the brain over 10 min via an infusion cannula implanted immediately next to the guide cannula. Animals were subjected to enforced locomotion before and 20 min after local infusion. The locally infused drug effect was then determined by comparing locomotion-induced PKA activity between the two different conditions.
Behaviors
The basal condition is defined as a mouse quiescently resting on a platform or a treadmill without obvious movements and without any drug administration.
For voluntary running, mice were head-fixed with their limbs resting on a spherical treadmill (20 cm diameter), and were allowed to run at will. A rotary encoder (US Digital #MA3-A10–250-N) coupled to the axle of the treadmill was used to measure the rotational velocity as an analogue voltage signal (~0–5 V), which was then digitized at 1 kHz using a National Instrument DAQ board (PCIe-6259), the MATLAB DAQ toolbox and custom MATLAB code (AnimalStateTracker). The signal was converted to rotary speed at 20 Hz. Mouse running and other behaviors were also recorded by an infrared CCD camera illuminated by infrared light sources. Forward locomotion onset was identified as: 1) the running velocity being greater than 0.8 cm/s, and 2) the net forward distance being >20% of the summed absolute distance (i.e., summation of both forward and backward traveling distances) in a ±15 s window. This second criterion is necessary to exclude mouse balancing movements that are different from forward locomotion. To ensure a reliable determination of baseline PKA activity, only bouts preceded by a non-running period of ≥100 s were included. Pharmacological experiments assessing how a drug affects the voluntary locomotion were carried out in habituated mice (>1 hr/day for at least 5 days). Drug effects were determined by comparing the integrated running distance within a 40-min measurement window immediately before and 20 min after drug administration.
For enforced locomotion, the treadmill was coupled to a motor to control the speed (~5 cm/s) and running duration of the locomotion. To reduce potential stress effects, mice were habituated on the treadmill for 8 days before they were subjected to enforced locomotion, and were allowed to rest at least 10 min between running trials. Pharmacological effects on enforced running-elicited calcium or PKA activity were measured at least 20 min after drug injection.
For accelerating rotarod training, a four-chamber system (Dual Species Economex; Columbus Instruments) was used. Mice were allowed to run forward on the motorized rod (38 mm in diameter) in the chamber. The rotation speed of the rod gradually increased from 5 RPM with an acceleration of 0.5 RPM/s. The time when the animal fell was recorded. Each mouse was trained for 20 trials/day for 2 days.
For open field testing, a mouse was gently placed inside an open-top arena (37 [length] x 37 [width] x 40 [height] cm) with the mouse position recorded via an overhead-mounted camera for 20 min. Before the experiment and between different mice, the arena was wiped clean with 70% ethanol, and ethanol was allowed to evaporate completely. The StereoScan Behavior Analyzing System was used to track and evaluate mouse movement. The average velocity was calculated by the total distance over the entire period divided by the total time.
Two-photon and 2pFLIM imaging
In vivo two-photon imaging setups were custom-built based on the open-source MIMMS design from Howard Hughes Medical Institute Janelia Research Campus, and controlled by ScanImage51. The 2pFLIM capability was integrated to the two-photon microscope as previously described30,31. Briefly, calcium or PKA sensors were excited by a pulsed 80 MHz Titanium-Sapphire laser at 920 or 960 nm, and the emission was filtered by a Chroma ET500/40m-2p barrier filter. For FLIM, the laser timing, as detected by a photodiode (Thorlabs FDS010), and the signaling photon timing, as recorded by a cooled GaAsP photomultiplier tube (Hamamatsu H10769PA-40), was compared using a SPC-150 (Becker and Hickl) time-correlated single photon counting board. The timing of each photon was included to a binned lifetime curve for the corresponding imaging pixel with 64 points per 12.5-ns laser cycle (0.195 ns/bin). Please note that the sensor lifetime (τ), i.e., the average of the emission time of all photons, can be determined with a precision well below the bin size. The precision (i.e., the error in determining τ [δτ]) is limited by the number of photons (N) following the equation δτ = τ / N1/2 (refs 30 and 31). The system had an impulse-response function that was simulated by a Gaussian curve with a sigma of ~0.15 ns. 2pFLIM images were acquired via the FLIMimage software provided by Dr. Ryohei Yasuda, which functioned as an add-on to ScanImage. All experiments were performed using a 20X water objective (Nikon; N.A. 0.8) to couple with a GRIN lens52,53 (1.0 mm diameter; Inscopix #GLP-1042) inserted into the guided cannula. The two-photon scanning speed was 2 ms/line, which is separated into 128 or 256 pixels. For FLIM, 3–6 frames at a z-depth consisting of 128 or 256 lines, respectively, was integrated. The pixel resolution was typically 128×128 or 256×256. The imaging speed was 3–10 s/image for PKA imaging and 3.49 Hz for calcium imaging.
Imaging data analysis
Two-photon imaging and 2pFLIM imaging analyses were carried out using custom software written in MATLAB (SI_View and FLIMview, respectively), as described previously30,54. Where appropriate, regions of interest (ROIs) were manually drawn to isolate individual somata and dendrites that were well separated. Cross contaminations of signals between somata and dendrites are expected to be small. Only one or two z optical sections were imaged that were centered at somata of interest, which were quite large (>10 µm) and much brighter than dendrites. Dendritic ROIs were drawn at locations without a visible soma. The signal of the entire ROI was integrated.
For calcium imaging analyses, individual ROIs were manually drawn on visually identified neuronal somata. The baseline fluorescence (F0) of each cell was estimated as the smallest value of a running average of 30 points (~8.6 seconds, as the frame rate is 3.49 Hz) within the experimental period. This is to control for certain cells that have high activity at the resting state. The averaged calcium activity was then computed from baseline-normalized signal (i.e., ΔF/F0) during the appropriate experimental period (200 points [57.3 s] before running onset for baseline and the entire 3-min running period for running).
Fiber implantation
To implant the optical fiber for photometric experiments, mice were anesthetized with isoflurane (4% induction, 1–2% maintenance) and the scalp was retracted. A 0.25-mm burr hole was drilled into the skull at +/− 2.4 mm ML from the midline and 1 mm anterior to bregma. 100 nL of AAV9-hSyn-GRABAdo1.0 or AAV9-hSyn-GRABAdo1.0mut virus was pressure injected into the dorsal striatum at a depth of 2.65 mm below bregma, as described earlier. After 10 min to allow the brain to settle and the virus to permeate the tissue, the viral injection pipette was retracted, and a photometry fiber (3 mm length, 125 µm diameter, 0.39 NA; RWD Life Science) was slowly lowered along the same track to ensure accurate colocalization of sensor expression with the fiber tip. The remaining fiber and ferrule end were then fixed to the skull along with a head plate using dental cement. The mice were returned to their home cage for at least two weeks to recover prior to data collection.
To perform local drug infusion during fiber photometric measurements, a local infusion guide cannula (0.64 mm outer diameter, RWD #62001) was implanted together with the optical fiber in the same animal. The cannula was first implanted into the dorsal striatum with a depth of 2.65 mm from bregma (relative to bregma: AP: +1.0 mm; and ML: 2.4 mm). To ensure that the imaging region was close to the site where the local infusion cannula sat, an optical fiber (3.5 mm length, 125 µm diameter, 0.39 NA; RWD Life Science) was implanted at a 30-degree angle and 2 mm posterior to the local infusion cannula. The fiber was slowly inserted at this angle for ~3 mm, with the tip of the fiber estimated to be ~200 μm from the opening of the local infusion cannula in the brain.
Photometry data collection and analysis
Mice were head-fixed and placed on a treadmill, as described above. Patch cords were attached to the fiber ferrules, held in place by ceramic sleeves. Recordings were performed using the Neurophotometrics V2 photometry system (https://neurophotometrics.com/) controlled by Bonsai (https://open-ephys.org/bonsai). Up to 8 fibers could be recorded simultaneously. Green fluorescence (492–530 nm emission filter) was integrated for 63 ms excited by interleaved 470 nm and 415 nm (with a 63-ms delay to 470 excitation) light, which was delivered at 1 Hz at a power of 20–35 µW, as measured from the tip of the fiber. Based on existing data from other GRAB sensors55, 470 nm is near the point of maximal dynamic range while 415 nm is at a wavelength shorter than the isosbestic point (~435 nm). Therefore, increased adenosine concentrations would result in signal increases in the 470 nm channel and decreases in the 415 nm channel. To correct for photobleaching and movement artifacts, recordings from each channel were smoothed with a 5-point moving window, and the 470 nm trace was then divided by the 415 nm trace. The data are therefore presented as ratios (R).
To average or compare across days and animals, recorded data (R) were subtracted by the baseline within 60 s before the movement onset and normalized to the average ratio of the first 3 min of the entire recording of the day (i.e., ∆R/R0). For local infusion experiments, the response was normalized to the baseline immediately prior to running because the infusion sometimes caused significant baseline shifts, presumably due to position drifts. Response epochs with large drifts during the baseline period (>1% ∆R/R0; corresponding to ~30% of the average basal response), which presumably were due to unequilibrated drug effects, were excluded. For voluntary running analysis, only running bouts with a minimum 20-s quiescent period (i.e., no running) were included.
Data quantification and statistical analysis
All data quantification was performed using custom software written in MATLAB. For measuring basal PKA activity changes in response to different drugs, the mean lifetime of a 60 s measuring window 20 min after drug application was compared with a baseline window immediately before drug administration. For PKA activity elicited by optogenetic dopamine release, the response was determined as the peak response within the first 20 s after stimulation and was compared with an 80 s baseline lifetime window before the stimulation. For the voluntary running-induced PKA response, the lifetime data was first smoothed by three points, and the response was determined by comparing the peak amplitude within a 40 s measurement window after movement onset with the averaged lifetime of a 30 s baseline window before movement onset. The voluntary running-induced PKA activity trace (Fig. 2g) was constructed by first averaging across trials within a neuron, and then further averaging across neurons. For enforced running-induced PKA responses, lifetime data was smoothed by three points. The peak amplitude within the entire running period was used to compare with the averaged lifetime within a 150 s window before movement onset. The magnitude of the adenosine response elicited by enforced running was measured as the maximum signal in the 60 s following the running offset.
All PKA sensor lifetime responses are presented on inverted y-axes because a decrease in lifetime indicates increased PKA activity.
Extended Data
Extended Data Fig. 1. dSPNs and iSPNs exhibit cell-specific set points of basal PKA activity.
a, Example projections from dSPNs and iSPNs, as visualized by Cre-dependent GFP expression in the dorsal striatum of Drd1a-cre (5 mice) and Adora2a-cre mice (2 mice), respectively. GPe: globus pallidus, external segment; SNr: substantia nigra pars reticulata; inj: injection site; proj: projection site. b, Representative post hoc histology section of an animal with GRIN lens implanted and tAKARα expressed in iSPNs, and centers of GRIN lens implantations for dSPNs (blue, 17 mice) and iSPNs (magenta, 15 mice), as mapped onto nearby coronal sections from Franklin & Paxinos (2007)56. Section positions in millimeters anterior to bregma are indicated. c, Comparison of basal tAKARα lifetimes between dSPN or iSPN somata and their corresponding dendrites. n (neurons/mice) = 16/4 for dSPN and 22/6 for iSPN. Between somata and dendrites, two-tailed paired Student’s t-test, from left to right, p = 1.4×10⁻⁴ and 1.5×10⁻⁴; dF = 15 and 21; t = 5.1 and 4.6. Between somata of dSPNs and iSPNs, two-tailed unpaired Student’s t-test, p = 0.79; dF = 36; t = 0.26. d, Collective changes of basal PKA activity responding to isoflurane (isofl.) exposure (1.5%). n (neurons/mice) = 52/5 for dSPNs and 71/7 for iSPNs. Two-tailed paired Student’s t-test, from left to right, p = 5.8×10⁻²⁵ and 3.5×10⁻³²; dF = 51 and 70; t = −19.2, and −21.2. e & f, Representative intensity and corresponding lifetime (LT) images across two days (e) and correlation of basal lifetimes of the same cells (f) for dSPNs and iSPNs. The p values are from the fit. g, Basal lifetimes of the same cells across seven consecutive days. h, Correlation of basal lifetimes with the average fluorescence intensity of the corresponding cells. The p values are from the fit. For panels e–h: n (neurons/fields of view [FOVs]/mice) = 52/12/5 for dSPNs and 86/19/8 for iSPNs. All error bars represent SEM and their centers represent the mean. n.s.: p > 0.05; ***: p ≤ 0.001.
Extended Data Fig. 2. tAKARα response to pharmacological manipulations depends on sensor phosphorylation.
a & b, Collective responses of tAKARα (snsr) and its phosphorylation-deficient mutant (mut.) to the indicated drug application in dSPNs (a) and iSPNs (b). From left to right, n (neurons/mice) = 38/6, 54/4, 38/6, and 41/4 for dSPNs, and 63/8, 57/4, 63/8, and 60/4 for iSPNs. Two-tailed unpaired Student’s t-test for both panels, from left to right, p = 1.7×10⁻²¹, 0.029, 6.0×10⁻⁶, and 2.0×10⁻¹²; dF = 90, 77, 118, and 121; t = 12.6, 2.2, 4.7, and −7.8. All error bars represent SEM and their centers represent the mean. *: p ≤ 0.05; ***: p ≤ 0.001.
Extended Data Fig. 3. Supporting data for PKA activity elicited by optogenetic dopamine releases.
a & b, Representative trace (a) and dose-response curve (b) of PKA response in a dSPN elicited by different numbers of trains (1 train/s of 20 Hz 10 × 1.5-ms blue light [470 nm] pulses) of optogenetic stimulation. n (neurons/mice) = 38/5. c, Representative traces of PKA responses to 10 trains of optogenetic stimulation of dopamine release before (top) and after (bottom) intraperitoneal injection of SKF83566 (SKF). Black curve shows a single-exponential fit of the decaying phase of the response. d, The collective τoff of optogenetically-induced PKA responses. To achieve a high signal-to-noise ratio for proper fitting, PKA signals from an entire field of view, which included 3–5 neurons, were integrated. n (FOVs/mice) = 4/3. e, Collective PKA responses to 10 trains of optogenetic stimulation of dopamine release before and after intraperitoneal injection of SKF83566 (SKF). n (neurons/mice) = 14/3. Two-tailed paired Student’s t-test, p = 4.8×10⁻⁵; dF = 13; t = −6.0. f, Collective basal PKA activity responses to the D2R agonist, quinpirole (quin; 1 mg/kg). n (neurons/mice) = 43/4. Two-tailed paired Student’s t-test, p = 1.0×10⁻¹⁰; dF = 42; t = −8.5. All error bars represent SEM and their centers represent the mean. ***: p ≤ 0.001.
Extended Data Fig. 4. Supporting experiments for manipulating PKA activities using drug administration or PKI expression.
a & b, PKA activity responses to Rp-8-Br0cAMPS (Rp) and H89 for dSPNs (a) and iSPNs (b). From left to right, n (neurons/mice) = 27/3 and 22/3 for dSPNs, and 33/4 and 24/4 for iSPNs. Two-tailed paired Student’s t-test, p = 6.9×10⁻¹⁰ and 2.7×10⁻⁵, dF = 26 and 21, t = −9.4 and −5.3 for panel a; and p = 4.0×10⁻⁶ and 6.3×10⁻⁵, dF = 32 and 23, t = −5.5 and −4.9 for panel b. c, Representative images of co-expression of PKI (red) and the PKA sensor tAKARα (green) in the same cells (top), and representative traces of enforced running-induced PKA activity in neurons of the mouse motor cortex without (bottom left) and with (bottom right) PKI expression. n (FOVs/mice) = 19/9 without PKI and 14/4 with PKI. d, Collective enforced running-induced PKA responses in neurons of mice without or with PKI expression. n (neurons/mice) = 124/9 for control and 30/4 for PKI. Boxes indicate 25th and 75th percentile, with black lines indicating median and whiskers indicating 2.7x standard deviation. Two-tailed unpaired Student’s t-test, p = 1.4×10⁻⁷; dF = 152; t = 5.5. e, Representative 3D reconstructions of PKI expression in Drd1a-cre (left) and Adora2a-cre (right) mice. Inj.: injection; proj.: projection; A: anterior; L: lateral; and D: dorsal. f & g, Accelerated rotarod training for mice with PKI or a non-functional PKI mutant (PKImut) expressed in dSPNs (f) or iSPNs (g). n (mice) = 11 for both groups for dSPNs and 10 for both groups for iSPNs. Two-tailed paired Student’s t-test, for first and second days, respectively, dF = 10 and 10, t = −3.3 and −3.2 for dSPNs; and dF = 9 and 9, t = −2.6 and −1.5 for iSPNs. h, Averaged travel velocity of mice with PKI or a non-functional PKI mutant (PKImut) expressed in dSPNs or iSPNs freely moving in an open-field box (37 × 37 cm). From left to right, n (neurons/mice) = 11, 11, 10, and 10. Two-tailed paired Student’s t-test, p = 0.03 and 0.18; dF = 10 and 9; t = 1.2 and −0.6. All error bars represent SEM and their centers represent the mean. n.s.: p > 0.05; *: p ≤ 0.05; **: p ≤ 0.01; ***: p ≤ 0.001.
Extended Data Fig. 5. Additional data for voluntary running-induced PKA activity.
a, Representative single-cell traces of voluntary running-induced PKA response in a dSPN (top) and iSPN (bottom). b, Representative traces of integrated PKA response within an entire FOV elicited by short-duration (<30 s) voluntary running in a dSPN (top) and iSPN (bottom) overlaid with the fit for on- and off-phases (black). The entire FOV was integrated to achieve higher photon count and thereby signal-to-noise ratio, and the imaging rate was every 3 s. c, The kinetic time constant of short-duration voluntary running-induced PKA activity in dSPNs and iSPNs. n = 9 FOVs for dSPNs and 10 for iSPNs. Two-tailed Student’s t-test, from left to right dF = 17 and 17; t = 0.34 and −0.17. All error bars represent SEM and their centers represent the mean. n.s.: p > 0.05.
Extended Data Fig. 6. Additional data for enforced running-induced PKA activity.
a & b, Example trace (inset) and correlation of PKA responses of dSPNs (a) and iSPNs (b) to two consecutive enforced running trials in SPNs. n (neurons/mice) = 50/5 for dSPNs and 68/8 for iSPNs. The p values are from the fit. c, Representative single-cell traces of PKA response in a dSPN (top) and iSPN (bottom) elicited by different durations of enforced running. d, Running duration–PKA response relationship of dSPNs and iSPNs. n (neurons/mice) = 85/7 for dSPNs and 121/9 for iSPNs. e, Representative traces of PKA responses in a dSPN (top) and iSPN (bottom) elicited by a short duration (25s) of enforced running overlaid with the fits (black) for on- and off-phases. The entire FOV was integrated to achieve higher photon count and thereby signal-to-noise ratio, and the imaging rate was every 3 s. f & g, Comparison of the kinetic time constants of PKA responses between short-duration voluntary running and enforced running in dSPNs (f) and iSPNs (g). From left to right, n = 9, 10, 9, and 10 in panel f; and 10, 11, 10, and 11 in panel g. The voluntary running data are the same as those in Extended Data Fig. 4c. Two-tailed unpaired Student’s t-test, from left to right, p = 0.73, 0.87,0.15, and 0.52; dF = 17, 17, 19, and 19; t = 0.35, −0.17, 1.50, and −0.65. All error bars represent SEM and their centers represent the mean. n.s.: p > 0.05.
Extended Data Fig. 7. A2AR antagonist blocks running-induced PKA activity.
a & b, Collective changes of basal (a) and enforced running-induced PKA activity (b) in iSPNs in response to the indicated intraperitoneal injection of two A2A receptor antagonists, istradefylline (istra.) and SCH58261 (SCH). n (neurons/mice) = 63/8, and 49/4 for SCH58261. Two-tailed paired Student’s t-test, from left to right, p = 3.1×10⁻¹⁶, 2.6×10⁻¹¹, 1.2×10⁻¹⁰, and 6.9×10⁻¹²; dF = 62, 48, 62, and 48; t = −11.0, −8.6, −7.7, and −10.3. c, Representative traces of voluntary running-induced PKA response in an iSPN before and after intraperitoneal injection of istradefylline (istra, 2 mg/kg). d, Collective voluntary running-induced PKA activity in iSPNs before and after istradefylline administration. n (neurons/mice) = 46/4. Two-tailed paired Student’s t-test, p = 1.9×10⁻⁷; dF = 45; t = −6.2. e & f, Collective changes of basal (e) and enforced running-induced PKA activity (f) in dSPNs and iSPNs in response to the local infusion of saline (1 µL). n (neurons/mice) = 27/7 for dSPNs and 16/5 for iSPNs. Two-tailed paired Student’s t-test, dF = 26, and 15, t = −0.1 and −1.7 for panel e; dF = 26 and 15 t = −1.3 and 1.4 for panel f. All error bars represent SEM and their centers represent the mean. n.s.: p > 0.05; ***: p ≤ 0.001.
Extended Data Fig. 8. The effect of an A1R antagonist on dSPNs and iSPNs.
a & b, Collective changes of basal and enforced running-induced PKA activity, as indicated, in dSPNs (a) and iSPNs (b) in response to the intraperitoneal injection of the A1 receptor antagonist DPCPX (2 mg/kg). n (neurons/mice) = 55/5 for dSPNs and 118/6 for iSPNs. Two-tailed paired Student’s t-test, from left to right across panels, p = 8.4×10⁻¹¹, 0.0029, 3.9×10⁻⁴, and 0.42; dF = 54, 54, 117, and 117; t = −8.0, −3.1, −3.7, and 0.8. All error bars represent SEM and their centers represent the mean. n.s.: p > 0.05; **: p ≤ 0.01; ***: p ≤ 0.001.
Extended Data Fig. 9. Voluntary running-induced adenosine release.
a, Representative histology section of wildtype mice (n = 9) with an optical fiber implanted and GRABAdo1.0 expressed in neurons (under a synapsin promotor) of the dorsal lateral striatum. b, Example fiber photometric recording traces, aligned to an enforced running bout. c, Average voluntary running-elicited adenosine responses (top) and the corresponding running (bottom) aligned to movement initiations. n (bouts/mice) = 86/5 for GRABAdo1.0 and 34/2 for mutant. d, Average enforced running-induced adenosine release with (black) and without (green) intraperitoneal injection of istradefylline (istra, 2 mg/kg). n (bouts/mice) = 12/6 for both control and istradefylline. e, Collective results of the experiment in panel d. n = 6 mice. Two-tailed paired Student’s t-test, p = 8.6×10⁻⁴; dF = 5; t = 7.1. All error bands represent SEM and their centers represent the mean. ***: p ≤ 0.001.
Supplementary Material
Acknowledgments
We thank Dr. John Williams and all members of the Zhong and Mao labs for critical discussions throughout the project; Dr. Ryohei Yasuda at Max Planck Florida for the FLIMimage software; Dr. Sui Wang at Stanford University for the generation of FLEX-tAKARα AAV; Dr. Gail Mandel at Vollum for providing the rotarod and open-field setup; Dr. Da-Ting Lin at the NIH for providing the Drd1a-Cre mouse; Dr. Yulong Li at Peking University for providing the GRABAdo viruses; Mr. Joshua Melander for early pilot experiments; Mr. Tin Long Yiu for assistance in the behavior hardware; and Drs. John Williams, Marina Wolf, and Bart Jongbloets for critical comments on the manuscript. This work was supported by two BRAIN Initiative awards (National Institute of Health, United States) U01NS094247 (H.Z. and T.M.) and R01NS104944 (H.Z. and T.M.), an R01 grant R01NS081071 (T.M.), and an R21 grant R21NS097856 (H.Z.), with the latter two from the National Institute of Neurological Disorders and Stroke, United States.
Footnotes
Competing Interests
The authors declare no competing interests.
Data Availability
Numerical source data for plots will be provided with this paper. Original raw data will be provided upon request, in order to include all supporting information.
Code Availability
The following custom codes have been made available at GitHub:
SI_View (https://github.com/HZhongLab/SI_View; doi: 10.5281/zenodo.6982316),
FLIMview (https://github.com/HZhongLab/FLIMview; doi: 10.5281/zenodo.6982385),
AnimalStateTracker (https://github.com/HZhongLab/animalStateTracker; doi: 10.5281/zenodo.6984502).
References
- 1.Graybiel AM, Aosaki T, Flaherty AW & Kimura M. The basal ganglia and adaptive motor control. Science (80-. ). 265, (1994). [DOI] [PubMed] [Google Scholar]
- 2.Mink JW. The basal ganglia: Focused selection and inhibition of competing motor programs. Prog. Neurobiol. 50, (1996). [DOI] [PubMed] [Google Scholar]
- 3.Gerfen CR & Surmeier DJ. Modulation of striatal projection systems by dopamine. Annu. Rev. Neurosci. 34, (2011). [DOI] [PMC free article] [PubMed] [Google Scholar]
- 4.Klaus A, Alves Da Silva J & Costa RM. What, If, and When to Move: Basal Ganglia Circuits and Self-Paced Action Initiation. Annual Review of Neuroscience vol. 42 (2019). [DOI] [PubMed] [Google Scholar]
- 5.Gerfen CR et al. D1 and D2 dopamine receptor-regulated gene expression of striatonigral and striatopallidal neurons. Science (80-. ). 250, (1990). [DOI] [PubMed] [Google Scholar]
- 6.Kreitzer AC & Malenka RC. Striatal Plasticity and Basal Ganglia Circuit Function. Neuron vol. 60 (2008). [DOI] [PMC free article] [PubMed] [Google Scholar]
- 7.Tritsch NX & Sabatini BL. Dopaminergic Modulation of Synaptic Transmission in Cortex and Striatum. Neuron vol. 76 (2012). [DOI] [PMC free article] [PubMed] [Google Scholar]
- 8.Kravitz AV et al. Regulation of parkinsonian motor behaviours by optogenetic control of basal ganglia circuitry. Nature 466, (2010). [DOI] [PMC free article] [PubMed] [Google Scholar]
- 9.Yttri EA & Dudman JT. Opponent and bidirectional control of movement velocity in the basal ganglia. Nature 533, (2016). [DOI] [PMC free article] [PubMed] [Google Scholar]
- 10.Redgrave P et al. Goal-directed and habitual control in the basal ganglia: Implications for Parkinson’s disease. Nature Reviews Neuroscience vol. 11 (2010). [DOI] [PMC free article] [PubMed] [Google Scholar]
- 11.DeLong MR & Wichmann T. Circuits and circuit disorders of the basal ganglia. Archives of Neurology vol. 64 (2007). [DOI] [PubMed] [Google Scholar]
- 12.Surmeier DJ, Plotkin J & Shen W. Dopamine and synaptic plasticity in dorsal striatal circuits controlling action selection. Current Opinion in Neurobiology vol. 19 (2009). [DOI] [PMC free article] [PubMed] [Google Scholar]
- 13.Lovinger DM. Neurotransmitter roles in synaptic modulation, plasticity and learning in the dorsal striatum. Neuropharmacology vol. 58 (2010). [DOI] [PMC free article] [PubMed] [Google Scholar]
- 14.Howe MW & Dombeck DA. Rapid signalling in distinct dopaminergic axons during locomotion and reward. Nature 535, (2016). [DOI] [PMC free article] [PubMed] [Google Scholar]
- 15.Nicola SM, James Surmeier D & Malenka RC. Dopaminergic modulation of neuronal excitability in the striatum and nucleus accumbens. Annual Review of Neuroscience vol. 23 (2000). [DOI] [PubMed] [Google Scholar]
- 16.Lahiri AK & Bevan MD. Dopaminergic Transmission Rapidly and Persistently Enhances Excitability of D1 Receptor-Expressing Striatal Projection Neurons. Neuron 106, (2020). [DOI] [PMC free article] [PubMed] [Google Scholar]
- 17.Surmeier DJ, Ding J, Day M, Wang Z & Shen W. D1 and D2 dopamine-receptor modulation of striatal glutamatergic signaling in striatal medium spiny neurons. Trends in Neurosciences vol. 30 (2007). [DOI] [PubMed] [Google Scholar]
- 18.Shen W, Flajolet M, Greengard P & Surmeier DJ. Dichotomous dopaminergic control of striatal synaptic plasticity. Science (80-. ). 321, (2008). [DOI] [PMC free article] [PubMed] [Google Scholar]
- 19.Fink JS et al. Molecular cloning of the rat A2 adenosine receptor: selective co-expression with D2 dopamine receptors in rat striatum. Mol. Brain Res. 14, (1992). [DOI] [PubMed] [Google Scholar]
- 20.Morelli M, Simola N, Popoli P & Carta AR Role of Adenosine in the Basal Ganglia. in Handbook of Behavioral Neuroscience vol. 24 (2016). [Google Scholar]
- 21.Schiffmann SN, Fisone G, Moresco R, Cunha RA & Ferré S. Adenosine A2A receptors and basal ganglia physiology. Progress in Neurobiology vol. 83 (2007). [DOI] [PMC free article] [PubMed] [Google Scholar]
- 22.Higley MJ & Sabatini BL. Competitive regulation of synaptic Ca2+ influx by D2 dopamine and A2A adenosine receptors. Nat. Neurosci. 13, (2010). [DOI] [PMC free article] [PubMed] [Google Scholar]
- 23.Wang Q & Zhou FM. cAMP-producing chemogenetic and adenosine A2a receptor activation inhibits the inwardly rectifying potassium current in striatal projection neurons. Neuropharmacology 148, (2019). [DOI] [PubMed] [Google Scholar]
- 24.Ledent C et al. Aggressiveness, hypoalgesia and high blood pressure in mice lacking the adenosine A(2a) receptor. Nature 388, (1997). [DOI] [PubMed] [Google Scholar]
- 25.Shen HY et al. A critical role of the adenosine A2A receptor in extrastriatal neurons in modulating psychomotor activity as revealed by opposite phenotypes of striatum and forebrain A2A receptor knock-outs. J. Neurosci. 28, (2008). [DOI] [PMC free article] [PubMed] [Google Scholar]
- 26.Yu C, Gupta J, Chen JF & Yin HH. Genetic deletion of A2A adenosine receptors in the striatum selectively impairs habit formation. J. Neurosci. 29, (2009). [DOI] [PMC free article] [PubMed] [Google Scholar]
- 27.Lopes CR, Lourenço VS, Tomé ÂR, Cunha RA & Canas PM. Use of knockout mice to explore CNS effects of adenosine. Biochemical Pharmacology vol. 187 (2021). [DOI] [PubMed] [Google Scholar]
- 28.Fisone G, Borgkvist A & Usiello A. Caffeine as a psychomotor stimulant: Mechanism of action. Cellular and Molecular Life Sciences vol. 61 (2004). [DOI] [PMC free article] [PubMed] [Google Scholar]
- 29.Emson PC, Waldvogel HJ & Faull RLM. Neurotransmitter Receptors in the Basal Ganglia. in Handbook of Behavioral Neuroscience vol. 20 (2010). [Google Scholar]
- 30.Ma L et al. A Highly Sensitive A-Kinase Activity Reporter for Imaging Neuromodulatory Events in Awake Mice. Neuron (2018) doi: 10.1016/j.neuron.2018.07.020. [DOI] [PMC free article] [PubMed] [Google Scholar]
- 31.Yasuda R et al. Supersensitive Ras activation in dendrites and spines revealed by two-photon fluorescence lifetime imaging. Nat. Neurosci. (2006) doi: 10.1038/nn1635. [DOI] [PubMed] [Google Scholar]
- 32.Yellen G & Mongeon R. Quantitative two-photon imaging of fluorescent biosensors. Current Opinion in Chemical Biology vol. 27 24–30 (2015). [DOI] [PMC free article] [PubMed] [Google Scholar]
- 33.Massengill CI, Day-Cooney J, Mao T & Zhong H. Genetically encoded sensors towards imaging cAMP and PKA activity in vivo. Journal of Neuroscience Methods vol. 362 (2021). [DOI] [PMC free article] [PubMed] [Google Scholar]
- 34.Lee SJ et al. Cell-type-specific asynchronous modulation of PKA by dopamine in learning. Nature 1–6 (2020) doi: 10.1038/s41586-020-03050-5. [DOI] [PMC free article] [PubMed] [Google Scholar]
- 35.Zhang SX et al. Hypothalamic dopamine neurons motivate mating through persistent cAMP signalling. Nature 597, (2021). [DOI] [PMC free article] [PubMed] [Google Scholar]
- 36.Goto A et al. Circuit-dependent striatal PKA and ERK signaling underlies rapid behavioral shift in mating reaction of male mice. Proc. Natl. Acad. Sci. U. S. A. 112, (2015). [DOI] [PMC free article] [PubMed] [Google Scholar]
- 37.Grace AA & Bunney BS. The control of firing pattern in nigral dopamine neurons: Single spike firing. J. Neurosci. 4, (1984). [DOI] [PMC free article] [PubMed] [Google Scholar]
- 38.Marinelli M & McCutcheon JE. Heterogeneity of dopamine neuron activity across traits and states. Neuroscience vol. 282 (2014). [DOI] [PMC free article] [PubMed] [Google Scholar]
- 39.Adamantidis AR et al. Optogenetic interrogation of dopaminergic modulation of the multiple phases of reward-seeking behavior. J. Neurosci. 31, (2011). [DOI] [PMC free article] [PubMed] [Google Scholar]
- 40.Da Silva JA, Tecuapetla F, Paixão V & Costa RM. Dopamine neuron activity before action initiation gates and invigorates future movements. Nature 554, (2018). [DOI] [PubMed] [Google Scholar]
- 41.Li W, Ma L, Yang G & Gan WB. REM sleep selectively prunes and maintains new synapses in development and learning. Nat. Neurosci. 20, (2017). [DOI] [PMC free article] [PubMed] [Google Scholar]
- 42.Paukert M et al. Norepinephrine controls astroglial responsiveness to local circuit activity. Neuron 82, (2014). [DOI] [PMC free article] [PubMed] [Google Scholar]
- 43.Peng W et al. Regulation of sleep homeostasis mediator adenosine by basal forebrain glutamatergic neurons. Science (80-. ). 369, (2020). [DOI] [PubMed] [Google Scholar]
- 44.Roberts BM et al. Dopamine Release in Nucleus Accumbens Is under Tonic Inhibition by Adenosine A1 Receptors Regulated by Astrocytic ENT1 and Dysregulated by Ethanol. J. Neurosci. 42, (2022). [DOI] [PMC free article] [PubMed] [Google Scholar]
- 45.Parker JG et al. Diametric neural ensemble dynamics in parkinsonian and dyskinetic states. Nature 557, (2018). [DOI] [PMC free article] [PubMed] [Google Scholar]
- 46.Cui G et al. Concurrent activation of striatal direct and indirect pathways during action initiation. Nature 494, (2013). [DOI] [PMC free article] [PubMed] [Google Scholar]
- 47.Barbera G et al. Spatially Compact Neural Clusters in the Dorsal Striatum Encode Locomotion Relevant Information. Neuron 92, (2016). [DOI] [PMC free article] [PubMed] [Google Scholar]
- 48.Dobbs LKK et al. Dopamine Regulation of Lateral Inhibition between Striatal Neurons Gates the Stimulant Actions of Cocaine. Neuron 90, (2016). [DOI] [PMC free article] [PubMed] [Google Scholar]
- 49.Beaulieu JM & Gainetdinov RR. The physiology, signaling, and pharmacology of dopamine receptors. Pharmacological Reviews vol. 63 (2011). [DOI] [PubMed] [Google Scholar]
- 50.Domenici MR et al. Adenosine A2A receptor as potential therapeutic target in neuropsychiatric disorders. Pharmacological Research vol. 147 (2019). [DOI] [PubMed] [Google Scholar]
Method References
- 51.Pologruto TA, Sabatini BL & Svoboda K ScanImage: Flexible software for operating laser scanning microscopes. Biomed. Eng. Online (2003) doi: 10.1186/1475-925X-2-13. [DOI] [PMC free article] [PubMed] [Google Scholar]
- 52.Levene MJ, Dombeck DA, Kasischke KA, Molloy RP & Webb WW. In Vivo Multiphoton Microscopy of Deep Brain Tissue. J. Neurophysiol. 91, (2004). [DOI] [PubMed] [Google Scholar]
- 53.Jung JC, Mehta AD, Aksay E, Stepnoski R & Schnitzer MJ. In vivo mammalian brain imaging using one- and two-photon fluorescence microendoscopy. J. Neurophysiol. 92, (2004). [DOI] [PMC free article] [PubMed] [Google Scholar]
- 54.Melander JB et al. Distinct in vivo dynamics of excitatory synapses onto cortical pyramidal neurons and parvalbumin-positive interneurons. Cell Rep. 37, 109972 (2021). [DOI] [PMC free article] [PubMed] [Google Scholar]
- 55.Wu Z et al. A sensitive GRAB sensor for detecting extracellular ATP in vitro and in vivo. Neuron 110, (2022). [DOI] [PubMed] [Google Scholar]
References for Extended Data Figures
- 56.Franklin KBJ & Paxinos G The Mouse Brain in Stereotaxic Coordinates (map). Academic Press; (2007). [Google Scholar]
Associated Data
This section collects any data citations, data availability statements, or supplementary materials included in this article.
Supplementary Materials
Data Availability Statement
Numerical source data for plots will be provided with this paper. Original raw data will be provided upon request, in order to include all supporting information.
The following custom codes have been made available at GitHub:
SI_View (https://github.com/HZhongLab/SI_View; doi: 10.5281/zenodo.6982316),
FLIMview (https://github.com/HZhongLab/FLIMview; doi: 10.5281/zenodo.6982385),
AnimalStateTracker (https://github.com/HZhongLab/animalStateTracker; doi: 10.5281/zenodo.6984502).


