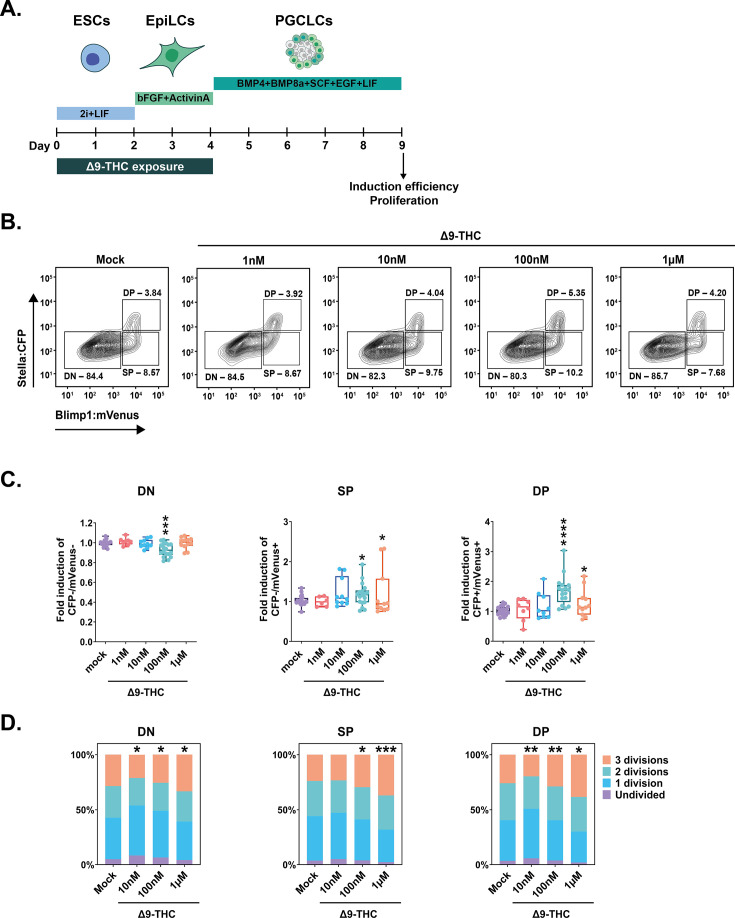
Figure 6. PGCLCs deriving from ESCs and EpiLCs exposed to 100 nM of Δ9-THC proliferate.
(A) Diagram illustrating Δ9-THC exposure scheme and experimental strategy. (B) Representative flow contour plots showing distribution of live-gated events, gating strategy for Stella:CFP versus Blimp1:mVenus and percentages of cells in each subpopulations for ESCs and EpiLCs exposed to the different doses of Δ9-THC indicated. DN: double negative, SP: single positive, DP: double positive subpopulations. (C) The percentage of events in the gates associated to each subpopulation was normalized to the one measured in the mock-treated condition. Median and associated errors were plotted in whisker boxplots independently for each subpopulation. (D) Histograms showing CellTrace Yellow staining profile of cells arising from ESCs and EpiLCs exposed to the different doses of Δ9-THC indicated. The Y-axis represents the average percentage of cells in each category of subpopulations undividing (purple), undergoing 1 division (blue), 2 divisions (green) or 3 divisions (orange). One representative experiment out of three is represented. Statistical significance: *(p<0.05), **(p<0.01), ***(p<0.001), ****(p<0.0001).


