

Abstract
Background:
Paramagnetic rim lesions are associated with chronic inflammation in multiple sclerosis (MS). 7-Tesla (7T) magnetic resonance imaging (MRI) can evaluate the integrity of the blood-brain barrier (BBB) in addition to the tissue myelination status and cell loss.
Purpose:
To use MRI metrics to investigate underlying physiology and clinical importance of paramagnetic rim lesions (PRLs)
Study type:
Prospective
Subjects:
36 participants (mean-age 47, 23 females, 13 males) of mixed MS subtypes
Field strength/sequence:
7T, MP2RAGE, MULTI-ECHO 3D-GRE, FLAIR
Assessment:
lesion heterogeneity; longitudinal changes in lesion counts; comparison of T1, R2*, and χ; association between baseline lesion types and disease progression (2–3 annual MRI visits with additional years of annual clinical follow-up)
Statistical tests:
Two-sample t-test, Wilcoxon Rank-Sum test, Pearson’s chi-square test, two-group comparison with linear-mixed-effect model, mixed-effect ANOVA, logistic regression. p-values<0.05 were considered significant.
Results:
58.3% of participants had at least one PRL at baseline. Higher male proportion in PRL+ group was found. Average change in PRL count was 0.20 (SD=2.82) for PRLs and 0.00 (SD=0.82) for mottled lesions. Mean and median pre-/post-contrast T1 were longer in PRL+ than in PRL−. No differences in mean χ were seen for lesions grouped by PRL (p=0.310, pre-contrast; 0.086, post-contrast) or PRL/M presence (p=0.234, pre-contrast; 0.163, post-contrast). Median χ were less negative in PRL+ and PRL/M+ than in PRL− and PRL/M-. Mean and median pre-/post-contrast R2* were slower in PRL+ compared to PRL−. Mean and median pre-/post-contrast R2* were slower in PRL/M+ than in PRL/M-. PRL presence at baseline was associated with confirmed EDSS Plus progression (OR 3.75 (1.22–7.59)) and PRL/M+ at baseline with confirmed EDSS Plus progression (OR 3.63 (1.14–7.43)).
Data conclusion:
Evidence of BBB breakdown in PRLs was not seen. Quantitative metrics confirmed prior results suggesting greater demyelination, cell loss, and possibly disruption of tissue anisotropy in PRLs.
Keywords: Paramagnetic rim lesion, Multiple Sclerosis, Ultra-high field MRI, disease progression
Introduction
Chronic-active lesions (CALs) in persons with multiple sclerosis (MS) may be visualized on MRI as white matter lesions (WMLs) with paramagnetic rims, often termed paramagnetic rim lesions (PRLs)(1). Histopathology suggests that enzymatic activity caused by infiltration of inflammatory cells into acutely inflamed lesions leads to a transient increase in iron content, as well as release of intracellular stores from injured oligodendrocytes and myelin sheaths, which are taken up by pro-inflammatory macrophages(2). In acutely inflamed lesions, this process is transitory and resolves as the inflammatory cascade recedes. However, in CALs, iron-laden macrophages persist along with pro-inflammatory microglia, and their migration to the outer edge of a lesion along with the loss of central core oligodendrocytes results in decreases in the iron content of the central core of WMLs, and an outwardly expanding iron-rich inflammatory rim(2,3). Given the paramagnetic effects of iron, post-processing of gradient-recall echo (GRE)-based sequences into R2* maps, unwrapped/filtered phase images, or quantitative susceptibility maps (QSM) may reveal this lesion subtype as a PRL(1). Recent imaging literature suggests that PRLs are found in higher proportions in patients with progressive MS phenotypes, chronic disability accumulation, and outward expansion of lesion boundaries – all suggesting that this is a more destructive MS lesion subtype(4,5).
Analysis of relaxometry measurements from multi-parametric MRI can be used to probe the extent of underlying demyelination and tissue destruction in WMLs in MS(6). Previous work suggests that PRLs show alterations in R2* and QSM consistent with more extensive demyelination and cell loss than lesions without paramagnetic rims(1,4,7). T1 maps derived from magnetization prepared 2 rapid acquisition gradient echo (MP2RAGE) images could be utilized for the same purpose, and prior data suggests the ability to differentiate fully from partially demyelinated lesions(8). Prior data also suggests prolongation of T1 relaxation times in PRLs compared to those without, consistent with more demyelination and cell loss(5).
The increased ability to obtain higher resolution images, improvements in signal-to-noise ratio, and enhanced susceptibility effects seen on ultra-high field, 7 Tesla (7 T) MRI may provide an opportunity to probe the activity of the innate immune system in MS lesions. Application of the relaxometry measurements described above to images acquired at 7 T may more precisely describe differential impacts on demyelination and cell loss in CALs versus those without chronic-active innate immune system activation. Further, we have previously demonstrated that contrast-enhanced 7 T MP2RAGE acquisitions can quantify blood-brain-barrier (BBB) breakdown in MS lesions through the use of T1 maps(9). A similar concept of pre- and post-contrast relaxometry comparison can also be performed using GRE-based metrics(10).
This study aimed to utilize multi-parametricl relaxometry measurements from 7 T MRI to evaluate the differences in myelination, cell loss, and BBB breakdown in PRLs and WMLs without evidence of chronic-active inflammation.
Methods
Participants
This study was a prospective, observational cohort analysis with data collected between September 2014 and May 2018 and overseen by the institutional review boards of The University of Maryland, Baltimore and Johns Hopkins University. Clinical data collected in other studies at the University of Maryland, Baltimore after 2018 were also utilized for longitudinal disability evaluations. Participants with diagnoses of relapsing-remitting MS (RRMS), secondary progressive MS (SPMS), and progressive MS (PPMS) according to revised McDonald Criteria were recruited from the University of Maryland Center for Multiple Sclerosis Treatment and Research and each signed an informed consent document(11). Participants were required to be between ages 18 and 65 and have a baseline EDSS score ≤ 6.5. Annual study visits included 7 T brain MRI before and after contrast agent administration, and clinical evaluation. Two or three MRI scans, including the baseline scan were used in the current study. All data was collected with an approximately 1-year interval between visits. Quantitative MRI and clinical measurements were collected at all visits.
MRI acquisitions
Participants underwent MRI of the whole brain on a 7 T MRI scanner (Philips, Achieva, The Netherlands) with a volume transmit head coil and a 32-channel receiver coil (Nova Medical Inc.). The MP2RAGE sequence used the following parameters: MP2RAGE repetition time (TR) = 8500 ms, TR = 6.9 ms, echo-time (TE) = 2.1 ms, inversion times (TIs) = 1000/3000 ms, flip-angles = 5/5 degrees, turbo factor = 252, field-of-view (FOV) = 220×200 mm2, voxel dimensions = 0.7×0.688×0.688 mm3, SENSitivity Encoding (SENSE) factor = 2×2, total acquisition time = 9 min 46 sec. Acquisitions were obtained before contrast and then initiated approximately 10 minutes after intravenous gadolinium-based contrast agent (0.1 mmol/kg) administration. A 3D multi-echo gradient recalled echo (GRE) sequence was acquired with the following parameters: TR = 28.87 ms, five bipolar echoes with first echo at 5 ms and with echo-interval of 5 ms, flip-angle = 10 degrees, FOV = 224×224×133 mm3, voxel dimensions = 0.7×0.7×0.7 mm3, acquisition time = 8 min 23 sec. FLuid Attenuated Inversion Recovery (FLAIR) image acquisition used the following sequence parameters: TR = 8000 ms, TE = 400 ms, TI = 2077 ms, flip-angle = 90 degrees, SENSE factor = 2×3, voxel dimensions = 0.688×0.688×0.700 mm3, acquisition time = 10 min 48 sec.
Image processing
MP2RAGE images were processed to create a T1-weighted (T1-w) image and a T1 map(12). A denoised T1-w image was also created by multiplying the second inversion-time image in the MP2RAGE acquisition after N4 inhomogeneity correction available in ANTs (https://github.com/ANTsX/ANTs) and the corresponding T1-w image(13). As previously described, ΔT1 maps were created by subtracting pre- and post-contrast T1 maps(9).
QSM and R2* maps were created using the JHU/KKI QSM Toolbox v3.0 (http://godzilla.kennedykrieger.org/QSM/) written in MATLAB (Ver. R2015a, MathWorks, Natick, MA). R2* maps were calculated using the Auto-Regression on Linear Operations (ARLO) algorithm with GRE magnitude images of all odd echoes, i.e., 1st, 3rd and 5th echoes, with same echo polarity. GRE phase images of the 3rd and 5th echoes underwent phase pre-processing and were averaged to generate the final frequency and susceptibility maps. Phase data with echo time < 10 ms were excluded to avoid non-linear temporal phase evolution in the WM at ultra-high field(14). QSM dipole inversion was performed using a modified SFCR method with automated referencing to ventricle CSF region (with R2* less than 5 Hz, and magnetic susceptibility (χ) set as 0) in a similar manner as MEDI+0(15,16). The QSM measures are thus reported as relative magnetic susceptibility. QSM and R2* maps were both calculated in native (GRE) space and later co-registered to MP2RAGE space. The N4-corrected GRE magnitude image of the 1st echo was coregistered to the N4-corrected 2nd-inversion image of the MP2RAGE using ANTs with affine transformation. The saved transformation matrix was then used to coregister the QSM and R2* map to MP2RAGE space. Δχ and ΔR2* maps were created by subtracting pre- and post-contrast QSM and R2* maps respectively.
Image analysis
Lesion analysis was performed manually using semi-automated region growing paint tools in MIPAV, as previously described(17,18). White matter lesions (WMLs) were identified as regions of hyperintensity with distinct borders on T1 map images and were in-painted. All WMLs identified on T1 maps were reviewed for their visual appearance on co-registered QSM. Lesions were categorized by two observers (DMH: 11 years of experience, SL: no prior experience, trained and supervised by DMH) as a PRL if the core of the lesion was isointense (compared to surrounding white matter) to slightly hyperintense, surrounded by a hyperintense (compared to surrounding white matter) rim that was continuous throughout > 50% of the circumference of the lesion on two image slices or on two planes of view. If a lesion had such an appearance, but the rim was discontinuous or the outer edge or interior of the lesion was noted to have scattered or nodular appearing hyperintensities, then it was categorized “mottled”. During lesion type classification, careful attention was paid to the presence of blood vessels as seen on magnitude GRE and QSM within or at the edge of lesions to avoid false positive classification as PRL or mottled. Any lesions identified as PRL (PRL+) or mottled (M+) on QSM were in-painted again with a new corresponding label based on their borders/boundaries on the T1 map. Image algebra was then performed to derive classification specific masks. ‘PRL−’ indicates WML without PRL and its mask was achieved by subtracting WML and PRL+ masks. ‘PRL/M+’ indicates lesions that are PRL+ or M+ and its mask was achieved by adding PRL+ and M+. ‘PRL/M-’ indicates lesions that are PRL− and M−, and its mask was achieved by subtracting the masks of PRL+ and M+ from the WML mask. Masks were used to calculate volumes, T1, R2* and χ values for further analysis. Lesions ≥ 0.00298 mL in volume were counted using the ‘LabelClusterUniquely’ available in ANTs and ‘fslstats’ in FSL (https://fsl.fmrib.ox.ac.uk/fsl/fslwiki/).
Disability progression evaluation
Disability levels were assessed at each annual study visit using the Expanded Disability Status Scale (EDSS), timed 25-foot walk (T25W), 9 hole peg test (9HPT), Symbol Digit Modalities Test (SDMT), and low contrast visual acuity (LCVA, using 2.5% contrast charts). Progression of disability during longitudinal follow up was categorized by definitions of progression in the EDSS and a multi-component composite disability previously described by the Multiple Sclerosis Outcomes Assessment Consortium(19). The progression in “EDSS-plus,” (composite of progression in EDSS or 9HPT or T25W) was evaluated using definitions previously described(20). If a participant met criteria for progression in a particular metric, and that progression was sustained on subsequent visits, then the participant qualified as having progressed. If the subject met criteria for progression only at their last visit (thus no confirmation available), they were categorized “unconfirmed progression.” The separate category of unconfirmed progression was included in the event that the lack of additional ad hoc disability confirmation visits in this study protocol reduced sensitivity to progression compared to that seen in clinical trials of therapeutics. Disability data from annual study visits subsequent to the cut-off of MRI data for analysis was utilized to allow for long-term disability data evaluations.
Statistical analysis
Clinical characteristics were compared between groups via t-tests or Wilcoxon Rank-Sum, as appropriate. Pearson’s chi-square test was used for comparisons of proportions, with Yate’s correction for continuity(21).
All scan data (including all visits for each subject) were used for quantitative MRI metric analyses. We assessed the differences in T1, χ, and R2* metrics between lesion types categorized as PRL+ and PRL− or PRL/M+ and PRL/M− using a linear-mixed model regression, which accounted for random variability in the number of visits. Using a mixed-effect ANOVA model, we further compared MRI metrics for three categories of lesions: PRL+, M+, and neither PRL nor mottled (PRL/M-).
Logistic regression was performed to evaluate binary disease progression status as a function of lesion type after accounting for age, sex, disease duration and disease subtype (Table 3).
Table 3.
Associations between progression measures and lesion types on first scan.
| Estimate | EDSS progression (CI) | Unconfirmed EDSS progression (CI) | EDSS plus progression (CI) | Unconfirmed EDSS plus progression (CI) | Composite progression (CI) | Unconfirmed composite progression (CI) |
|---|---|---|---|---|---|---|
|
| ||||||
| PRL+ on first scan | 2.95 (0.22, 7.33) p = 0.080 | 2.08 (−0.09, 4.93) p = 0.091 | 3.75 (1.22, 7.59) p = 0.0154* | 5.37 (2.15, 10.6) p = 0.0097** | 0.85 (−0.92, 2.79) p = 0.358 | 2.38 (−0.31, 7.52) p = 0.156 |
|
| ||||||
| PRL/M+ on first scan | 1.93 (−0.31, 5.11) p = 0.129 | 1.29 (−0.60, 3.50) p = 0.203 | 3.63 (1.14, 7.43) p = 0.017* | 3.23 (1.05, 6.25) p = 0.012* | 0.72 (−1.02, 2.59) p = 0.424 | 2.66 (0.035, 7.78) p = 0.110 |
Associations between disability progression and the presence of a PRL+ or PRL/M+ lesion on the first scan as evaluated by multiple logistic regression to account for age, sex, disease duration, and disease subtype. Estimates reported are exponentiations of the calculated odds ratios. Significance noted using “** 0.01, *0.05”; CI: confidence interval
All statistical analyses were performed using R software language (Ver. R 4.2.1, R Core Team (2022)). p-values < 0.05 were considered statistically significant. Cohen’s d, z-score divided by the square root of sample size, Cramer’s V, and eta squared (η2) were used to calculate effect sizes.
Results
Descriptive
Demographic information of the study cohort is provided in Table 1. Twenty-five participants had RRMS (aged 37–53, 17 females), five had SPMS (aged 44–55, all females), and six had PPMS (aged 41–56, 1 female). Mean disease duration of the cohort was 11.6 years (SD = 9.1). Most subjects (72.2%) were on disease modifying treatment. Participants had between 1 and 3 annual MRIs in follow up, with the majority having 3 (58.3%). The median time of clinical follow up in the cohort was 2.1 (0.9 – 6.6) years. Examples of the anatomic images acquired and quantitative maps are shown in Figure 1 and examples of lesion types seen on QSM are shown in Figure 2. Twenty-one (58.3%) participants had at least one PRL in their baseline scan. Comparisons in demographic and clinical characteristics at baseline revealed no significant differences except for a significantly higher proportion of male participants in the PRL+ group. Although the T25FW, 9HPT, SDMT, and LCVA scores trended towards greater levels of disability in the PRL+ group, none of these differences were significant. 21 participants had PRL on their first scan, while 8 had mottled lesions. Of the participants, 14 had no PRL or mottled lesions, 14 had PRL only, 1 had mottled lesions only, and 7 had both PRL and mottled lesions. WMLs with no rim or mottled appearance ranged from 7 to 275 with a mean of 67.55. PRL ranged from 0 to 33 with the average count of 2.81. Mottled lesion ranged from 0 to 2 with the average count of 0.28. The average change in the number of lesions from the first to the last scan was 0.20 (SD=2.82) for PRL and 0.00 (SD=0.82) for mottled lesions.
Table 1.
Clinical Characteristics of participants (n = 36).
| Characteristic | All Participants (n = 36) | PRL+ on first scan (n = 21) | PRL − on first scan (n = 15) | p-value (effect size) |
|---|---|---|---|---|
|
| ||||
| Age (SD) | 46.7 (10.1) | 45.0 (9.7) | 49.0 (10.1) | 0.246 (0.399) |
| Sex (%) | ||||
| Female | 23 (63.9%) | 10 (47.6%) | 13 (86.7%) | |
| Male | 13 (36.1%) | 11 (52.4%) | 2 (13.3%) | 0.040X* (0.369) |
| Disease subtype (%) | ||||
| Relapsing remitting | 25 (69.4%) | 15 (71.4%) | 10 (66.7%) | |
| Secondary progressive | 5 (13.9%) | 3 (14.3%) | 2 (13.3%) | |
| Primary progressive | 6 (16.7%) | 3 (14.3%) | 3 (20.0%) | 0.902X (0.000) |
| MS treatment (%) | ||||
| no | 10 (27. 8%) | 6 (28.6%) | 4 (26. 7%) | |
| yes | 26 (72. 2%) | 15 (71.4%) | 11 (73.3%) | 1.000X (0.000) |
| MS treatment drug (%) | ||||
| none | 9 (25.0%) | 6 (28.6%) | 4 (26. 7%) | |
| interferon beta | 3 (8.3%) | 1 (4.8%) | 2 (13.3%) | |
| glatiramer acetate | 6 (16. 7%) | 4 (19.1%) | 2 (13.3%) | |
| natalizumab | 2 (5.6%) | 0 (0.0%) | 2 (13.3%) | |
| teriflunomide | 1 (2. 8%) | 0 (0.0%) | 1 (6. 7%) | |
| fingolimod | 4 (11.1%) | 1 (4.8%) | 3 (20.0%) | |
| dimethyl fumarate | 11 (30. 6%) | 9 (42.9%) | 1 (6. 7%) | 0.085X (0.376) |
| Disease Duration (SD) | ||||
| Mean – years (SD) | 11. 6 (9.1) | 11.8 (9.9) | 11.7 (7.7) | 0.993 (0.003) |
| Baseline disability | ||||
| Median EDSS (Range) | 3.0 (1.0–6.5) | 3.0 (1.5–6.5) | 3.0 (1.0–6.0) | 0.909°(0.022) |
| Mean T25FW (SD) | 9.4 (14.9) | 11.6 (19.2) | 6.4 (2.9) | 0.312 (0.354) |
| Mean 9HPT (SD) | 41.9 (65.1) | 53.0 (83.2) | 29.9 (16.1) | 0.302 (0.369) |
| Mean SDMT (SD) | 52.3 (12.2) | 49.8 (10.0) | 55.9 (14.3) | 0.143 (0.507) |
| Mean LCVA (SD) | 15.6 (15.4) | 26.7 (10.2) | 24.5 (10.8) | 0.535 (0.243) |
| Number of scans (%) | ||||
| 2 | 15 (41.7%) | 10 (47.6%) | 5 (33.3%) | |
| 3 | 21 (58.3%) | 11 (52.4%) | 10 (66. 7%) | 0.607X (0.000) |
| Median time of clinical follow up in years (Range) | 2.1 (0.9 – 6.6) | 2.1 (1.0 – 6.6) | 2.1 (0.9 – 5.9) | 0.737° (0.034) |
Two-sample t-test was used to compare clinical metrics except as noted by superscripts.
Wilcoxon Rank Sum Test
Pearson’s Chi-squared test with Yates’ continuity correction
Significance noted using “*** 0.001, ** 0.01, *0.05”
Note: MRI data was collected either twice or three times, including the baseline measurement, with an approximately 1-year interval between visits. Quantitative MRI and clinical measurements were collected at all visits. Clinical follow-up measurements, which were used to evaluate the disease progression, were collected for more than three visits at the time of analysis.
Figure 1:
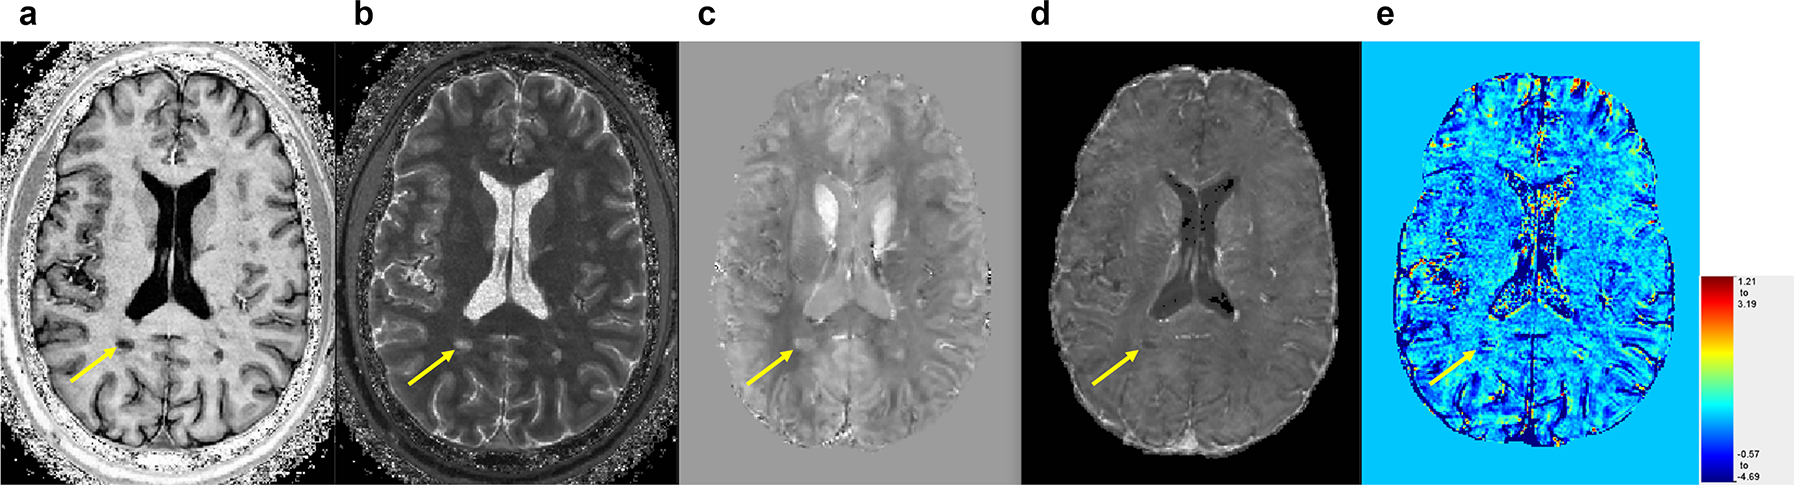
Paramagnetic rim lesion (PRL, yellow arrow) seen on the various contrasts used in this study. (a) T1-w from MP2RAGE, (b) T1 map from MP2RAGE, (c) Quantitative susceptibility map (QSM), (d) R2* map, (e) ΔT1 map (color scale in seconds).
Figure 2:
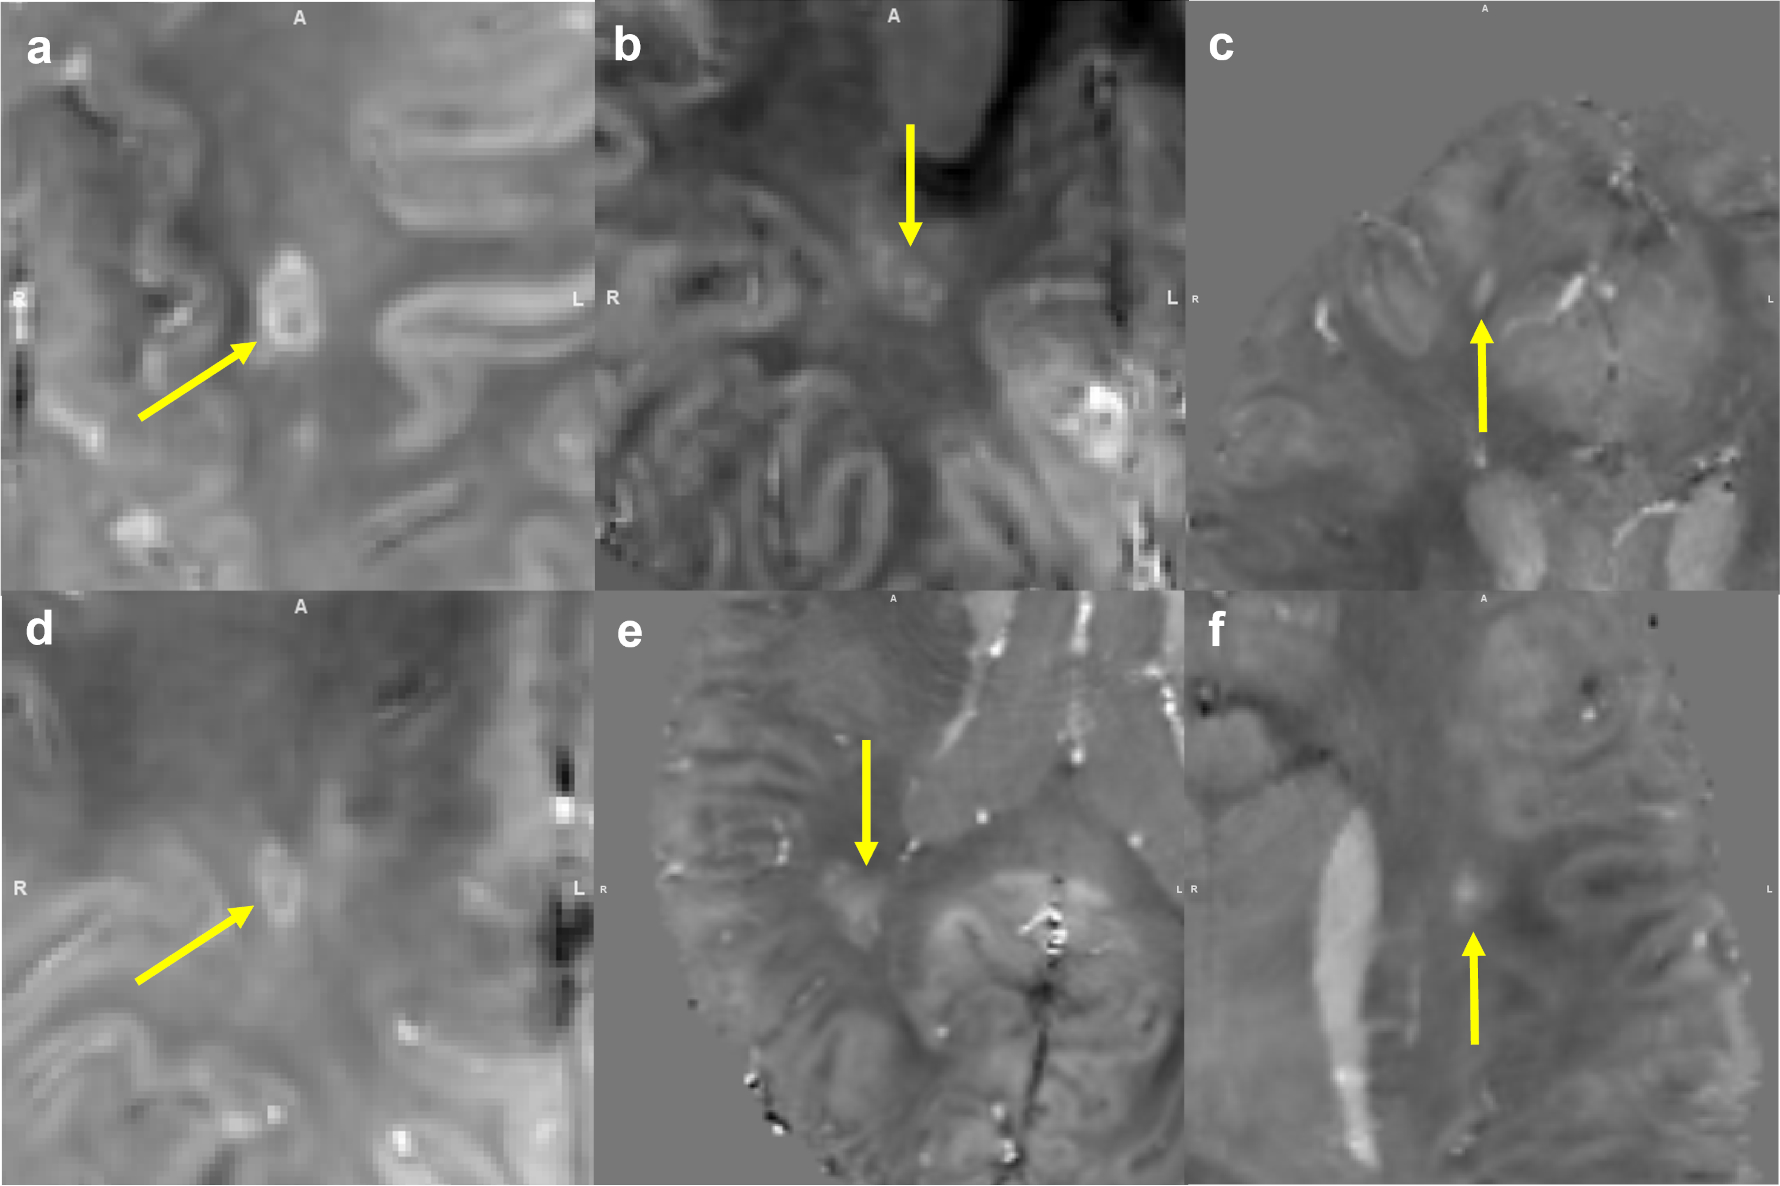
Examples of paramagnetic rim lesion (PRL+) (a, d), mottled (M+) (b, e), non-PRL/M lesions (c, f) on QSM.
Comparison of quantitative MRI metrics between lesion types
T1 relaxation time
Mean and median pre- and post-contrast T1 relaxation times were significantly longer in PRL+ lesions than in PRL− lesions (Figure 3 A, D, S-Table 1). However, there was no significant difference in mean and median ΔT1 between PRL+ and PRL− lesions (S-Table 1). Mean and median T1 relaxation times were also significantly longer in PRL/M+ than in PRL/M− lesions (Figure 4 A, D, S-Table 2). In this grouping, while mean ΔT1 values were found to be not significantly different, median ΔT1 relaxation time was shorter (S-Table 2). ANOVA comparing across all 3 lesion types showed a significant difference, with T1 relaxation time being longest in PRL+, followed by M+, and shortest in PRL/M− lesions (Table 2).
Figure 3:
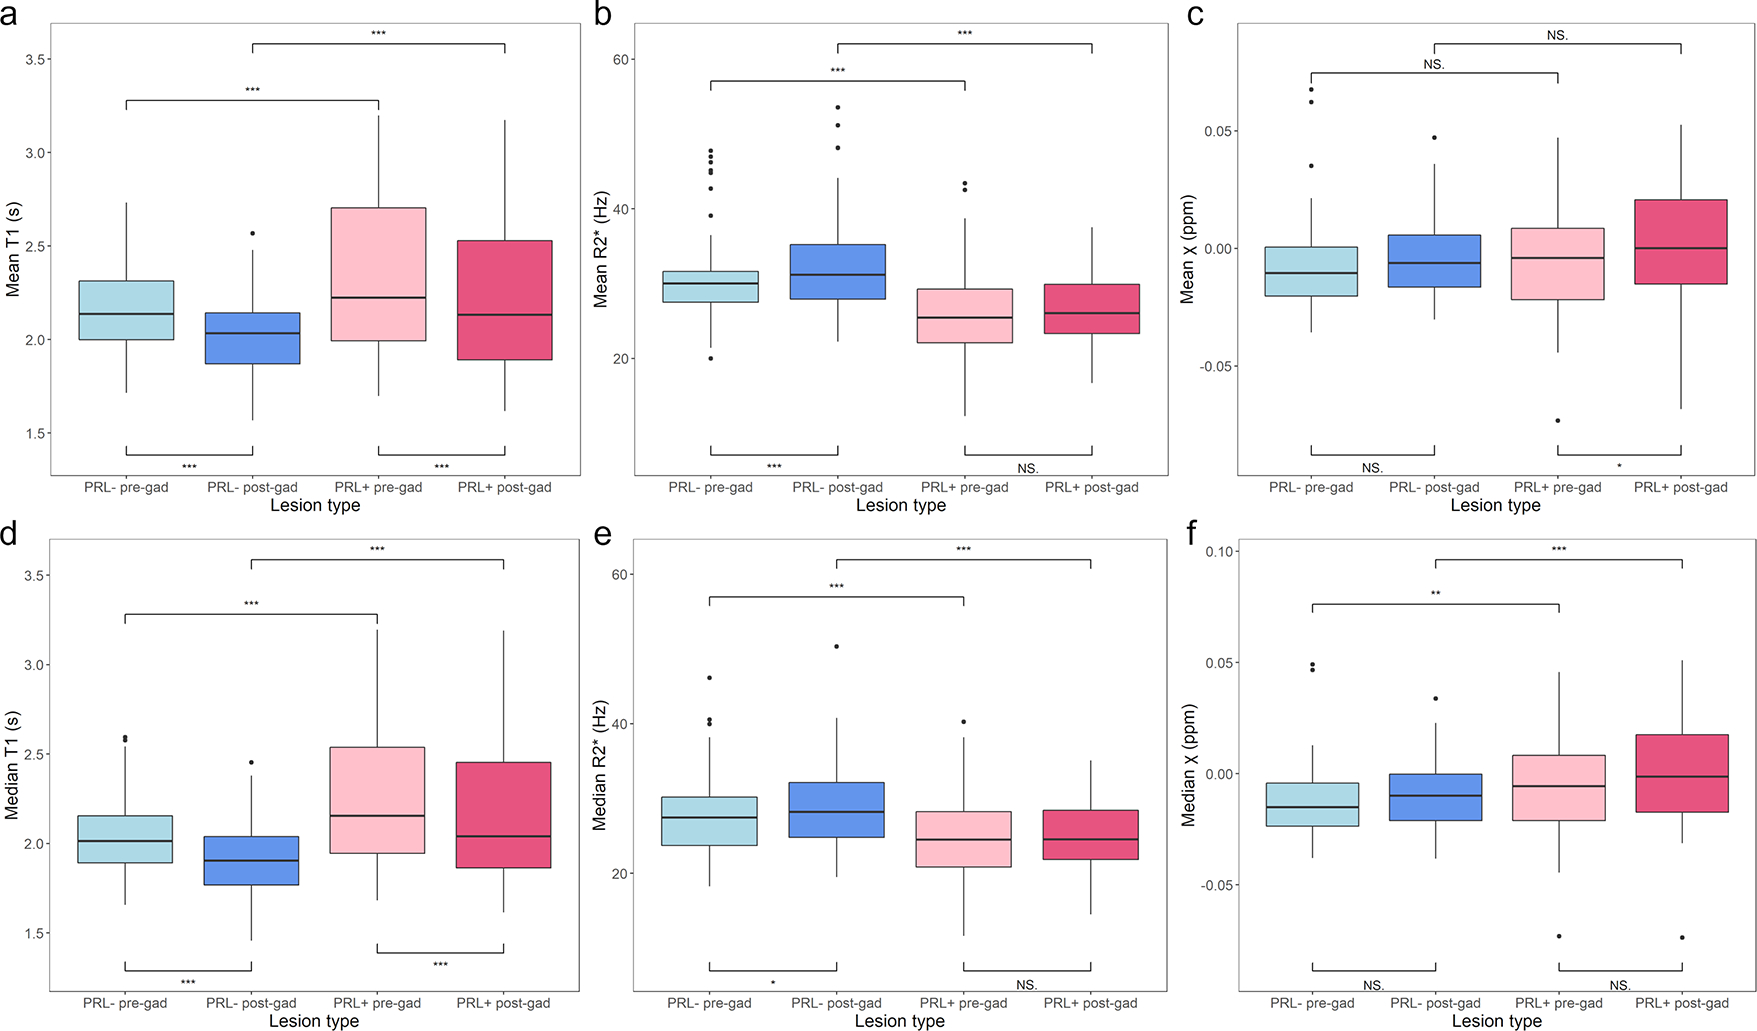
Mean and median values of T1 measures, R2* measures, and magnetic susceptibility (χ) measures for PRL + vs. PRL −: Both PRL+ and PRL− lesions show significant reduction in mean and median post-contrast T1 values (a, d). PRL−, not PRL+, lesions show significant increase in mean and median post-contrast R2* values (b, e). Neither PRL+ nor PRL− show significant changes in χ (c, f). Significance noted using “*** 0.001, ** 0.01, *0.05”
Figure 4:
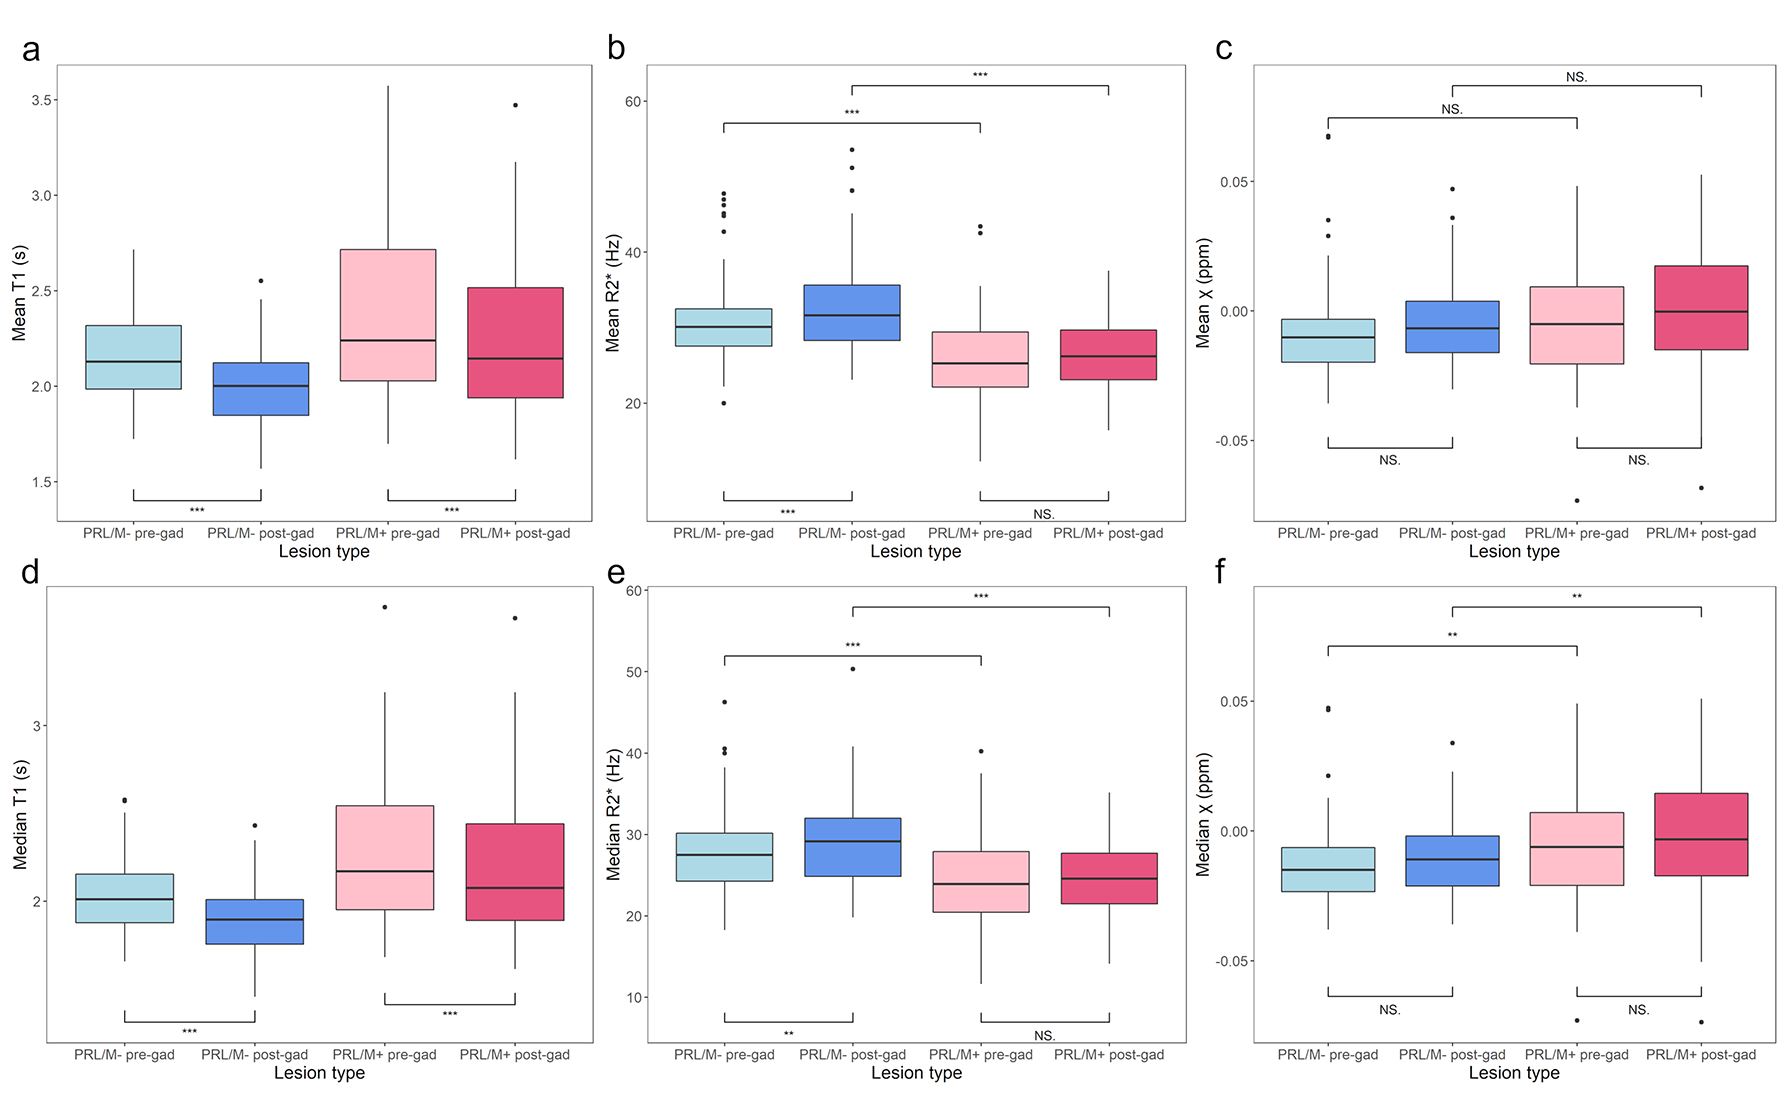
Mean and median values of T1 measures, R2* measures, and magnetic susceptibility (χ) measures for PRL/M+ vs. PRL/M−: Both PRL/M+ and PRL/M− lesions show significant reduction in mean and median post-contrast T1values (a, d). PRL/M−, not PRL/M+, lesions show significant increase in mean and median post-contrast R2* values (b, e). Neither PRL/M+ nor PRL/M− show significant changes in χ (c, f). Significance noted using “*** 0.001, ** 0.01, *0.05”
Table 2.
Results of mixed-effect ANOVA analysis of mean and median T1, χ, and R2* values of PRL+, mottled, and PRL/M− lesions.
| Measurement | PRL/M− | PRL+ | Mottled (M+) | p-value (effect size) |
|---|---|---|---|---|
|
| ||||
| Mean pre-contrast T1 | 2.15 (1.97, 2.32) | 2.36 (2.19, 2.54) | 2.30 (2.11, 2.49) | < 0.001 *** (0.197) |
| Mean post-contrast T1 | 1.99 (1.84, 2.14) | 2.23 (2.08, 2.38) | 2.14 (1.97, 2.31) | < 0.001 *** (0.239) |
| Mean ΔT1 | −0.16 (−0.19, −0.12) | −0.13 (−0.17, −0.09) | −0.16 (−0.21, −0.11) | 0.210 (0.026) |
|
| ||||
| Median pre-contrast T1 | 2.02 (1.87, 2.18) | 2.29 (2.13, 2.45) | 2.26 (2.08, 2.43) | < 0.001 *** (0.287) |
| Median post-contrast T1 | 1.89 (1.74, 2.05) | 2.19 (2.03, 2.34) | 2.11 (1.94, 2.29) | < 0.001 *** (0.320) |
| Median ΔT1 | −0.15 (−0.18, −0.11) | −0.13 (−0.16, −0.09) | −0.15 (−0.19, −0.11) | 0.189 (0.028) |
|
| ||||
| Mean pre-contrast χ | −9.47×10⁻³ (−19.9×10⁻³, 0.908×10⁻³) | −7.88×10⁻³ (−19.5×10⁻³, 3.74×10⁻³) | −7.88×10⁻³ (−19.5×10⁻³, 3.74×10⁻³) | 0.464 (0.014) |
| Mean post-contrast χ | −5.86×10⁻³ (−12.5×10⁻³, 0.805×10⁻³) | −0.715×10⁻³ (−7.50×10⁻³, 6.07×10⁻³) | −10.1×10⁻³ (−19.0×10⁻³, −1.16×10⁻³) | 0.048 * (0.051) |
| Mean Δχ | 3.63×10⁻³ (−4.89×10⁻³, 1.22×10⁻³) | 5.10×10⁻³ (−3.43×10⁻³, 1.36×10⁻³) | −2.13×10⁻³ (−11.3×10⁻³, 7.03×10⁻³) | 0.073 (0.045) |
|
| ||||
| Median pre-contrast χ | −14.6×10⁻³ (−2.50×10⁻³, −4.15×10⁻³) | −6.71×10⁻³ (−17.2×10⁻³, 3.75×10⁻³) | −9.74×10⁻³ (−21.1×10⁻³, 1.58×10⁻³) | 0.015 * (0.073) |
| Median post-contrast χ | −1.20×10⁻³ (−18.5×10⁻³, −5.39×10⁻³) | −2.26×10⁻³ (−8.94×10⁻³, 4.43×10⁻³) | −1.17×10⁻² (−20.4×10⁻³, −3.04×10⁻³) | 0.001 ** (0.112) |
| Median Δχ | 2.69×10⁻³ (−5.88×10⁻³, 11.3×10⁻³) | 4.41×10⁻³ (−4.17×10⁻³, 13.0×10⁻³) | −1.71×10⁻³ (−11.0×10⁻³, 7.56×10⁻³) | 0.169 (0.030) |
|
| ||||
| Mean pre-contrast R2* | 30.42 (26.86, 33.98) | 25.55 (21.99, 29.10) | 24.87 (21.18, 28.57) | < 0.001 *** (0.258) |
| Mean post-contrast R2* | 32.79 (30.67, 34.91) | 26.41 (24.26, 28.56) | 27.96 (25.29, 30.63) | < 0.001 *** (0.393) |
| Mean ΔR2* | 2.42 (−1.76, 6.60) | 0.88 (−3.26, 5.01) | 3.34 (−0.41, 7.10) | 0.023 * (0.060) |
|
| ||||
| Median pre-contrast R2* | 27.48 (23.93, 31.04) | 24.05 (20.50, 27.59) | 23.42 (19.83, 27.00) | < 0.001 *** (0.175) |
| Median post-contrast R2* | 29.08 (27.19, 30.97) | 24.82 (22.90, 26.73) | 25.98 (23.62, 28.34) | < 0.001 *** (0.276) |
| Median ΔR2* | 1.83 (−2.36, 6.02) | 0.70 (−3.45, 4.84) | 2.90 (−0.84, 6.64) | 0.582 (0.046) |
Three-group comparison of mean and median values of MRI metrics using a mixed-effect ANOVA model. Significance noted using “*** 0.001, ** 0.01, *0.05”
Numbers are given in ‘median (min, max)’ of mean or median of measurements.
Units for T1: sec., units for χ: ppm, and units for R2*: Hz.
Magnetic susceptibility
No significant differences in mean χ was seen for lesions grouped by PRL or PRL/M presence (Figures 3C, 3C, S-Tables 1, 2). However, median χ values were less negative in PRL+ and PRL/M+ lesions; Figures 3F, 4F, S-Tables 1, 2). Mean and median Δχ values showed no significant differences between lesion types. Comparison of all 3 lesion types showed a significant difference only for median χ, with M+ being the least negative, followed by PRL+, and PRL/M− with the most negative values (Table 2).
R2* relaxation rate
Mean and median pre- and post-contrast R2* relaxation rates were significantly slower in PRL+ lesions compared to PRL− lesions (Figure 3B, E, S-Table 1). Similarly, both mean and median pre- and post-contrast R2* were significantly slower in PRL/M+ lesions (Figure 4B, E, S-Table 2) Mean ΔR2* was smaller in PRL+ and PRL/M+ lesions while the differences in median ΔR2* was not significant (S-Tables 1, 2). ANOVA comparing across all 3 lesion types showed significant differences, with R2* relaxation rates being shortest in M+ lesions, followed by PRL+ lesions, and longest in PRL/M− lesions (Table 2).
Disability Progression results
Results of disability progression analyses are summarized in Table 3. The presence of a PRL or PRL or mottled lesion on the first scan did not predict EDSS or Composite disability progression. However, the presence of a PRL at baseline was associated with confirmed EDSS Plus progression (Odds Ratio (OR) 3.75 (1.22 – 7.59, p = 0.016)) and PRL/M+ at baseline was associated with confirmed EDSS Plus progression (OR 3.63 (1.14 – 7.43)). Similar findings were seen for unconfirmed EDSS Plus progression.
Discussion
This study contributes to the growing literature demonstrating that multi-parametric MRI methodologies can be used to both distinguish between histopathologic subtypes of MS lesions and further probe their physiologic properties and clinical importance. The ability to use QSM to visualize and quantify both PRLs and lesions with mottled susceptibility signal, and to separate those lesion types from other WMLs both in terms of visual appearance and characteristics on other quantitative MRI metrics, is described. Similar to our prior work, PRLs were found to be the minority of lesions, more common in men, and accumulated slowly over time (4,22). Like other prior work, the presence of PRLs was clinically significant and associated with long-term disability outcomes (5,23). Metrics such as T1 relaxation times, R2* relaxation rates, and relative susceptibility (χ) were significantly altered within PRLs when compared to other WMLs. Further, administration of gadolinium and measurement of these metrics before and after provided additional information that may help elucidate the underlying physiology of PRLs and how they do or do not differ from other WMLs.
T1 relaxation times in PRL indicate severe demyelination and cell loss
The prolongation of T1 relaxation time in PRLs compared to non-PRL WMLs seen in this study is consistent with prior descriptions(5,8). There are various explanations for this, as T1 relaxation time is influenced by many underlying physiologic and pathologic processes. Prolonged T1 relaxation time (seen on T1-weighted images as greater hypointensity, or “black holes”) is associated with reductions the cell content of tissues, and thus may be indicative of greater glial or neuronal cell loss within in PRLs(24,25). This would be consistent with histopathologic data showing that lesions with iron rims have greater oligodendrocyte cell loss in the lesion core(26). Recent data also suggests that T1 maps derived from MP2RAGE differentiate lesions that are demyelinated, remyelinated, or mixed demyelinated/remyelinated, with the longest T1 relaxation times being seen in those that are fully demyelinated with no remyelination(8). Thus, it is possible that the T1 prolongation seen in PRLs in this study is indicative of a lack of remyelination in this lesion subtype(3). Increased water content due to progressed demyelination and decreased remyelination can prolong T1 relaxation time. It is most likely that the underlying cause of T1 prolongation in PRLs is multi-factorial, but all these factors suggest that PRLs represent a more severe form of WML pathology in MS.
Lack of evidence of BBB breakdown in PRLs by ΔT1 mapping
Evidence of BBB breakdown in non-enhancing WMLs was previously demonstrated by ΔT1 mapping (9). As no significant difference was seen in ΔT1 values in PRLs versus non-PRL WMLs, we suggest that PRLs do not have greater BBB breakdown than typical WMLs. If PRLs represent WMLs with ongoing, chronic inflammation, one might expect ongoing cytokine release from local inflammatory cells inducing matrix metalloproteinase activity, lymphocyte diapedesis, and other aspects of perivascular inflammation, resulting in a larger ΔT1 due to passive gadolinium leak into tissue(27,28). The lack of a larger ΔT1 suggest that PRLs may not represent chronically inflamed tissue, or that the inflammation may not be profound enough to cause persistent BBB breakdown. Alternately, the lack of a larger ΔT1 in PRLs may be supportive of the hypothesized concept of compartmentalized inflammation in which immune activation persists in an ongoing basis on the brain side of the BBB(29). The compartmentalized inflammation hypothesis suggests a significant contribution of the innate immune system (macrophages, microglia, etc.), rather than cell-mediated or humoral immunity, all of which would be consistent with the known histopathology of PRLs(29).
Insight into myelination and tissue anisotropy from R2* and magnetic susceptibility (χ) in PRL
Metrics derived from GRE images in this study also revealed insights into the pathology occurring within PRLs. Prior work suggests that the majority of R2* signal alterations in the human brain occur due to alterations in myelin, with a smaller contribution from alterations in tissue iron content(30,31). Demyelination and reductions in iron content (likely from oligodendrocyte cell loss) within the core of PRLs likely leads to the reduced R2* relaxation rates noted in PRLs in this study, which is consistent with prior imaging-histopathologic correlations(3,32). Thus, the findings of this study confirm that PRLs are more significantly demyelinated and have lower oligodendrocyte density than non-PRL WMLs. Susceptibility values for PRLs were found to be closer to those for water. Relative χ derived from QSM expresses the contribution of tissue magnetic susceptibility to phase frequency shifts, which is significantly impacted by demyelination and tissue iron content, although the myelination status of tissue is a more significant contributor(33,34). Pure myelin injury should result in a positively deflected phase shift relative to water, but our data showed negative χ in WMLs of all type. MS lesion pathology is more complex than pure myelin destruction, of course, and histopathologic and simulation data suggests an equally strong contribution of proteinaceous neurofilaments and tissue anisotropy to the phase shift, with loss of both leading to negative phase shift(33,34). Our data may suggest a higher ratio of the severity of demyelination (positive deflection) to neurofilament loss (negative deflection) in PRLs compared to non-PRL WMLs.
The introduction of gadolinium into quantitative metrics derived from our GRE images also may provide further pathologic insight. Use of gadolinium increases tissue magnetic susceptibility, especially at high magnetic field strengths, which has led to use of this technique to improve tissue contrast for better visualization of pathologies such as the central vein sign(10,35,36). Investigations as to the changes in susceptibility contrast induced by gadolinium suggest that the changes in tissue contrast are greatest in highly anisotropic tissue(10). This is likely due to restriction of gadolinium to certain tissue compartments by biological membranes and myelin, causing suppression of the signal from isotropic tissue compartments(10,37). In light of this, the significantly smaller ΔR2* (and trend towards less profound Δχ) in PRLs in this study may indicative of reduced tissue anisotropy, including R2* relaxation anisotropy caused by altered fiber orientation, due to more severe axonal loss in PRLs compared to non-PRLs.
PRL vs. Mottled lesion types
In this paper we discuss a lesion type not often discussed in analyses of lesion heterogeneity on susceptibility images – those with mottled susceptibility signal. This lesion type had T1 relaxation times and R2* relaxation rates that were similar to PRLs, χ that was closer to non-PRL WMLS, and the largest ΔR2* of all lesions analyzed. These findings, along with the visual appearance of this lesion type suggest a transitionary lesion type, in which there is mixed demyelination and remyelination, with less neurofilament destruction and intact anisotropy. This lesion type may warrant further study for its evolution over time, as it may be the case that lesions of this type may be more salvageable or responsive to treatment than PRLs, in which cell death has already occurred.
Limitations
The results of this study warrant confirmation in larger sample sizes and in multi-center studies, as conclusions in this study are limited by the small cohort size, single-center/scanner/vendor nature of the study. In addition to this limitation, this study’s quantitative maps may lack pathologic specificity when applied to PRLs given that signal from lesion rims was not separated from the lesion core. Although PRL lesion rims have different signal characteristics than the lesion core, the relative number of voxels constituting the lesion core would vastly outnumber the small number of voxels contributed by a very thin outer rim. In this case, quantitative values for PRLs essentially represent relaxation times and relative susceptibility in the lesion core. Our study included lesion count information but did not include a spatial analysis of lesions. This could lead to inaccurate associations in disability progression analyses. Although T1 relaxation time can provide information about pathologic processes in MS, it is not a definitive measure of myelination and is limited in its ability to capture the heterogenous pathological processes in MS. Similarly, our R2* estimation, which is based on a mono-exponential model, cannot distinctively account for two water components: myelin water and extracellular water. Finally, this study only utilized QSM for PRL identification, rather than unwrapped/filtered phase images. Although the latter technique has been utilized in some of the larger and more prominently cited studies of PRLs in MS,(5,38) a growing number of studies are shifting towards QSM for PRL identification due to known inherent flaws in unwrapped/filtered phase images (1). These include false positive rims that occur due to lesion geometry, magnetic dipole effects, and the non-local nature of phase images – flaws that are all overcome by the processing methodologies of QSM (39). Recent work has also suggested that PRLs identified through QSM may have stronger correlations to disability in MS than phase, likely because of removal of false positive rims from analyses (40).
Conclusion
The results of this study may confirm prior data on the pathologic and clinical significance of PRLs and the importance of utilization of multi-parametricl MRI to evaluate lesion heterogeneity in MS. The introduction of gadolinium into quantitative maps in this study is a unique contribution to the literature and the ability of these maps to provide further insight into the pathologic specificity of findings in MS warrants further study.
Supplementary Material
Acknowledgements:
Thank you to Kerry Naunton for her research coordination work on this study. Thank you to the technicians and MRI physics staff at the Kennedy Krieger Institute at Johns Hopkins University for their assistance in acquisition of the MRI images.
Grant Support:
Images in this study were acquired through NINDS 1K23NS072366–01A1 and the EMD-Serono Grant for Multiple Sclerosis Innovation. Additional time for analysis was supported by NINDS 1R01NS104403–01.
References
- 1.Ng Kee Kwong KC, Mollison D, Meijboom R, et al. The prevalence of paramagnetic rim lesions in multiple sclerosis: A systematic review and meta-analysis. PLoS One 2021;16(9):e0256845. [DOI] [PMC free article] [PubMed] [Google Scholar]
- 2.Dal-Bianco A, Grabner G, Kronnerwetter C, et al. Slow expansion of multiple sclerosis iron rim lesions: pathology and 7 T magnetic resonance imaging. Acta Neuropathol 2017;133(1):25–42. [DOI] [PMC free article] [PubMed] [Google Scholar]
- 3.Bagnato F, Hametner S, Yao B, et al. Tracking iron in multiple sclerosis: a combined imaging and histopathological study at 7 Tesla. Brain 2011;134(Pt 12):3602–3615. [DOI] [PMC free article] [PubMed] [Google Scholar]
- 4.Harrison DM, Li X, Liu H, et al. Lesion Heterogeneity on High-Field Susceptibility MRI Is Associated with Multiple Sclerosis Severity. AJNR Am J Neuroradiol 2016;37(8):1447–1453. [DOI] [PMC free article] [PubMed] [Google Scholar]
- 5.Absinta M, Sati P, Masuzzo F, et al. Association of Chronic Active Multiple Sclerosis Lesions With Disability In Vivo. JAMA Neurol 2019. [DOI] [PMC free article] [PubMed] [Google Scholar]
- 6.Lommers E, Simon J, Reuter G, et al. Multiparameter MRI quantification of microstructural tissue alterations in multiple sclerosis. Neuroimage Clin 2019;23:101879. [DOI] [PMC free article] [PubMed] [Google Scholar]
- 7.Chen W, Gauthier SA, Gupta A, et al. Quantitative susceptibility mapping of multiple sclerosis lesions at various ages. Radiology 2014;271(1):183–192. [DOI] [PMC free article] [PubMed] [Google Scholar]
- 8.Kolb H, Absinta M, Beck ES, et al. 7T MRI Differentiates Remyelinated from Demyelinated Multiple Sclerosis Lesions. Ann Neurol 2021;90(4):612–626. [DOI] [PMC free article] [PubMed] [Google Scholar]
- 9.Choi S, Spini M, Hua J, Harrison DM. Blood-brain barrier breakdown in non-enhancing multiple sclerosis lesions detected by 7-Tesla MP2RAGE DeltaT1 mapping. PLoS One 2021;16(4):e0249973. [DOI] [PMC free article] [PubMed] [Google Scholar]
- 10.Dibb R, Li W, Cofer G, Liu C. Microstructural origins of gadolinium-enhanced susceptibility contrast and anisotropy. Magn Reson Med 2014;72(6):1702–1711. [DOI] [PMC free article] [PubMed] [Google Scholar]
- 11.Polman CH, Reingold SC, Banwell B, et al. Diagnostic criteria for multiple sclerosis: 2010 revisions to the McDonald criteria. Annals of neurology 2011;69(2):292–302. [DOI] [PMC free article] [PubMed] [Google Scholar]
- 12.Marques JP, Kober T, Krueger G, van der Zwaag W, Van de Moortele PF, Gruetter R. MP2RAGE, a self bias-field corrected sequence for improved segmentation and T1-mapping at high field. Neuroimage 2010;49(2):1271–1281. [DOI] [PubMed] [Google Scholar]
- 13.Tustison NJ, Avants BB, Cook PA, et al. N4ITK: improved N3 bias correction. IEEE Trans Med Imaging 2010;29(6):1310–1320. [DOI] [PMC free article] [PubMed] [Google Scholar]
- 14.Wharton S, Bowtell R. Fiber orientation-dependent white matter contrast in gradient echo MRI. Proc Natl Acad Sci U S A 2012;109(45):18559–18564. [DOI] [PMC free article] [PubMed] [Google Scholar]
- 15.Bao L, Li X, Cai C, Chen Z, van Zijl PC. Quantitative Susceptibility Mapping Using Structural Feature Based Collaborative Reconstruction (SFCR) in the Human Brain. IEEE Trans Med Imaging 2016;35(9):2040–2050. [DOI] [PMC free article] [PubMed] [Google Scholar]
- 16.Liu Z, Spincemaille P, Yao Y, Zhang Y, Wang Y. MEDI+0: Morphology enabled dipole inversion with automatic uniform cerebrospinal fluid zero reference for quantitative susceptibility mapping. Magn Reson Med 2018;79(5):2795–2803. [DOI] [PMC free article] [PubMed] [Google Scholar]
- 17.Carass A, Roy S, Jog A, et al. Longitudinal multiple sclerosis lesion segmentation: Resource and challenge. Neuroimage 2017;148:77–102. [DOI] [PMC free article] [PubMed] [Google Scholar]
- 18.Spini M, Choi S, Harrison DM. 7T MPFLAIR versus MP2RAGE for Quantifying Lesion Volume in Multiple Sclerosis. J Neuroimaging 2020;30(4):531–536. [DOI] [PMC free article] [PubMed] [Google Scholar]
- 19.Goldman MD, LaRocca NG, Rudick RA, et al. Evaluation of multiple sclerosis disability outcome measures using pooled clinical trial data. Neurology 2019;93(21):e1921–e1931. [DOI] [PMC free article] [PubMed] [Google Scholar]
- 20.Kapoor R, Ho PR, Campbell N, et al. Effect of natalizumab on disease progression in secondary progressive multiple sclerosis (ASCEND): a phase 3, randomised, double-blind, placebo-controlled trial with an open-label extension. Lancet Neurol 2018;17(5):405–415. [DOI] [PubMed] [Google Scholar]
- 21.Yates F Contingency tables involving small numbers and the chi-squared test. Supplement to the Journal of the Royal Statistical Society 1934;1(2):217–235. [Google Scholar]
- 22.B T, W Z, H C, S C, X L, Dm H. Sex-specific differences in rim appearance of multiple sclerosis lesions on quantitative susceptibility mapping. Mult Scler Relat Disord 2020;45:102317. [DOI] [PMC free article] [PubMed] [Google Scholar]
- 23.Marcille M, Hurtado Rua S, Tyshkov C, et al. Disease correlates of rim lesions on quantitative susceptibility mapping in multiple sclerosis. Sci Rep 2022;12(1):4411. [DOI] [PMC free article] [PubMed] [Google Scholar]
- 24.van Walderveen MA, Kamphorst W, Scheltens P, et al. Histopathologic correlate of hypointense lesions on T1-weighted spin-echo MRI in multiple sclerosis. Neurology 1998;50(5):1282–1288. [DOI] [PubMed] [Google Scholar]
- 25.Thaler C, Faizy T, Sedlacik J, et al. T1- Thresholds in Black Holes Increase Clinical-Radiological Correlation in Multiple Sclerosis Patients. PLoS One 2015;10(12):e0144693. [DOI] [PMC free article] [PubMed] [Google Scholar]
- 26.Chang A, Nishiyama A, Peterson J, Prineas J, Trapp BD. NG2-positive oligodendrocyte progenitor cells in adult human brain and multiple sclerosis lesions. J Neurosci 2000;20(17):6404–6412. [DOI] [PMC free article] [PubMed] [Google Scholar]
- 27.Daneman R, Prat A. The blood-brain barrier. Cold Spring Harb Perspect Biol 2015;7(1):a020412. [DOI] [PMC free article] [PubMed] [Google Scholar]
- 28.Elschot EP, Backes WH, Postma AA, et al. A Comprehensive View on MRI Techniques for Imaging Blood-Brain Barrier Integrity. Invest Radiol 2021;56(1):10–19. [DOI] [PubMed] [Google Scholar]
- 29.Matthews PM. Chronic inflammation in multiple sclerosis - seeing what was always there. Nat Rev Neurol 2019;15(10):582–593. [DOI] [PubMed] [Google Scholar]
- 30.Lee J, Shmueli K, Kang BT, et al. The contribution of myelin to magnetic susceptibility-weighted contrasts in high-field MRI of the brain. Neuroimage 2012;59(4):3967–3975. [DOI] [PMC free article] [PubMed] [Google Scholar]
- 31.Stuber C, Morawski M, Schafer A, et al. Myelin and iron concentration in the human brain: a quantitative study of MRI contrast. Neuroimage 2014;93 Pt 1:95–106. [DOI] [PubMed] [Google Scholar]
- 32.Bagnato F, Hametner S, Boyd E, et al. Untangling the R2* contrast in multiple sclerosis: A combined MRI-histology study at 7.0 Tesla. PLoS One 2018;13(3):e0193839. [DOI] [PMC free article] [PubMed] [Google Scholar]
- 33.Yablonskiy DA, Sukstanskii AL. Biophysical mechanisms of myelin-induced water frequency shifts. Magn Reson Med 2014;71(6):1956–1958. [DOI] [PMC free article] [PubMed] [Google Scholar]
- 34.Yablonskiy DA, Luo J, Sukstanskii AL, Iyer A, Cross AH. Biophysical mechanisms of MRI signal frequency contrast in multiple sclerosis. Proc Natl Acad Sci U S A 2012;109(35):14212–14217. [DOI] [PMC free article] [PubMed] [Google Scholar]
- 35.Blockley NP, Jiang L, Gardener AG, Ludman CN, Francis ST, Gowland PA. Field strength dependence of R1 and R2* relaxivities of human whole blood to ProHance, Vasovist, and deoxyhemoglobin. Magn Reson Med 2008;60(6):1313–1320. [DOI] [PubMed] [Google Scholar]
- 36.Sparacia G, Agnello F, Iaia A, Banco A, Galia M, Midiri M. Multiple sclerosis: prevalence of the ‘central vein’ sign in white matter lesions on gadolinium-enhanced susceptibility-weighted images. Neuroradiol J 2021;34(5):470–475. [DOI] [PMC free article] [PubMed] [Google Scholar]
- 37.Adzamli IK, Jolesz FA, Bleier AR, Mulkern RV, Sandor T. The effect of gadolinium DTPA on tissue water compartments in slow- and fast-twitch rabbit muscles. Magn Reson Med 1989;11(2):172–181. [DOI] [PubMed] [Google Scholar]
- 38.Absinta M, Sati P, Schindler M, et al. Persistent 7-tesla phase rim predicts poor outcome in new multiple sclerosis patient lesions. J Clin Invest 2016;126(7):2597–2609. [DOI] [PMC free article] [PubMed] [Google Scholar]
- 39.Cronin MJ, Wharton S, Al-Radaideh A, et al. A comparison of phase imaging and quantitative susceptibility mapping in the imaging of multiple sclerosis lesions at ultrahigh field. MAGMA 2016;29(3):543–557. [DOI] [PMC free article] [PubMed] [Google Scholar]
- 40.Huang W, Sweeney EM, Kaunzner UW, Wang Y, Gauthier SA, Nguyen TD. Quantitative susceptibility mapping versus phase imaging to identify multiple sclerosis iron rim lesions with demyelination. J Neuroimaging 2022;32(4):667–675. [DOI] [PMC free article] [PubMed] [Google Scholar]
Associated Data
This section collects any data citations, data availability statements, or supplementary materials included in this article.