Visual Abstract
Keywords: motion correction, myocardial perfusion imaging, myocardial blood flow, PET, rubidium
Abstract
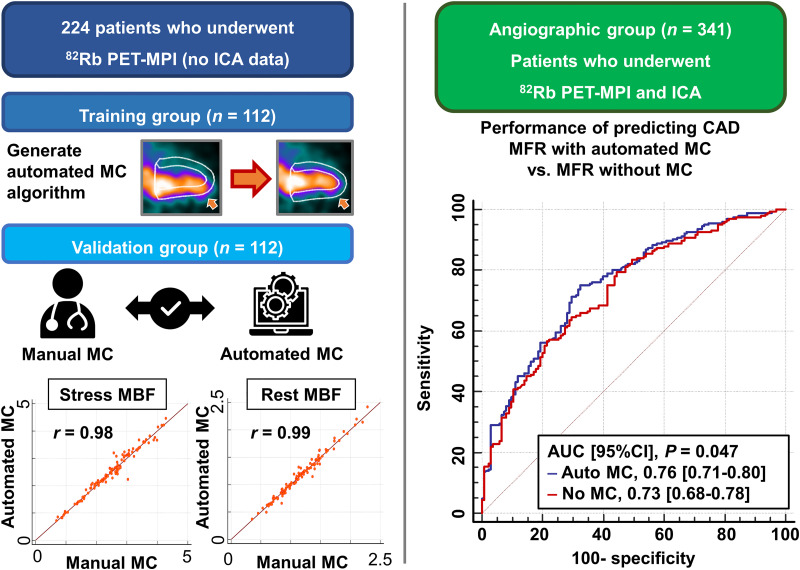
Motion correction (MC) affects myocardial blood flow (MBF) measurements in 82Rb PET myocardial perfusion imaging (MPI); however, frame-by-frame manual MC of dynamic frames is time-consuming. This study aims to develop an automated MC algorithm for time–activity curves used in compartmental modeling and compare the predictive value of MBF with and without automated MC for significant coronary artery disease (CAD). Methods: In total, 565 patients who underwent PET-MPI were considered. Patients without angiographic findings were split into training (n = 112) and validation (n = 112) groups. The automated MC algorithm used simplex iterative optimization of a count-based cost function and was developed using the training group. MBF measurements with automated MC were compared with those with manual MC in the validation group. In a separate cohort, 341 patients who underwent PET-MPI and invasive coronary angiography were enrolled in the angiographic group. The predictive performance in patients with significant CAD (≥70% stenosis) was compared between MBF measurements with and without automated MC. Results: In the validation group (n = 112), MBF measurements with automated and manual MC showed strong correlations (r = 0.98 for stress MBF and r = 0.99 for rest MBF). The automatic MC took less time than the manual MC (<12 s vs. 10 min per case). In the angiographic group (n = 341), MBF measurements with automated MC decreased significantly compared with those without (stress MBF, 2.16 vs. 2.26 mL/g/min; rest MBF, 1.12 vs. 1.14 mL/g/min; MFR, 2.02 vs. 2.10; all P < 0.05). The area under the curve (AUC) for the detection of significant CAD by stress MBF with automated MC was higher than that without (AUC, 95% CI, 0.76 [0.71–0.80] vs. 0.73 [0.68–0.78]; P < 0.05). The addition of stress MBF with automated MC to the model with ischemic total perfusion deficit showed higher diagnostic performance for detection of significant CAD (AUC, 95% CI, 0.82 [0.77–0.86] vs. 0.78 [0.74–0.83]; P = 0.022), but the addition of stress MBF without MC to the model with ischemic total perfusion deficit did not reach significance (AUC, 95% CI, 0.81 [0.76–0.85] vs. 0.78 [0.74–0.83]; P = 0.067). Conclusion: Automated MC on 82Rb PET-MPI can be performed rapidly with excellent agreement with experienced operators. Stress MBF with automated MC showed significantly higher diagnostic performance than without MC.
PET myocardial perfusion imaging (PET-MPI) with pharmacologic stress can assess absolute myocardial blood flow (MBF), which relates to disease severity in patients with coronary artery disease (CAD) (1). Myocardial motion is frequently observed during pharmacologic stress PET-MPI and can significantly affect MBF measurements (2–6). Hence, motion correction (MC) is crucial to obtain reliable MBF measurements by PET-MPI (3,7). We recently showed that the diagnostic performance of stress MBF and myocardial flow reserve (MFR) computed with the compartmental model and manual MC of time–activity curves was superior for predicting significant CAD when compared with stress MBF and MFR without correction in 18F-flurpiridaz PET-MPI (8). However, frame-by-frame manual adjustment of image positions to correct time–activity curves is tedious and operator-dependent. This manual step adds difficulty to highly complex cardiovascular PET protocols. Recent studies showed that the automated MC yields MBF measurements similar to those of manual MC and improves repeatability and reproducibility (9,10). However, the diagnostic performance of MBF measurements with automated MC for predicting significant CAD compared with those without MC has not been studied.
We aimed to develop an automated MC algorithm for MBF quantification, compare MBF measurements with automated MC to those with manual MC, and assess the predictive performance of MBF with automated MC compared with MBF without MC for significant CAD by invasive coronary angiography (ICA).
MATERIALS AND METHODS
Study Population
To develop and validate the automated MC algorithm, 224 patients who underwent stress and rest 82Rb PET-MPI at Cedars-Sinai Medical Center were retrospectively selected. The 224 patients were split into a training (n = 112) and a validation group (n = 112). Apart from this population, 341 consecutive patients without a history of prior CAD who underwent 82Rb PET-MPI and ICA within 6 mo at Cedars-Sinai Medical Center from 2011 to 2018 were enrolled as an angiographic group. The study complies with the Declaration of Helsinki and was approved by the institutional review board at Cedars-Sinai Medical Center. All participants gave informed consent.
ICA
Significant CAD was visually evaluated using ICA by an experienced interventional cardiologist. Significant CAD was defined as having at least 50% stenosis in the left main trunk or at least 70% stenosis in the left anterior descending artery, left circumflex artery, or right coronary artery (RCA). For per-vessel analysis, significant left main trunk CAD was considered a disease in the left anterior descending and left circumflex arteries.
PET Protocol
Same-day, rest, and pharmacologic stress 82Rb PET-MPI studies were performed for all patients on a Biograph 64 PET/CT scanner (Siemens Healthineers) or a Discovery 710 scanner (GE Healthcare). A 6-min rest list-mode acquisition was started immediately before the injection of weight-based doses of 10–12 MBq/kg of 82Rb (925–1,850 MBq [25–50 mCi]). Pharmacologic stress with regadenoson, adenosine, or dipyridamole was performed, and a 6-min stress imaging acquisition was simultaneously initiated with the start of the 82Rb infusion (10–12 MBq/kg). A low-dose helical CT scan was acquired before each rest and stress PET scan for attenuation correction as previously described (11).
Reconstruction
PET images were reconstructed using standard PET corrections (attenuation, randoms, scatter, dead time, decay). The 6-min list-mode data were reconstructed into 16 frames (12 frames, 10 s; 2 frames, 30 s; 1 frame, 60 s; and 1 frame, 120 s).
Automated Myocardial Contour Positioning
Left ventricular (LV) and right ventricular (RV) contours were automatically segmented from the summed image data from the last 4 min of the 6-min list-mode acquisition by QPET software (Cedars-Sinai) (12). PET images were automatically reoriented into short-axis and vertical and horizontal long-axis views. Quality control for all myocardial contours was performed by experienced technologists. Stress and rest total perfusion deficit was derived automatically using QPET software (12).
Manual MC
MC for the LV contour was performed manually in 1-mm steps at stress and rest to align the myocardial tracer uptake frame by frame by 2 experienced operators. For each frame, the operators shifted the image position to match the position of the LV contour. The third experienced operator reviewed the motion-corrected data and reconciled the MC results by a consensus with each operator. The MC in millimeters was quantified in 3 orthogonal directions (septal–lateral, superior–inferior, and apical–basal).
Automated MC
The motion of the heart in 3-dimensional space was automatically detected on each frame using the automatically segmented LV and RV contours as references. The image of each frame was translated in all 3 axes (septal–lateral, superior–inferior, and apical–basal directions) by the algorithm to align with the static contours. A previous study showed that over 5 mm of myocardial motion can lead to significant alterations in the MBF measurements (13), so we defined significant myocardial motion as a maximum shift greater than 5 mm in an acquisition. All cases were processed in a fully automated batch mode.
Algorithm for Automated MC
The LV and RV contours generated by segmenting the summed image of the last 4 min of the acquisition were used to define a static 3-dimensional geometric model of the ventricles, which included the endocardial and epicardial surfaces of the left and right ventricles, the cavities within the endocardial surfaces, and the myocardium between. Our automated MC algorithm was based on aligning individual image frames to this geometric model using 3-dimensional rigid-body translations. Stress and rest acquisitions were corrected independently.
For image frames in the LV blood-pool phase, the LV myocardium phase, and the transition between, 3 key frames based on the time–activity curves of the LV input region of interest (ROI) and LV myocardium were identified: an LV blood-pool peak frame where the LV input ROI activity curve had a maximal value, an LV blood-pool and myocardium crossover frame where the LV input ROI and LV myocardium curves intersected, and the very last frame with nearly all the counts in the myocardium. These key frames were selected for the well-defined correspondence of their tracer activity distribution to the regions defined in the geometric model of the heart. Each of the 3 key frames was aligned independently to the geometric model by numeric maximization of similarity metrics. Components of similarity metrics included total counts in different regions defined in the model (to be maximized or minimized), gradients of counts at the epi- and endomyocardial surfaces, uniformity of counts within the LV myocardium, and mutual information between the original image and a pseudo one generated from numerically labeling the model regions. Three different similarity metric functions based on these components were used to reflect the different characteristics of tracer activity distribution to separately align each of these 3 key frames of the kinetic study to the model as follows: LV blood-pool peak, where tracer activity was expected to concentrate in the cavity within the LV endocardial surface; LV blood-pool and myocardium crossover, where activity was expected to fill both the LV cavity and myocardium; and end of acquisition, where activity was concentrated within the LV myocardium.
For each frame between the LV peak and LV crossover key frames, the 2 key frames were linearly blended into a synthetic reference using the ratios of total counts in the LV myocardium to counts in the LV input ROI as weights. Similarly, a synthetic reference was generated for each frame between the LV crossover and the end of acquisition by the same linear blending process. These in-between frames were then registered to the references using simplex maximization of the mutual information criterion (14).
Lastly, image frames in the RV phase before the LV blood-pool phase, which were defined as any frames at or after the RV input ROI peak and before the LV input ROI peak, were individually registered to the geometric model using a fourth similarity metric designed to align the activity with the right ventricle while minimizing counts in the LV myocardium.
MBF and MFR Quantification
Rest and stress MBF was calculated by clinical software (QPET) with a 1-tissue-compartment kinetic model (15). MBF and the spillover fraction from the blood to the myocardium were computed by numeric optimization. Stress and rest MBF values in mL/g/min were computed for each sample on the polar map. The rate–pressure product (RPP) was calculated by heart rate (bpm) times systolic blood pressure (mm Hg) and used for rest MBF adjustment in the angiographic group by (rest MBF × RPP average)/RPP. The average RPP value in the angiographic group was 9,720 bpm × mm Hg (16). MFR was computed as the ratio of stress over the rest MBF adjusted by RPP. All MBF values were calculated automatically in batch mode.
Diagnostic Performance for Predicting Significant CAD
To evaluate the diagnostic performance for significant CAD, minimal vessel stress MBF or MFR (lowest stress MBF or MFR value in the left anterior descending artery, left circumflex artery, and RCA territories) was used.
Statistical Analysis
Categoric variables are presented as frequencies, and continuous variables as mean ± SD or median and interquartile ranges. Variables were compared using the Pearson χ2 statistic for categoric variables. For continuous variables, a 2-sample t test was used to compare unpaired samples, and a paired t test was used to compare paired samples. The correlation of stress and rest MBF values between automated and manual MC was assessed using Pearson correlation analysis and Bland–Altman plots. Homogeneity of variances between automated and manual MC was checked by the Levene test for stress and rest MBF. The diagnostic performance of minimal vessel stress MBF, MFR, and ischemic total perfusion deficit (iTPD) (stress total perfusion deficit – rest total perfusion deficit) for predicting significant CAD was evaluated by pairwise comparisons of the areas under the receiver operating characteristic curve (AUC) by DeLong et al. (17) and paired binary comparisons using a threshold of 2.0 mL/g/min for MBF and 2.0 for MFR (18) by the McNemar test (19). Since minimal vessel stress, MBF, and MFR showed higher diagnostic performance than global stress MBF and MFR, we used minimal vessel stress MBF and MFR to assess the diagnostic performance (8). The vascular territorial segmentation was based on standardized myocardial segmentation (20). A 2-tailed P value of less than 0.05 was considered statistically significant. All statistical analyses were performed with R version 4.2.0 (R Foundation for Statistical Computing) or MedCalc version 20.210 (MedCalc Software).
RESULTS
Comparison of Stress and Rest MBF with Automated MC and Manual MC Table
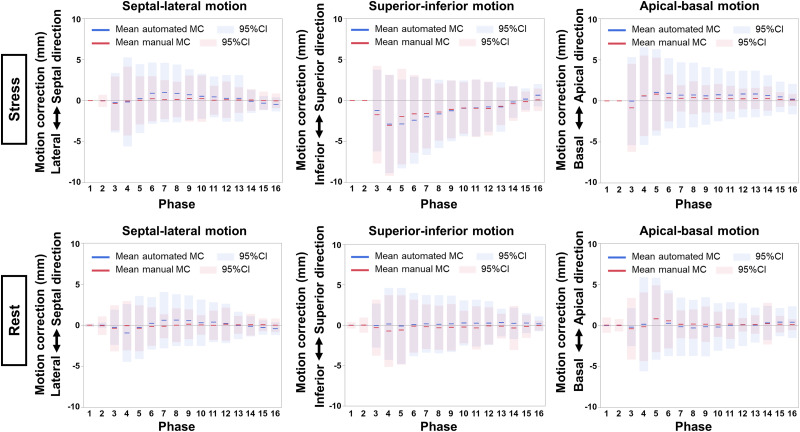
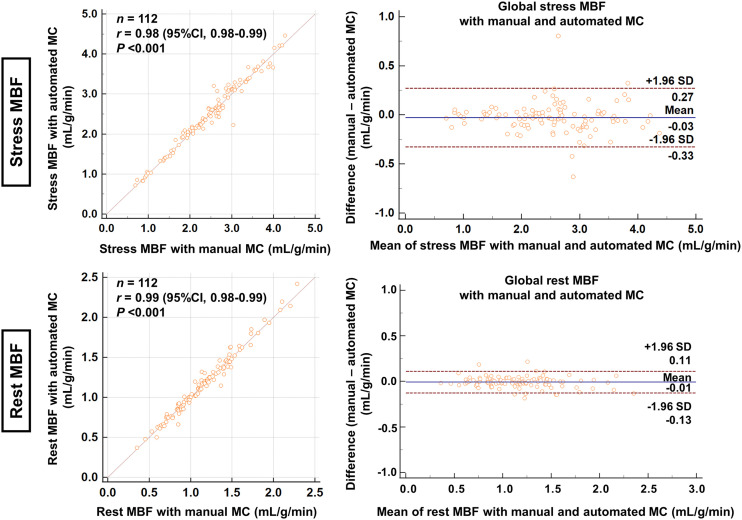
Figure 1 shows the mean MC and 95% CI per frame for stress and rest imaging in each direction in the validation group. Although the direction of MC was similar between automated and manual MC, the variances (ranges of the adjustment) were greater for the automated software (all P < 0.005). Supplemental Figure 1 shows the scatterplots of the automated and manual MC per frame for stress and rest imaging (supplemental materials are available at http://jnm.snmjournals.org). MC at stress in the inferior direction, especially in the early phase, was greater than in the other directions (Fig. 1; Supplemental Fig. 1). The processing time of the automatic MC was less than 12 s, which was faster than the manual MC, which took approximately 10 min per case. Figure 2 shows the correlation and Bland–Altman plots between stress and rest MBF with automated and manual MC. Strong correlations between automated and manual MC were seen in the stress MBF (r = 0.98, P < 0.001) and the rest MBF (r = 0.99, P < 0.001). There was no significant difference between stress and rest MBF with automated and manual MC (P = 0.068 for stress MBF and P = 0.157 for rest MBF).
FIGURE 1.
Mean automated and manual MC on stress (top) and rest (bottom) acquisition per phase in validation group. Solid lines indicate means, and shaded areas indicate 95% CIs (blue for automated and red for manual MC).
FIGURE 2.
Correlation and Bland–Altman plots between MBF measurements with automated and manual MC in validation group for global stress MBF (mL/g/min) (top) and global rest MBF (mL/g/min) (bottom).
Patient Characteristics of the Angiographic Cohort
The baseline characteristics of the angiographic group are shown in Table 1. The mean age was 71 y, and 67% (229/341) were male. The mean interval between the PET-MPI and ICA was 19 d, and 60% (206/341) of patients had significant CAD. Table 2 shows the results of the ICA.
TABLE 1.
Patient Characteristics of Angiographic Group
| Parameter | Overall | Significant CAD | No significant CAD | P |
|---|---|---|---|---|
| n | 341 | 206 (60.4) | 135 (39.6) | |
| Age (y) | 71.3 ± 12.2 | 73.5 ± 11.5 | 68.0 ± 12.6 | <0.001 |
| Male sex | 229 (67.2) | 142 (68.9) | 87 (64.4) | 0.411 |
| Body mass index (kg/m2) | 28.5 ± 6.7 | 28.0 ± 6.1 | 29.2 ± 7.4 | 0.127 |
| Hypertension | 260 (76.2) | 161 (78.2) | 99 (73.3) | 0.362 |
| Dyslipidemia | 214 (62.8) | 130 (63.1) | 84 (62.2) | 0.909 |
| Diabetes | 122 (35.8) | 74 (35.9) | 48 (35.6) | 0.999 |
| Family history of CAD | 50 (14.7) | 29 (14.1) | 21 (15.6) | 0.755 |
| Smoking | 31 (9.1) | 14 (6.8) | 17 (12.6) | 0.083 |
| PVD | 38 (11.1) | 29 (14.1) | 9 (6.7) | 0.035 |
| History of CAD | 0 (0) | 0 (0) | 0 (0) | |
| Stress agent | ||||
| Regadenoson | 324 (95.0) | 196 (95.1) | 128 (94.8) | 0.576 |
| Adenosine | 16 (4.7) | 10 (4.9) | 6 (4.4) | |
| Dipyridamole | 1 (0.3) | 1 (0.7) | 0 (0) |
PVD = peripheral vascular disease.
Categoric values are expressed as n with percentage in parentheses; continuous values are expressed as mean ± SD.
TABLE 2.
ICA Results in Angiographic Group (n = 341)
| Result | Number |
|---|---|
| Significant LM disease | 12 (3.5%) |
| Significant LAD disease | 137 (40.2%) |
| Significant LCX disease | 90 (26.4%) |
| Significant RCA disease | 112 (32.8%) |
| Significant CAD | 206 (60.4%) |
LM = left main trunk; LAD = left anterior descending artery; LCX = left circumflex artery.
Comparison Between MBF and MFR With and Without Automated MC
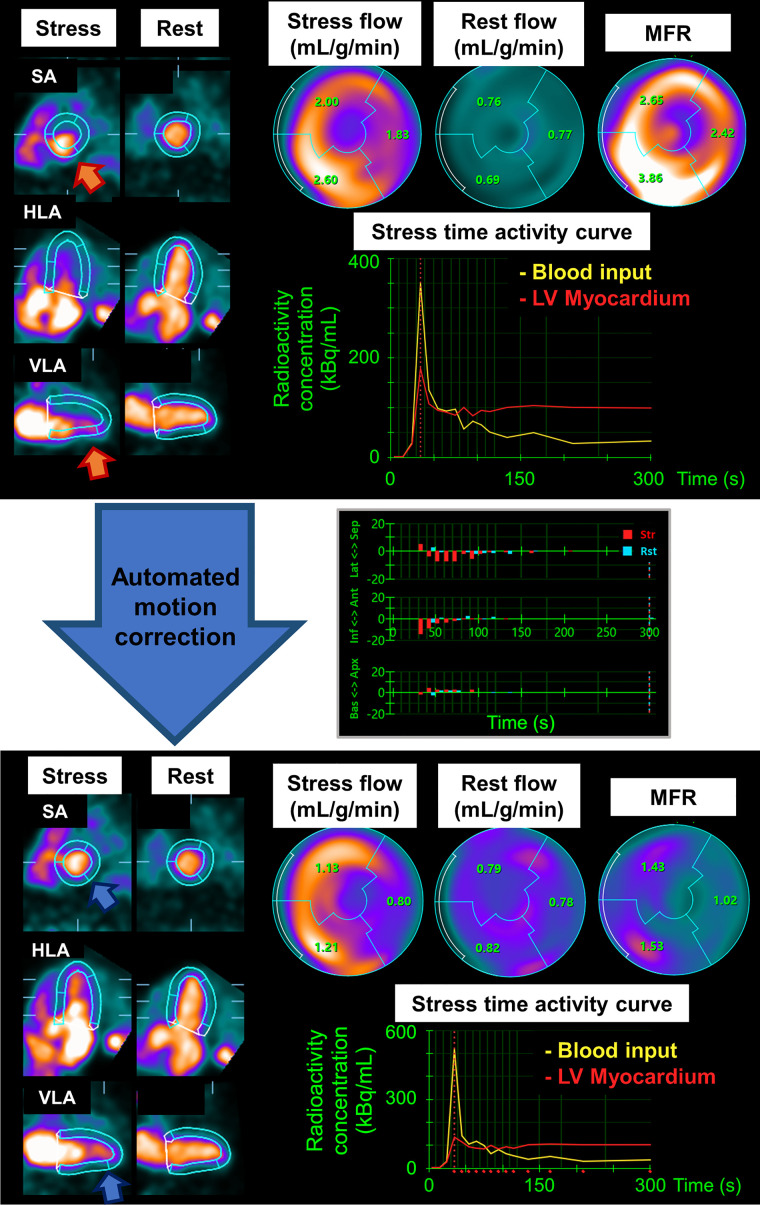
Similar to the validation group, myocardial motion in the inferior direction, especially in the early phase at stress, was greater than in the other directions in the angiographic group (Supplemental Fig. 2). The MFR and stress and rest MBF measurements before and after MC for global and each vascular territory measurement are shown in Table 3. Overall, mean flow measurements and SD were lower for those with automated MC than without MC (Table 3). In the angiographic group, 52 of 341 (15.2%) and 62 of 341 (18.2%) patients had a change of more than 20% before and after MC in global stress MBF and global MFR, respectively. Among the 3 vascular territories, the stress MBF and MFR in the RCA territory showed the largest decrease after automated MC compared with those without MC (mean stress MBF in RCA, 2.11 ± 0.89 mL/min/g vs. 2.28 ± 0.95 mL/min/g; P < 0.001; mean MFR in RCA, 2.06 ± 0.93 vs. 2.23 ± 1.02; P < 0.001) (Table 3). When patients were divided into groups with and without myocardial motion greater than 5 mm, those with greater myocardial motion showed larger differences in flow measurements before and after MC than those with less myocardial motion (Table 3). Myocardial motion over 5 mm was observed in 69% (235/341) of patients at stress and 41% (139/341) at rest (Table 3). Global and territorial spillover fractions for stress and rest images were lower for images with automated MC than for those without (Supplemental Table 1). Figure 3 and Supplemental Figure 3 show a case example of a significant change in flow measurements before and after automated MC.
TABLE 3.
Global and Territorial MFR, Stress MBF, and Rest MBF According to Myocardial Motion in Angiographic Group
| Overall (n = 341) | Motion ≤ 5 mm at stress* | Motion > 5 mm at stress† | |||||||
|---|---|---|---|---|---|---|---|---|---|
| Parameter | Auto MC | No MC | P | Auto MC | No MC | P | Auto MC | No MC | P |
| MFR | |||||||||
| Global | 2.02 ± 0.85 | 2.10 ± 0.85 | <0.001 | 1.99 ± 0.77 | 1.98 ± 0.76 | 0.788 | 2.04 ± 0.89 | 2.15 ± 0.89 | <0.001 |
| LAD | 2.02 ± 0.89 | 2.00 ± 0.89 | 0.201 | 2.02 ± 0.82 | 1.98 ± 0.80 | 0.071 | 2.02 ± 0.93 | 2.01 ± 0.93 | 0.554 |
| LCX | 2.00 ± 0.82 | 2.04 ± 0.80 | 0.009 | 1.94 ± 0.72 | 1.93 ± 0.69 | 0.521 | 2.03 ± 0.86 | 2.12 ± 0.87 | 0.002 |
| RCA | 2.06 ± 0.93 | 2.23 ± 1.02 | <0.001 | 2.00 ± 0.84 | 2.04 ± 0.88 | 0.141 | 2.08 ± 0.89 | 2.29 ± 1.03 | <0.001 |
| Stress MBF | |||||||||
| Global | 2.16 ± 0.86 | 2.26 ± 0.86 | <0.001 | 2.27 ± 0.87 | 2.29 ± 0.90 | 0.229 | 2.11 ± 0.85 | 2.25 ± 0.84 | <0.001 |
| LAD | 2.19 ± 0.91 | 2.21 ± 0.93 | 0.232 | 2.33 ± 0.92 | 2.32 ± 0.95 | 0.861 | 2.12 ± 0.91 | 2.15 ± 0.91 | 0.175 |
| LCX | 2.19 ± 0.85 | 2.30 ± 0.86 | <0.001 | 2.27 ± 0.85 | 2.30 ± 0.88 | 0.085 | 2.16 ± 0.86 | 2.30 ± 0.85 | <0.001 |
| RCA | 2.11 ± 0.89 | 2.28 ± 0.95 | <0.001 | 2.20 ± 0.92 | 2.24 ± 0.97 | 0.117 | 2.07 ± 0.87 | 2.30 ± 0.95 | <0.001 |
| Rest MBF | |||||||||
| Global | 1.12 ± 0.42 | 1.14 ± 0.41 | 0.021 | 1.18 ± 0.44 | 1.18 ± 0.44 | 0.241 | 1.05 ± 0.38 | 1.07 ± 0.37 | 0.042 |
| LAD | 1.14 ± 0.44 | 1.17 ± 0.44 | <0.001 | 1.19 ± 0.46 | 1.21 ± 0.45 | 0.005 | 1.08 ± 0.39 | 1.11 ± 0.41 | 0.008 |
| LCX | 1.15 ± 0.42 | 1.17 ± 0.42 | 0.002 | 1.20 ± 0.45 | 1.21 ± 0.45 | 0.110 | 1.07 ± 0.37 | 1.10 ± 0.37 | 0.009 |
| RCA | 1.08 ± 0.42 | 1.08 ± 0.42 | 0.474 | 1.14 ± 0.44 | 1.13 ± 0.44 | 0.262 | 1.00 ± 0.39 | 1.00 ± 0.38 | 0.963 |
n = 106 for MFR and stress MBF but 202 for rest MBF.
n = 235 for MFR and stress MBF but 139 for rest MBF.
LAD = left anterior descending artery; LCX = left circumflex artery.
MBF measurements according to significant myocardial motion, myocardial motion greater than 5 mm.
FIGURE 3.
Case example of automated MC in patient with significant myocardial motion: early dynamic images before (above) and after (below) automated MC. LV contours before MC were automatically computed from summed frames after 2 min. Before correction, inferior LV contour overlapped substantially with activity of blood pool, and anterior LV contour was far from actual LV myocardium (orange arrows). Time–activity curve shows LV myocardial activities are overestimated before MC (red curve). Curves were corrected after automated MC (blue arrows); however, myocardial contours after automated MC contain some remaining activity at apex. Middle graph shows MC results for each direction and each frame (maximum magnitude of MC was 19.9 mm at stress and 6.3 mm at rest). Global MFR decreased from 2.90 to 1.33 after MC. Although patient showed normal perfusion, coronary angiography showed significant stenosis in proximal left anterior descending (LAD) artery and RCA (Supplemental Fig. 3). Ant = anterior; Apx = apical; Bas = basal; HLA = horizontal long axis; Inf = inferior; Lat = lateral; SA = short axis; Sep = septal; VLA = vertical long axis.
Diagnostic Performance of Stress MBF and MFR With and Without Automated MC
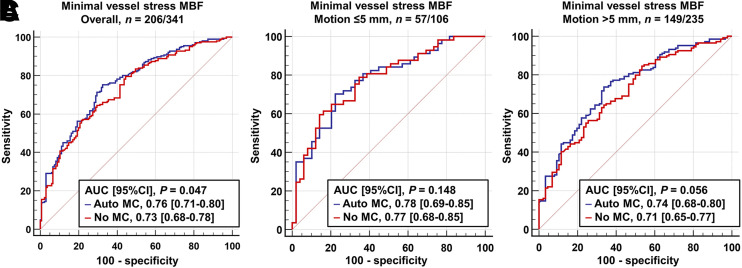
The AUC of minimal vessel stress MBF with automated MC for predicting significant CAD was significantly higher than that without MC (AUC, 0.76 vs. 0.73; P = 0.047) (Fig. 4). The AUC of minimal vessel MFR with automated MC was trending higher than that without MC (AUC, 0.74 vs. 0.72; P = 0.073) (Supplemental Fig. 4). When the patients were stratified into groups with and without motion greater than 5 mm at stress (n = 235), a myocardial motion greater than 5 mm trended toward higher AUC by stress MBF with automated MC than that without MC (AUC, 0.74 vs. 0.71; P = 0.056), but the AUCs with and without automated MC were comparable in patients with myocardial motion less than 5 mm (AUC, 0.78 vs. 0.77; P = 0.148) (Fig. 4).
FIGURE 4.
Diagnostic performance of minimal vessel stress MBF for prediction of significant CAD in angiographic group in all patients (A), patients without significant myocardial motion (B), and those with significant myocardial motion (C).
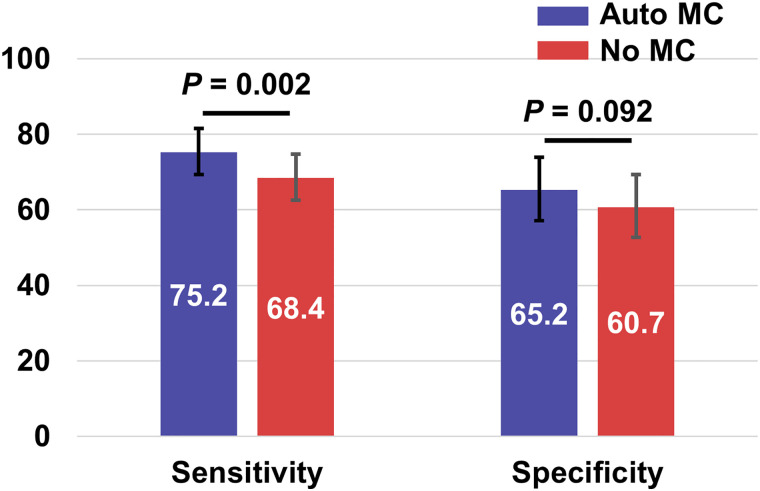
Figure 5 shows the sensitivity and specificity for predicting significant CAD by minimal vessel stress MBF with and without automated MC using the threshold of 2.0 mL/g/min. The sensitivity using automated MC was significantly higher than that without (75.2% vs. 68.4%; P = 0.002). Overall, the minimal vessel stress MBF measurements with automated MC performed significantly better than without MC (difference, 5.9% [95% CI, 2.5%–9.3%]; P = 0.001) (Supplemental Table 2). Supplemental Figure 5 shows the results of the same analysis using minimal vessel MFR. Although there was no significant difference for sensitivity (77.7% vs. 77.2%, P = 0.999), the specificity using automated MC was significantly higher than that without MC (57.0% vs. 49.6%, P = 0.021). Overall, minimal vessel MFR measurements with automated MC tended to agree better with ICA; however, the difference was not significant (difference, 3.2% [95% CI, −0.1%–6.5%]; P = 0.080) (Supplemental Table 3).
FIGURE 5.
Sensitivity and specificity for predicting significant CAD by minimal vessel stress MBF of 2.0 mL/g/min in angiographic group.
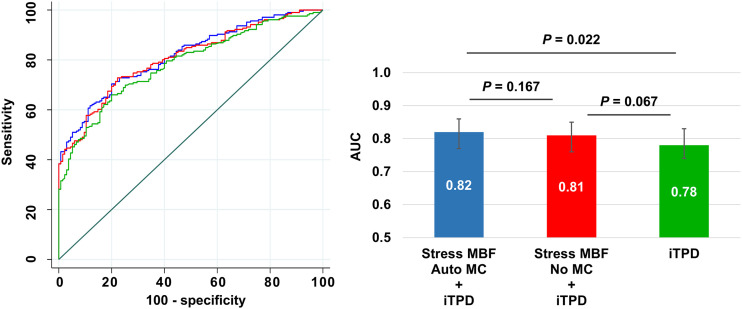
The addition of minimal vessel stress MBF with automated MC to the model with iTPD alone improved discrimination for predicting significant CAD (AUC, 0.82 vs. 0.78; P = 0.022), but the addition of stress MBF without MC to iTPD alone did not (AUC, 0.81 vs. 0.78; P = 0.067) (Fig. 6). Similar findings were observed when using minimal vessel MFR (Supplemental Fig. 6).
FIGURE 6.
Receiver operating characteristic curves (left) and AUC bar plots (right) for predicting significant CAD in angiographic group.
DISCUSSION
We developed an algorithm of automated MC for dynamic PET-MPI to improve the reliability of MBF measurements. We compared, for the first time to our knowledge, the diagnostic performance of MBF measurements with automated MC to those without MC. The main findings of this study are as follows: in the validation group, there were strong correlations and no significant difference between MBF measurements with automated and manual MC; in the angiographic group, MBF measurements decreased significantly after automated MC compared with those before MC; minimal vessel stress MBF with automated MC showed higher diagnostic performance for predicting significant CAD; and adding stress MBF with automated MC to the model with only iTPD significantly improved the diagnostic performance, but adding stress MBF without MC did not.
In the validation group, stress and rest MBF results with automated MC were strongly correlated with manual MC by experienced operators (r > 0.95), and there was no significant difference between those (P > 0.05). These results were in line with previous studies using automated MC by different software (9,10). In addition, the processing time of the automatic MC was shorter than that of the manual MC (<12 s vs. 10 min per case). Thus, MBF quantification using automatic MC software could be incorporated into clinical practice, reducing cardiovascular PET protocol complexity. Our algorithm performs the rigid-body translation. It is possible that excluding rotational correction may lead to suboptimal MC especially for the patients with rotational heart motion. However, the degree of rotational correction is usually small. In previous studies, it was reported to be less than 2° for over 90% of patients (21). It is unclear how the addition of rotational MC to a simple 3-dimensional translational MC affects the MBF measurements. Adding rotational correction may provide an optimal MC, especially for the patients with rotational motion of the heart; however, the addition of rotational correction is complicated and may not be suitable for MC in daily clinical settings because of time-consuming quality checks. The algorithm was designed to automate only the steps that are currently performed manually by the clinicians, so in the case of failure, they could be easily adjusted by a human operator. In the angiographic group, we compared MBF measurements before and after automated MC. Overall, MBF measurements with automated MC decreased significantly compared with those without automated MC, which is consistent with prior studies (3,4,9). The most significant changes in the MBF and MFR were in the RCA territory (Table 3), consistent with previous studies (4,9). The etiology of myocardial motion during dynamic scanning is considered to be primarily myocardial creep (22). Previous studies showed that up to 66% of patients undergoing pharmacologic stress dynamic PET-MPI showed significant myocardial motion (>5 mm) or myocardial creep during dynamic scans, primarily in the inferior direction (3–6). This largely inferior direction of myocardial motion, myocardial creep, could cause a spillover of blood-pool activity during the early phase into the LV myocardial contour and increase MBF measurements, especially in the RCA territory (23). In the present study, a trend similar to that in previous studies was shown (3–6); myocardial motion at stress in the inferior direction was greater than in the other directions, and 69% of patients showed significant myocardial motion at stress (>5 mm). Because MC had a greater impact on MBF measurements in patients with significant myocardial motion than in those without (Table 3), MC would be important, especially for the patients with significant myocardial motion (>5 mm), to obtain dependable MBF measurements.
A previous study demonstrated the feasibility of automated MC for MBF measurements on dynamic PET-MPI (9). In our study, we show, for the first time to our knowledge, that the diagnostic performance of stress MBF with automated MC for predicting significant CAD was significantly higher than without MC. The AUCs of minimal vessel stress MBF with automated MC were significantly higher than those without. The addition of stress MBF with automated MC to the model with iTPD alone showed significantly higher AUC, but the addition of stress MBF without MC to iTPD did not. There was significant difference between stress MBF with and without MC alone (AUC, 0.76 vs. 0.73; P = 0.047; Fig. 4). This seemingly minor difference would have a substantial impact on significant CAD prediction given the large number of PET-MPI studies performed. Because MBF measurements with automated MC showed a consistently higher diagnostic performance for predicting significant CAD than those without, MC should be considered an essential processing step when performing MBF measurements.
Although there is an inherent uncertainty of MBF measurements of approximately 20% (24), part of this variability is likely due to myocardial motion. In our population, 52 of 341 patients (15.2%) changed stress MBF by over 20% before and after the MC. Therefore, MC can potentially reduce the variability of MBF measurements.
Our study results should be interpreted in the context of some limitations. Our MC algorithm was developed using 82Rb PET-MPI studies only; however, over 90% of cardiac PET studies in the U.S. use 82Rb for PET-MPI (25). This MC algorithm has been evaluated with a compartmental modeling approach. The effect of this approach has not been evaluated for net retention models. Because we defined significant CAD only by the visual assessment on ICA, some patients without significant stenosis (<70%) may have physiologically significant CAD and some with at least 70% stenosis may not (26,27), and the use of flow fractional reserve values may be more accurate for assessing physiologically significant CAD. In addition, patients without significant stenosis may have impaired stress MBF and MFR due to coronary microvascular disease (28). Finally, because our study is a single-center retrospective study, it may have an inherent selection bias, and our results may not generalize to other populations.
CONCLUSION
An automated MC algorithm for dynamic PET-MPI showed good agreement with manual MC by experienced operators. Compared with MBF measurements without MC, those with MC were significantly decreased and had a consistently higher diagnostic performance for predicting significant CAD. Automated MC can be performed rapidly to obtain reliable MBF measurements; therefore, it should be incorporated into routine PET-MPI studies to reduce the complexity of cardiovascular protocols.
DISCLOSURE
This research was supported in part by grant R01EB034586 from the National Institute of Biomedical Imaging and Bioengineering at the National Institutes of Health (to Piotr Slomka) and a grant from the Dr. Miriam and Sheldon G. Adelson Medical Research Foundation. The content is solely the responsibility of the authors and does not necessarily represent the official views of the National Institutes of Health. Daniel Berman, Piotr Slomka, Serge Van Kriekinge, and Paul Kavanagh participate in software royalties for QPET software at Cedars-Sinai Medical Center. Daniel Berman is a consultant for GE Healthcare. Piotr Slomka received grants from Siemens Medical Systems and consulting fees from Synektik, S.A. No other potential conflict of interest relevant to this article was reported.
KEY POINTS
QUESTION: What is the effect of the automatic MC algorithm for MBF measurements of PET on the diagnostic performance of MBF for predicting CAD?
PERTINENT FINDINGS: For the first time to our knowledge, we demonstrated that stress MBF with automated MC had significantly higher diagnostic performance in predicting significant CAD than without the MC.
IMPLICATIONS FOR PATIENT CARE: MC for MBF measurements can be performed fully automatically, and MBF with automated MC has better diagnostic performance than without. Therefore, this approach should be incorporated into routine PET-MPI studies.
REFERENCES
- 1. Uren NG, Melin JA, De Bruyne B, Wijns W, Baudhuin T, Camici PG. Relation between myocardial blood flow and the severity of coronary-artery stenosis. N Engl J Med. 1994;330:1782–1788. [DOI] [PubMed] [Google Scholar]
- 2. Votaw JR, Packard RRS. Technical aspects of acquiring and measuring myocardial blood flow: method, technique, and QA. J Nucl Cardiol. 2018;25:665–670. [DOI] [PMC free article] [PubMed] [Google Scholar]
- 3. Lee BC, Moody JB, Poitrasson-Rivière A, et al. Blood pool and tissue phase patient motion effects on 82rubidium PET myocardial blood flow quantification. J Nucl Cardiol. 2019;26:1918–1929. [DOI] [PMC free article] [PubMed] [Google Scholar]
- 4. Koenders SS, van Dijk JD, Jager PL, Ottervanger JP, Slump CH, van Dalen JA. Impact of regadenoson-induced myocardial creep on dynamic rubidium-82 PET myocardial blood flow quantification. J Nucl Cardiol. 2019;26:719–728. [DOI] [PMC free article] [PubMed] [Google Scholar]
- 5. von Felten E, Benetos G, Patriki D, et al. Myocardial creep-induced misalignment artifacts in PET/MR myocardial perfusion imaging. Eur J Nucl Med Mol Imaging. 2021;48:406–413. [DOI] [PMC free article] [PubMed] [Google Scholar]
- 6. van Dijk JD, Jager PL, Ottervanger JP, Slump CH, van Dalen JA. No need for frame-wise attenuation correction in dynamic rubidium-82 PET for myocardial blood flow quantification. J Nucl Cardiol. 2019;26:738–745. [DOI] [PubMed] [Google Scholar]
- 7. Koenders SS, van Dijk JD, Jager PL, Ottervanger JP, Slump CH, van Dalen JA. How to detect and correct myocardial creep in myocardial perfusion imaging using rubidium-82 PET? J Nucl Cardiol. 2019;26:729–734. [DOI] [PMC free article] [PubMed] [Google Scholar]
- 8. Otaki Y, Van Kriekinge SD, Wei C-C, et al. Improved myocardial blood flow estimation with residual activity correction and motion correction in 18F-flurpiridaz PET myocardial perfusion imaging. Eur J Nucl Med Mol Imaging. 2022;49:1881–1893. [DOI] [PubMed] [Google Scholar]
- 9. Lee BC, Moody JB, Poitrasson-Rivière A, et al. Automated dynamic motion correction using normalized gradient fields for 82rubidium PET myocardial blood flow quantification. J Nucl Cardiol. 2020;27:1982–1998. [DOI] [PMC free article] [PubMed] [Google Scholar]
- 10. Choueiry J, Mistry NP, Beanlands RSB, deKemp RA. Automated dynamic motion correction improves repeatability and reproducibility of myocardial blood flow quantification with rubidium-82 PET imaging. J Nucl Cardiol. 2023;30:1133–1146. [DOI] [PubMed] [Google Scholar]
- 11. Miller RJH, Han D, Singh A, et al. Relationship between ischaemia, coronary artery calcium scores, and major adverse cardiovascular events. Eur Heart J Cardiovasc Imaging. 2022;23:1423–1433. [DOI] [PubMed] [Google Scholar]
- 12. Nakazato R, Berman DS, Dey D, et al. Automated quantitative Rb-82 3D PET/CT myocardial perfusion imaging: normal limits and correlation with invasive coronary angiography. J Nucl Cardiol. 2012;19:265–276. [DOI] [PMC free article] [PubMed] [Google Scholar]
- 13. Rajaram M, Tahari AK, Lee AH, et al. Cardiac PET/CT misregistration causes significant changes in estimated myocardial blood flow. J Nucl Med. 2013;54:50–54. [DOI] [PubMed] [Google Scholar]
- 14. Slomka PJ, Dey D, Przetak C, Aladl UE, Baum RP. Automated 3-dimensional registration of stand-alone 18F-FDG whole-body PET with CT. J Nucl Med. 2003;44:1156–1167. [PubMed] [Google Scholar]
- 15. Dekemp RA, Declerck J, Klein R, et al. Multisoftware reproducibility study of stress and rest myocardial blood flow assessed with 3D dynamic PET/CT and a 1-tissue-compartment model of 82Rb kinetics. J Nucl Med. 2013;54:571–577. [DOI] [PubMed] [Google Scholar]
- 16. Murthy VL, Naya M, Taqueti VR, et al. Effects of sex on coronary microvascular dysfunction and cardiac outcomes. Circulation. 2014;129:2518–2527. [DOI] [PMC free article] [PubMed] [Google Scholar]
- 17. DeLong ER, DeLong DM, Clarke-Pearson DL. Comparing the areas under two or more correlated receiver operating characteristic curves: a nonparametric approach. Biometrics. 1988;44:837–845. [PubMed] [Google Scholar]
- 18. Murthy VL, Bateman TM, Beanlands RS, et al. Clinical quantification of myocardial blood flow using PET: joint position paper of the SNMMI Cardiovascular Council and the ASNC. J Nucl Med. 2018;59:273–293. [DOI] [PubMed] [Google Scholar]
- 19. McNemar Q. Note on the sampling error of the difference between correlated proportions or percentages. Psychometrika. 1947;12:153–157. [DOI] [PubMed] [Google Scholar]
- 20. Pereztol-Valdés O, Candell-Riera J, Santana-Boado C, et al. Correspondence between left ventricular 17 myocardial segments and coronary arteries. Eur Heart J. 2005;26:2637–2643. [DOI] [PubMed] [Google Scholar]
- 21. Nye JA, Piccinelli M, Hwang D, et al. Dynamic cardiac PET motion correction using 3D normalized gradient fields in patients and phantom simulations. Med Phys. 2021;48:5072–5084. [DOI] [PMC free article] [PubMed] [Google Scholar]
- 22. Votaw JR, Packard RRS. Motion correction to enhance absolute myocardial blood flow quantitation by PET. J Nucl Cardiol. 2020;27:1114–1117. [DOI] [PubMed] [Google Scholar]
- 23. Armstrong IS, Memmott MJ, Saint KJ, Saillant A, Hayden C, Arumugam P. Assessment of motion correction in dynamic rubidium-82 cardiac PET with and without frame-by-frame adjustment of attenuation maps for calculation of myocardial blood flow. J Nucl Cardiol. 2021;28:1334–1346. [DOI] [PubMed] [Google Scholar]
- 24. Kitkungvan D, Johnson NP, Roby AE, Patel MB, Kirkeeide R, Gould KL. Routine clinical quantitative rest stress myocardial perfusion for managing coronary artery disease: clinical relevance of test-retest variability. JACC Cardiovasc Imaging. 2017;10:565–577. [DOI] [PubMed] [Google Scholar]
- 25. Klein R, Celiker-Guler E, Rotstein BH, deKemp RA. PET and SPECT tracers for myocardial perfusion imaging. Semin Nucl Med. 2020;50:208–218. [DOI] [PubMed] [Google Scholar]
- 26. Pijls NH, De Bruyne B, Peels K, et al. Measurement of fractional flow reserve to assess the functional severity of coronary-artery stenoses. N Engl J Med. 1996;334:1703–1708. [DOI] [PubMed] [Google Scholar]
- 27. Bech GJ, De Bruyne B, Pijls NH, et al. Fractional flow reserve to determine the appropriateness of angioplasty in moderate coronary stenosis: a randomized trial. Circulation. 2001;103:2928–2934. [DOI] [PubMed] [Google Scholar]
- 28. Mileva N, Nagumo S, Mizukami T, et al. Prevalence of coronary microvascular disease and coronary vasospasm in patients with nonobstructive coronary artery disease: systematic review and meta‐analysis. J Am Heart Assoc. 2022;11:e023207. [DOI] [PMC free article] [PubMed] [Google Scholar]


