

Abstract

The thermostable four-coordinate divalent lanthanide (Ln) bis-amidinate complexes [Ln(Piso)2] (Ln = Tb, Dy; Piso = {(NDipp)2CtBu}, Dipp = C6H3iPr2-2,6) were prepared by the reduction of parent five-coordinate Ln(III) precursors [Ln(Piso)2I] (Ln = Tb, Dy) with KC8; halide abstraction of [Ln(Piso)2I] with [H(SiEt3)2][B(C6F5)] gave the respective Ln(III) complexes [Ln(Piso)2][B(C6F5)]. All complexes were characterized by X-ray diffraction, ICP-MS, elemental analysis, SQUID magnetometry, UV–vis-NIR, ATR-IR, NMR, and EPR spectroscopy and ab initio CASSCF-SO calculations. These data consistently show that [Ln(Piso)2] formally exhibit Ln(II) centers with 4fn5dz21 (Ln = Tb, n = 8; Dy, n = 9) valence electron configurations. We show that simple assignments of the f–d coupling to either L–S or J–s schemes are an oversimplification, especially in the presence of significant crystal field splitting. The coordination geometry of [Ln(Piso)2] is intermediate between square planar and tetrahedral. Projecting from the quaternary carbon atoms of the CN2 ligand backbones shows near-linear C···Ln···C arrangements. This results in strong axial ligand fields to give effective energy barriers to magnetic reversal of 1920(91) K for the Tb(II) analogue and 1964(48) K for Dy(II), the highest values observed for mononuclear Ln(II) single-molecule magnets, eclipsing 1738 K for [Tb(C5iPr5)2]. We tentatively attribute the fast zero-field magnetic relaxation for these complexes at low temperatures to transverse fields, resulting in considerable mixing of mJ states.
Introduction
Beyond the commonly observed traditional Ln(II) ions Sm(II), Eu(II), and Yb(II), complexes containing other Ln(II) ions are relatively rare because of their high Ln(III)/Ln(II) reduction potentials making them difficult to access and often resulting in thermally unstable complexes that can react with common organic solvents.1−3 However, over the last 25 years, Ln(II) complexes have been isolated for all Ln except radioactive Pm, and the ligand field has been shown to be key to dictating reduction potentials, thermal sensitivity, and whether 4fn+1 or 4fn5d1 valence electron configurations are formally adopted.4−18 Ln(II) complexes have already shown record-high magnetic susceptibilities,19 interesting single molecule magnet (SMM) behavior,15,20−23 and potential as spin qubits.24,25 The lower charge of Ln(II) ions allows charge balance to be achieved with fewer ligands relative to their Ln(III) counterparts; this is conducive to forming low-coordinate complexes, leading potentially to linear coordination geometries and strongly axial ligand fields.26 This has recently been exploited in the synthesis of a series of “linear” Ln(II) metallocenes [Ln(C5iPr5)2], which show relatively high thermal stabilities and formal 4fn5d1 configurations, common for most nontraditional Ln(II) ions.18,20 There remains a need to study further examples of Ln(II) complexes with other ligands to achieve a greater understanding of their electronic structure.
Lanthanide complexes have provided the best-performing SMMs to date27−29 due to their inherently high magnetic anisotropy and unquenched orbital moments arising from predominantly ionic Ln bonding.1 To achieve high energy barriers to magnetic reversal (Ueff) in Tb and Dy SMMs, axial ligand fields are required to stabilize the most magnetic mJ states while simultaneously destabilizing the least magnetic states.30 Prior to 2017, large Ueff values were achieved for axial Dy(III) SMMs, but these did not provide high temperatures for retention of magnetization (here we use T100, which is the temperature at which the magnetization relaxation time is equal to 100 s) as other relaxation processes such as Raman relaxation and quantum tunneling of magnetization (QTM) are efficient even when the overbarrier process is slow.27−29 In the last 6 years, highly axial Dy and Tb complexes containing substituted cyclopentadienyl ligands (CpR) and closely related charge-dense aromatic ligands have raised the temperature at which magnetization is retained to 72 K, and magnetic hysteresis (TH) has been seen up to 80 K;18,20,22,31−39 ligand rigidity has been proposed as a route to suppress Raman relaxation mechanisms.31,40−43 Again, this indicates that studies of different ligand sets are needed to test whether the rigidity is important.
Most investigations of Ln SMMs to date have focused on complexes containing Ln ions in the most common +3 oxidation state.27−29 The Kramers ion Tb(II) complex [Tb(C5iPr5)2] has Ueff = 1738 K, TH = 55 K, and T100 = 52 K.20 To the best of our knowledge, this is the only Ln(II) SMM to date with a measured energy barrier, and all these parameters are currently record-high values for any mononuclear Tb SMM;1−3 a Ueff value for the non-Kramers ion Dy(II) complex [Dy(C5iPr5)2] could not be determined.20 Conversely, the mixed-valent Ln complexes [Ln2(C5iPr5)2(μ-I)3] (Ln = Tb, Dy) exhibit one-electron Ln–Ln σ bonds, leading to large coercive fields and favorable SMM properties for both Tb and Dy; the Dy analog currently holds record values for Ueff (2347 K), TH (80 K), and T100 (72 K) among all SMMs.22
Amidinates ({(NR2)2CR}) and guanidinates ({(NR2)2CNR2}) have been used extensively as supporting ligands in Ln chemistry due to their ease of preparation and facile tunability to control metal coordination spheres;44 these ligands have recently delivered Dy(III) SMMs, namely, [Dy{(NiPr)2CN(SiMe3)2}2(μ-Cl)2Li(THF)2],45 [Dy{(NiPr)2CN(SiMe3)2}2(μ-Cl)]2,45 [Dy{(NiPr)2CMe}(C5Me5)(μ-Cl)}]2,46,47 [Dy{(NDipp)2CMe}(C5Me5)(Cl)(μ-Cl)Li(THF)3],47 and [Dy{(NiPr)2CN(SiMe3)2}2{(μ-Ph)BPh3}].48 We noted that the Ln(II) bis-guanidinate complexes [Ln(Priso)2] and [Ln(Giso)2] (Ln = Sm, Eu, Yb; Priso = {(NDipp)2CNiPr2}, Giso = {(NDipp)2CNiCy2}; Dipp = C6H3iPr2-2,6) are only four-coordinate,49,50 and reasoned that similar Tb(II/III) and Dy(II/III) complexes could exhibit interesting magnetic properties. As the related Ln(III) amidinate complex [Ce(Piso)2Cl] (Piso = {(NDipp)2CtBu}) was shown to be directly prepared from CeCl3,51 we opted to use Piso as a supporting ligand.
Here we report the synthesis of four-coordinate Ln(II) and Ln(III) bis-amidinate complexes for Ln = Tb and Dy. These complexes were characterized by X-ray diffraction, ICP-MS, elemental analysis, SQUID magnetometry, UV–vis-NIR, ATR-IR, NMR, and EPR spectroscopy. Complete active space self-consistent field spin–orbit (CASSCF-SO) calculations were performed to determine the electronic structures and to rationalize the experimental data. We find that the Ln(II) Piso complexes are remarkably thermostable and formally adopt 4fn5d1 valence electron configurations with significant 5d-6s mixing. We project model Hamiltonians from our ab initio calculations to highlight the difficulty in assigning compounds to L–S or J–s coupling schemes, especially on the basis of room-temperature magnetic moments. The strong axial crystal fields (CFs) in these complexes lead to them showing record Ueff values for Ln(II) SMMs, but we observe rapid Raman relaxation and QTM, giving low TH and T100 values. Although dramatic improvements in SMM behavior are not seen, these studies provide significant new insights into the electronic structures of exotic Ln(II) compounds.
Results and Discussion
Synthesis
The heteroleptic Ln(III) bis-amidinate iodide complexes [Ln(Piso)2I] (1-Ln, Ln = Tb, Dy) were prepared by the salt metathesis reactions of parent LnI352 with two equivalents of KPiso53 in toluene at reflux by modifying literature protocols51 (Scheme S1). The reactions of 1-Ln with the silylium reagent [H(SiEt3)2][B(C6F5)]54,55 in benzene gave the homoleptic separated ion-pair Ln(III) bis-amidinate complexes [Ln(Piso)2][B(C6F5)4] (2-Ln, Ln = Tb, Dy) (Scheme 1) by adapting procedures that were previously employed for the synthesis of [Dy(Cpttt)2][B(C6F5)4] (Cpttt = C5H2tBu3-1,2,4).31−33 The neutral homoleptic Ln(II) bis-amidinate complexes [Ln(Piso)2] (3-Ln, Ln = Tb, Dy) were synthesized by the reduction of 1-Ln with a small excess of KC8 in benzene (Scheme 1); orange crystals of 3-Ln were isolated in ca. 20% yields following workup and recrystallization from dark green pentane solutions at −35 °C (see Experimental Section: Synthesis for a more detailed description).
Scheme 1. Synthesis of 2-Ln and 3-Ln from 1-Ln (Ln = Tb, Dy).

Bulk Characterization
Samples of 1-Ln, 2-Ln, and 3-Ln were assessed by a variety of analytical techniques to give complementary data on the bulk purities of samples. Powder X-ray diffraction (PXRD) patterns obtained showed excellent agreement with models, with refinement analyses generally indicating high crystalline phase purities; the sample of 1-Dy analyzed was found to contain two polymorphs (see below), but quantitative analysis allowed their respective ratio to be determined precisely (Figures S64–S69). Elemental analysis results were generally in good agreement with expected values, although lower-than-expected carbon contents were consistently determined; this is attributed to incomplete combustion due to the formation of carbides under the experimental conditions employed.56 The lanthanide compositions determined by ICP-MS generally showed excellent agreement with expected values, with <6% differences between expected and found values for 2-Ln and 3-Ln (Table S44); these differences were slightly larger for 1-Ln, but the total uncertainty for these measurements is ∼15–20% due to possible matrix effects. Further to this, significant amounts of Dy were sometimes detected in Tb samples and vice versa. For example, 3-Tb and 2-Tb were found to contain 7 and 1 ppb of 163Dy, respectively, whereas 2 ppb of 159Tb was seen in 2-Dy. The amount of these trace impurities will inevitably vary between batches of Ln2O3 starting materials depending on the commercial source and between synthetic steps. Finally, the similarities of the vibrational modes of Tb/Dy pairs were shown by ATR-IR spectroscopy (Figures S17–S23). Together, these data, in combination with electronic spectra and magnetic susceptibility measurements, give confidence that the solid-state structures determined for 1-Ln, 2-Ln, and 3-Ln are representative of bulk samples (see below).
Structural Characterization
The solid-state structures of 1-Ln, 2-Ln, and 3-Ln were determined by single-crystal X-ray diffraction (see Figure 1 for depictions of 1-Dy, 2-Dy, and 3-Dy and Figures S56–S63 and Table 1 for other structures and metric parameters). Crystals of [Ln(Piso)2][B(C6F5)4] were unsolvated, whereas [Ln(Piso)2] contains stoichiometric pentane in the crystal lattice. Lattice toluene was also seen in crystals of [Ln(Piso)2I], although a solvent-free polymorph was also determined for [Dy(Piso)2I]; as both polymorphs were present in the PXRD pattern, we include both data sets, and as the metrical parameters of the complexes are similar, we only include the data of the solvent-free polymorph in Table 1 for brevity. Complexes 1-Ln are five-coordinate, with the Ln centers bound by one iodide and four N-donor atoms from the two Piso ligands (Figures S56 and S57). The coordination geometry is intermediate between trigonal bipyramidal and square pyramidal (τ5 = 0.87 for Tb and 0.88 for Dy). Complexes 2-Ln and 3-Ln are four-coordinate, with the Ln centers bound by the four N-donor atoms from the two Piso ligands (Figures S58–S61). In 2-Ln, the geometry is intermediate between tetrahedral and square planar (τ4 = 0.45 for 2-Tb and 0.47 for 2-Dy), whereas for 3-Ln, the coordination geometry is closer to square planar (τ4 = 0.27 for 3-Tb and 0.28 for 3-Dy).57 The XRD data sets obtained for the Ln(II) complexes 3-Ln each feature metal sites disordered over two positions; thus, we limit our discussion to the major (85–90%) components.
Figure 1.

Molecular structures of 1-Dy, 2-Dy, and 3-Dy, with selected atom labeling (counteranion not shown for 2-Dy). The displacement ellipsoids are set at the 50% probability level, and hydrogen atoms and lattice solvent are omitted for clarity. Key: Dy(III) = green, Dy(II) = purple, I = brown, N = blue, and C = gray.
Table 1. Selected Bond Distances (Å) and Angles (°) for 1-Ln, 2-Ln, and 3-Ln.
| Complex | 1-Dy | 1-Tb | 2-Dy | 2-Tb | 3-Dy | 3-Tb |
|---|---|---|---|---|---|---|
| N(1)-Ln(1) | 2.314(2) | 2.321(2) | 2.260(3) | 2.267(2) | 2.317(2) | 2.330(2) |
| N(2)-Ln(1) | 2.404(2) | 2.424(2) | 2.332(2) | 2.352(2) | 2.363(2) | 2.366(2) |
| N(3)-Ln(1) | 2.404(2) | 2.424(2) | 2.313(3) | 2.335(2) | 2.365(2) | 2.367(2) |
| N(4)-Ln(1) | 2.314(2) | 2.321(2) | 2.258(3) | 2.257(2) | 2.314(2) | 2.312(3) |
| I(1)-Ln(1) | 2.8918(2) | 2.9157(3) | ||||
| N(1)-Ln(1)-N(3) | 120.72(6) | 120.80(8) | 119.55(9) | 121.20(7) | 125.86(7) | 125.85(8) |
| N(1)-Ln(1)-N(4) | 122.26(10) | 122.43(13) | 118.90(9) | 119.85(7) | 155.90(9) | 156.09(10) |
| N(2)-Ln(1)-N(3) | 174.82(9) | 174.54(12) | 174.44(9) | 176.04(7) | 164.44(9) | 164.95(10) |
| N(2)-Ln(1)-N(4) | 120.73(9) | 120.81(8) | 118.52(9) | 119.50(7) | 129.42(8) | 129.14(9) |
| C(1)-Ln(1)-C(2) | 149.70(9) | 148.55(12) | 148.80(9) | 150.01(7) | 174.82(8) | 174.58(9) |
| τ5 (1-Ln); τ4 (2-3-Ln)a | 0.88 | 0.87 | 0.47 | 0.45 | 0.28 | 0.27 |
The values of τ4 will range from 1.00 for a perfect tetrahedral geometry to 0 for a perfect square planar geometry. Intermediate structures, including trigonal pyramidal and seesaw, fall within the range of 0 to 1.00. τ5 gives an index of the degree of trigonality. A trigonal bipyramidal structure with D3h symmetry has a τ5 = 1, whereas a square pyramidal structure with C4v symmetry has τ5 = 0.57
The Ln-I bond lengths in 1-Tb and 1-Dy are 2.916(1) and 2.892(1) Å, respectively. The LnN4 cores of 1-Ln are similar to those of 2-Ln, with the same τ4 values for each Ln pair (0.45 for 1-Tb and 2-Tb; 0.47 for 1-Dy and 2-Dy). Complexes 1-Ln and 2-Ln feature similar twist angles between LnN2C least squares planes: 66.79(7)° (1-Tb), 67.01(7)° (1-Dy), 70.10(7)° (2-Tb), and 69.90(9)° (1-Dy) (Tables S3 and S4), which are close to seesaw geometries. Both 1-Ln and 2-Ln exhibit two sets of interligand N–Dy–N angles, which fall between 118.52(9) and 122.43(13)° for one set and between 174.44(9) and 176.04(7)° for the other. The Ln–N bonds in 2-Ln range from 2.257(2) to 2.352(2) Å for 2-Tb and 2.258(3) to 2.332(2) Å for 2-Dy; these are shorter than those of 1-Ln, which range between 2.314(2) and 2.424(2) Å (Table 1), due to the variation in coordination number. It is intriguing that removing the iodide ligand has such a small effect on the metric parameters for the remaining N-Ln-N bond angles (Table 1).
The twist angles between LnN2C least squares planes in 3-Ln are 42.14(11)° (3-Tb) and 43.0(2)° (3-Dy). The two sets of interligand N–Ln–N angles in 3-Ln fall either between 125.85(8) and 129.42(8)° or between 155.90(9) and 164.95(10)°. The twist angles of 3-Ln are ca. 15° smaller than those of the related bis-guanidinate complex, [Yb(Giso)2] (57.00(9)°),50 but deviate more significantly from those of square planar [Ln(Giso)2] (Ln = Sm, 0.93(9)°; Eu, 1.21(10)°).50 This is attributed to the relatively short mean Ln–N distances for the later Ln (e.g., 2.344(4) Å for 3-Tb and 2.340(4) Å for 3-Dy, vs. 2.546(4) Å for [Sm(Giso)2]),50 leading to greater interligand repulsion. We note that the mean Ln–N distance in [Yb(Giso)2] (2.378(4) Å)50 is longer than that seen for 3-Tb and 3-Dy despite Yb being a smaller Ln; we posited that the discrepancy may be due to 3-Tb and 3-Dy having formal 4fn5d1 configurations, but we cannot make firmer conclusions from these data as both the ligand backbones and coordination geometries differ between these complexes. We therefore investigated the electronic structures of 3-Tb and 3-Dy further by other methods (see below).
Comparing the metric parameters for the three families of complexes, we find the following. The C(1)···Ln(1)···C(2) angles of the Ln(II) complexes 3-Tb (174.58(9)°) and 3-Dy (174.82(8)°) are close to linearity, whereas Ln(III) 1-Ln (Tb: 148.55(12)°; Dy: 149.70(9)°) and 2-Ln (Tb: 150.01(7)°; Dy: 148.80(9)°) are bent. As expected, there is a greater deviation in the ranges of Ln–N distances of 1-Ln (Tb: 2.321(2)–2.424(2) Å; Dy: 2.314(2)–2.405(2) Å) and 2-Ln (Tb: 2.257(2)–2.352(2) Å; Dy: 2.258(3)–2.332(2) Å) than those of 3-Ln (Tb: 2.312(3)–2.367(2) Å; Dy: 2.313(2)–2.365(2) Å). The two shortest Ln–N distances in 1-Ln and 2-Ln are mutually trans to each other (N–Ln–N: 1-Tb, 174.54(12)°; 1-Dy, 174.82(9)°; 2-Tb, 176.04(7)°; 2-Dy, 174.44(9)°), whereas all other interligand N–Ln–N angles for these complexes lie between 118.52(9) and 122.26(10)°. We attribute the geometrical differences in 1-Ln, 2-Ln, and 3-Ln to the greater electrostatic attraction of the ligands to smaller, more charge-dense Ln(III) vs Ln(II) centers.3 The electron-deficient Ln(III) centers of cationic 2-Ln exhibit additional strong electrostatic interactions with a single Piso methyl group (Ln···C = 3.136(3) Å for 2-Tb and 3.119(4) Å for 2-Dy), which is a common feature in low-coordinate Ln complexes.26
UV–Vis-NIR Spectroscopy
The UV–vis-NIR absorption spectra of separate solutions of KPiso and 1-Ln, 2-Ln, and 3-Ln were measured from 250 to 1000 nm (10,000–40,000 cm–1); benzene was used as the solvent for KPiso, 1-Ln, and 3-Ln, whereas DCM was required for the separated ion pairs 2-Ln (Figure 2 and Figures S24–S54). All complexes showed strong and sharp absorptions below 350 nm (ε > 5000 M–1 cm–1), which appear to be a feature intrinsic to both HPiso and KPiso (Figure S24) and likely arise from π to π* transitions in the ligand backbone. The Ln(III) complexes 1-Ln and 2-Ln are colorless, and their electronic absorption spectra are essentially featureless in the visible and NIR region, with no observable Laporte-forbidden f–f transitions.1 Solutions of the Ln(II) complexes 3-Tb and 3-Dy are dark green, and each shows two broad absorption bands stretching across most of the visible region; maxima are at ∼14,000 cm–1/∼700 nm (3-Tb, ε = 2100 M–1 cm–1; 3-Dy, ε = 2050 M–1 cm–1) and ∼22,000 cm–1/∼450 nm (3-Tb, ε = 3050 M–1 cm–1; 3-Dy, ε = 2800 M–1 cm–1), with the latter absorptions having shoulders at ∼350 nm bridging to π to π* transitions that are similar to those seen for 1-Ln and 2-Ln.
Figure 2.

Experimental UV–vis-NIR spectra of 0.2 mM solutions of 3-Ln (benzene), 2-Ln (DCM), 1-Ln (benzene), and KPiso (benzene) at room temperature; Ln = Dy (a) and Tb (b).
UV–vis-NIR spectroscopy was used to further probe the stability of 3-Ln in a range of solvents (Figures S51–S52), as Tb(II) and Dy(II) complexes are often thermally unstable.1−3,58 THF solutions of 3-Ln both turn from green to colorless within several seconds at room temperature, likely due to the highly reducing Ln(II) centers promoting the ring-opening of THF;10 the resultant UV–vis-NIR spectra are essentially featureless >350 nm, in common with the Ln(III) complexes 1-Ln and 2-Ln. In contrast, dark green solutions of 3-Ln in hexane, benzene, and diethyl ether are relatively stable and give strong broad absorptions >350 nm. The high thermostability of hexane solutions of 3-Ln was demonstrated by heating at 80 °C, first for 1 h and then for 15 h. The solutions maintained their green colors and gave UV–vis-NIR spectra with the same absorption features as fresh solutions but with lower extinction coefficients (Figures S53 and S54).
Magnetism
Static and dynamic magnetic susceptibility data were collected for microcrystalline samples of 1-Ln, 2-Ln, and 3-Ln suspended in eicosane (Figures 3 and 4, Figures S70–S149; Table 2). The magnetic susceptibility temperature product (χMT) was determined for 1-Ln, 2-Ln, and 3-Ln between 1.8 and 300 K under an applied dc field of 1000 Oe. The χMT products at 300 K of the Ln(III) complexes 1-Tb, 2-Tb, 1-Dy, and 2-Dy are 11.60, 11.27, 13.62, and 13.57 cm3 mol–1 K, respectively; these values are comparable to the corresponding expected free-ion χMT values for 4f8 Tb(III) (11.81 cm3 mol–1 K) and 4f9 Dy(III) (14.17 cm3 mol–1 K). The χMT values of 1-Dy and 2-Dy show little temperature dependence until a sharp drop below 8.0 and 3.8 K, respectively, likely as a result of slow magnetic dynamics (Figures S71 and S73). For 1-Tb and 2-Tb, there is a more substantial, yet still gradual, decrease in χMT as the temperature is reduced, although neither compound shows a precipitous drop at low temperature. Whereas 2-Tb exhibits a smooth downturn in χMT below ca. 20 K (Figures S70 and S72), the data for both 1-Tb and 2-Tb suggest that magnetic dynamics are faster than the timescale of the experiment.
Figure 3.

Plots of the natural log of the inverse relaxation time vs temperature for (a) powder and solution sample of 3-Tb under 0 Oe and (b) 3-Dy under 0 (circle points) and 1000 (square points) dc field (violet, purple, cyan, and green points are from ac data; orange and wine points are from dc data) at a temperature range from 2 to 150 K. (c) The enlarged scales of panel a from 60 to 120 K for 3-Tb. (d) The enlarged scales of panel b from 70 to 120 K for 3-Dy. The dashed orange, blue, and purple lines show isolated Orbach, Raman, and QTM fitting, respectively; black lines show their sum.
Figure 4.

Magnetization M (μB) vs applied dc field H (T) plots for (a) 3-Tb and (b) 3-Dy, at temperature (K) intervals between 2 and 30 K at an average sweep rate of 22 Oe/s, to show the shapes of hysteresis loops. (Inset) Expanded view of the variable-field magnetization near the zero field at 20 to 50 K.
Table 2. Magnetic Relaxation Parameters for 1-Ln, 2-Ln, and 3-Lna.
| complexes | Ueff (K) | log[τ0] (s) | log[C] (s–1 K–n) | n | log[τQTM] (s) |
|---|---|---|---|---|---|
| 1-Tbb (1500 Oe) | 491 ± 32 | –8.97 ± 0.37 | –1.81 ± 0.06 | 3.05 ± 0.05 | |
| 1-Dyb (0 Oe, slow) | 800 ± 16 | –11.80 ± 0.18 | –5.36 ± 0.09 | 4.50 ± 0.07 | 1.47 ± 0.02 |
| 1-Dyb (0 Oe, fast) | –4.36 ± 0.14 | 6.14 ± 0.12 | |||
| 2-Tbb (1500 Oe) | 725 ± 21 | –8.91 ± 0.16 | –2.34 ± 0.04 | 2.95 ± 0.03 | |
| 2-Dyb (0 Oe) | –2.14 ± 0.14 | 3.57 ± 0.09 | –1.26 ± 0.11 | ||
| 3-Tbb (0 Oe) | 1920 ± 91 | –10.93 ± 0.35 | –17.10 ± 1.96 | 9.52 ± 1.06 | 0.51 ± 0.02 |
| 3-Tbb (1500 Oe) | 1920d | –11.03 ± 0.04 | –7.63 ± 0.24 | 4.39 ± 0.16 | 3.25 ± 0.08 |
| 3-Tbc (0 Oe) | 1920d | –10.84 ± 0.04 | –14.84 ± 1.33 | 8.26 ± 0.72 | 1.02 ± 0.03 |
| 3-Dyb (0 Oe) | 1964 ± 48 | –11.10 ± 0.20 | –1.71 ± 0.02 | ||
| 3-Dyb (1000 Oe) | 1964d | –11.16 ± 0.03 | –4.28 ± 0.09 | 1.82 ± 0.06 | |
| 3-Dyc (0 Oe) | 1964d | –10.92 ± 0.04 | –1.44 ± 0.03 | ||
| 3-Dyc (1000 Oe) | 1964d | –10.94 ± 0.03 | –6.05 ± 0.12 | 2.58 ± 0.08 |
Obtained from fitting ac and dc
relaxation data with CC-FIT259,60 using the equation  to define the temperature dependence of
the relaxation time τ–1, where Ueff is the effective barrier to magnetic reversal, τ0 is the attempt time of the phonon bath, C and n define Raman relaxation, and τQTM is the QTM time scale.
to define the temperature dependence of
the relaxation time τ–1, where Ueff is the effective barrier to magnetic reversal, τ0 is the attempt time of the phonon bath, C and n define Raman relaxation, and τQTM is the QTM time scale.
Crystalline samples.
Solution samples.
Parameter value was fixed during fitting.
The Ln(II) complexes 3-Tb and 3-Dy show higher χMT products at 300 K than 1-Ln and 2-Ln for the respective ions (12.60 and 15.03 cm3 mol–1 K, respectively, Figures S74 and S75), which could be compared with free-ion χMT values for 4f9 Tb(II) (14.17 cm3 mol–1 K) and 4f10 Dy(II) (14.06 cm3 mol–1 K) electron configurations, indicating that a 4fn+1 electron configuration is not the best model for 3-Tb or 3-Dy. The 4fn5d1 configuration may be a better description for their electronic structures, and a detailed study of the electronic structure is discussed below. The χMT values of 3-Tb and 3-Dy decrease slowly with temperature from 300 to ca. 18 K and then fall sharply to reach 8.01 and 3.84 emu K mol–1, respectively, at 2 K. These data indicate that the Ln(II) complexes 3-Ln exhibit slower magnetization dynamics than the Ln(III) complexes 1-Ln and 2-Ln. The zero-field-cooled (ZFC) and field-cooled (FC) magnetic susceptibility traces support this assertion (Figures S76–S78), showing bifurcation at 17 K for 3-Tb and between 24 and 28 K for 3-Dy (Figures S79 and S80), whereas bifurcation occurs below 10 K for 1-Dy and below 5 K for 1-Tb, 2-Tb, and 2-Dy (Figures S76–78). Susceptibility measurements for solution samples of 3-Ln show ZFC-FC bifurcation at a higher temperature than in the solid state, between 30 and 40 K for 3-Tb and 48 K for 3-Dy (Figure S81).
The magnetic relaxation rates of 1-Ln, 2-Ln, and 3-Ln were probed by ac magnetic susceptibility
and dc magnetization decay experiments. Ac data were fitted with a
generalized Debye model,27 and dc magnetization
decay data were fitted with a stretched exponential model, both in
CC-FIT2,59,60 unless stated otherwise. The temperature
dependence of magnetic relaxation in SMMs is generally described with
the equation  , which encompasses three terms: the overbarrier
Orbach mechanism (where Ueff is the effective
barrier to magnetic reversal and τ0 is the attempt
time of the phonon bath), the through-barrier two-phonon Raman mechanism
(phenomenological parameters C and n), and τQTM as the QTM time scale. Functions of
this type were fitted using CC-FIT2,59,60 and the resulting
parameters and their estimated standard deviations (ESDs) are given
in Table 2.
, which encompasses three terms: the overbarrier
Orbach mechanism (where Ueff is the effective
barrier to magnetic reversal and τ0 is the attempt
time of the phonon bath), the through-barrier two-phonon Raman mechanism
(phenomenological parameters C and n), and τQTM as the QTM time scale. Functions of
this type were fitted using CC-FIT2,59,60 and the resulting
parameters and their estimated standard deviations (ESDs) are given
in Table 2.
For 1-Tb and 2-Tb, we observed efficient
QTM in zero dc field, attributed to the non-Kramers Tb(III) ion having
a nonzero splitting between the lowest-lying pseudodoublet states
(|+mJ > and |−mJ>). Under an optimum dc
field
of 1500 Oe (Figures S82–S83), we
could observe χm″ peaks between
6 and 42 K for 1-Tb (Figure S83) and up to 64 K for 2-Tb (Figure S87). In both cases, the magnetic relaxation rates were then
fitted with Orbach and Raman processes  ; Figures S127 and S129; Table 2). As relaxation
is rapid at higher temperatures for 1-Tb, the extracted Ueff value is less reliable. For 1-Dy, χm″ peaks were observed
under zero dc field between 6 and 42 K (Figures S84 and S85), and the rates fitted to Orbach and Raman processes
(Figure S128; Table 2). Meanwhile, for 2-Dy (where
χm″ peaks are observed under
zero dc field between 2 and 48 K (Figure S88) and are asymmetric and thus we fit these data with the Havriliak–Negami
model61), the rates appear to follow a
combination of Raman and QTM relaxation processes (
; Figures S127 and S129; Table 2). As relaxation
is rapid at higher temperatures for 1-Tb, the extracted Ueff value is less reliable. For 1-Dy, χm″ peaks were observed
under zero dc field between 6 and 42 K (Figures S84 and S85), and the rates fitted to Orbach and Raman processes
(Figure S128; Table 2). Meanwhile, for 2-Dy (where
χm″ peaks are observed under
zero dc field between 2 and 48 K (Figure S88) and are asymmetric and thus we fit these data with the Havriliak–Negami
model61), the rates appear to follow a
combination of Raman and QTM relaxation processes (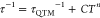 ; Figure S130; Table 2). Close
inspection might hint at an increase in relaxation rate at the highest
temperatures above the fitted Raman contribution, possibly suggesting
the onset of an Orbach process; however, this is obscured by an efficient
Raman process in this case.
; Figure S130; Table 2). Close
inspection might hint at an increase in relaxation rate at the highest
temperatures above the fitted Raman contribution, possibly suggesting
the onset of an Orbach process; however, this is obscured by an efficient
Raman process in this case.
For 3-Tb peaks in the
out-of-phase susceptibility,
χm″ peaks were observed between
116 and 65 K at frequencies from 0.1 to 1000 Hz, whereas for 3-Dy, peaks were observed between 116 and 2 K from 10 to 1000
Hz; however, below 88 K for 3-Dy, the χm″ peak maxima do not shift, indicative of
QTM (Figure S93). Hence, we also collected
ac susceptibility data for 3-Tb and 3-Dy under optimal 1500 and 1000 Oe dc fields (Figures S91, S96 and S99), respectively, showing that QTM is suppressed
for 3-Dy (Figure S96). In
the absence of isostructural diamagnetic hosts, we also collected
ac magnetic susceptibility data for frozen solutions of 3-Ln in hexane (50 mM) to reduce intermolecular dipolar interactions
that facilitate QTM. Regardless of using an applied dc field or the
solution samples, the relaxation rates in the high-temperature Orbach
regime agree with the respective microcrystalline solid samples, although
the frozen solution data are noisier because of the high dilution
(Figure 3 and Figures S133, S136, and S137). Hence, we have
fixed the Ueff value during fitting the
relaxation rates for the in-field and solution measurements to improve
the reliability of the fitted values. The relaxation rates for 3-Tb are best described by a combination of Orbach, Raman,
and QTM processes irrespective of a dc field or if in frozen solution
phase  ; Figure 3a,c, Figures S131–S133,Table 2). The fitted
values for the Raman parameters under a 1500 Oe dc field are significantly
different from those in zero field, which are likely due to the small
temperature range over which the Raman mechanism is observed in zero
field; hence, the values are more reliable when obtained at 1500 Oe.
Compound 3-Dy on the other hand shows no obvious Raman
process in zero dc field and so can be fitted with Orbach and QTM
processes alone
; Figure 3a,c, Figures S131–S133,Table 2). The fitted
values for the Raman parameters under a 1500 Oe dc field are significantly
different from those in zero field, which are likely due to the small
temperature range over which the Raman mechanism is observed in zero
field; hence, the values are more reliable when obtained at 1500 Oe.
Compound 3-Dy on the other hand shows no obvious Raman
process in zero dc field and so can be fitted with Orbach and QTM
processes alone 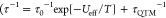 ; Figure 3b,d, Figures S134 and S136, Table 2), whereas
under a 1000 Oe field, there is no QTM process, and a Raman process
is now observed (
; Figure 3b,d, Figures S134 and S136, Table 2), whereas
under a 1000 Oe field, there is no QTM process, and a Raman process
is now observed (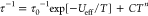 ; Figure 3b,d, Figures S135 and S137, Table 2).
Variable temperature magnetization vs dc field measurements of 1-Ln, 2-Ln, and 3-Ln were performed with field sweep rates of 22 Oe/s; all traces showed butterfly-shaped hysteresis loops at low temperatures, confirming efficient QTM at zero field (Figure 4 and Figures S138–S149). As expected,28 by 2 K, the hysteresis loops for the non-Kramers Tb(III) complexes 1-Tb and 2-Tb are closed in the zero field region, and these loops are only slightly open at higher fields at this temperature (Figures S144 and S146). The TH values of the Dy(III) complexes 1-Dy (Figure S145) and 2-Dy (Figure S147) are 10 and 4.5 K, respectively, which are substantially lower than the best-performing monometallic Dy(III) SMM to date, [Dy(C5iPr5)(C5Me5)][B(C6F5)4] (TH = 72 K).35 Hysteresis loops of 3-Tb and 3-Dy are already closed at zero field by 2 K for both powder and solution samples (Figure 4 and Figures S148 and S149).
EPR Spectroscopy
Continuous wave X-band (ca. 9.4 GHz) EPR spectra of polycrystalline samples of 2-Tb and 3-Tb at 5 K give similar spectra, differing only in intensity, with a near zero-field resonance (Figures S150 and S151). Given the relative stabilities of the Tb(III) and Tb(II) oxidation states, it seems likely that the resonance in the spectrum of 3-Tb arises from a minor impurity of [Tb(Piso)2]+ and that 3-Tb is otherwise EPR silent under these conditions. Given the non-Kramers nature of Tb(III) in 2-Tb, this would suggest a zero-field splitting in the ground pseudodoublet of 2-Tb of <0.4 cm–1. Complex 2-Dy also gives a very weak, but otherwise similar, spectrum to that of 2-Tb. Again, it seems likely that 2-Dy is EPR silent, and there is a trace impurity of [Tb(Piso)2]+ in this sample too (Figure S152); given the sensitivity of EPR spectroscopy and purity of reagent-grade lanthanide salts, it is not uncommon to detect impurities of other lanthanides in the host compound, and the ICP-MS data obtained on a sample of 2-Dy showed the presence of a trace amount of Tb (see above).
In contrast to the other samples, the X-band EPR spectrum of 3-Dy gives an intense low-field resonance that is quite different to the other spectra (Figure S153). This feature is also found at the S-band (ca. 3.9 GHz; Figure S154) but does not correspond to the same effective g-value as found at the X-band (measuring at the peak maximum), suggesting that it is a field-independent feature. Given the non-Kramers nature of Dy(II), it likely corresponds to a zero-field splitting in the ground pseudodoublet of <0.2 cm–1. Hence, it seems that 2-Dy is EPR silent whereas 3-Dy is EPR active under these conditions. We were unable to measure any significant EPR signals from frozen solutions at the X-band and 5 K: this is presumably due to the intrinsically weak spectra and the more dilute medium, but it is also possible that there are minor structural changes in the solution, for instance, a more axial geometry leading to less mixing of the non-Kramers pseudodoublets and hence weaker transition probabilities, that lead to less EPR intensity.
Ab Initio Calculations
We employed OpenMolcas62 to perform CASSCF-SO calculations on 1-Ln, 2-Ln, and 3-Ln using atomic coordinates obtained from single-crystal XRD to probe the electronic structures of these complexes (see SI for details). The electronic structure of the trivalent compounds 1-Ln and 2-Ln is well-approximated by standard minimal CASSCF-SO calculations (CAS(8,7)SCF for Tb(III) and CAS(9,7)SCF for Dy(III)), giving results that are typical for low-coordinate Tb(III) and Dy(III) compounds: here, the amidinate ligands function as strong axial pseudomonodentate donors, and the iodide anions in 1-Ln are considerably weaker donors (Tables S31 and S32 cf. Tables S33 and S34). The main difference between 1-Ln and 2-Ln is the presence or absence of the iodide ion, as the local geometries of the [Ln(Piso)2]+ fragments are similar. The ground (pseudo)doublets for 1-Tb, 2-Tb, 1-Dy, and 2-Dy are well described as mJ = ±6, ±6, ±15/2, and ±15/2, respectively, and are all quantized approximately parallel to the C(1)–C(2) vector (Figures S155–S158). All four compounds have large gaps to their first-excited states (313, 391, 233, and 269 cm–1, respectively); in both cases, these gaps are larger for 2-Ln than for 1-Ln, and the low-lying (pseudo)doublets have purer mJ wave functions in 2-Ln, where both features are expected as the competing equatorial CF influence of the iodide ion is absent.
To determine
the electronic structure of 3-Ln, we must carefully determine
the appropriate active space. We performed our tests on 3-Dy and started with a CAS(10,8)SCF calculation for 11 roots of the
high-spin S = 3 configuration, which would be appropriate
for the ground L = 5 (H) term assuming a 4f95d1 ground configuration with a nondegenerate 5d orbital.
After converging this calculation, we included the nine lowest-lying
unoccupied orbitals into a restricted active space allowing one excitation
out of the complete active space and performed a configuration interaction
(CI) calculation for 50 roots of the S = 3 spin states
(i.e., RAS(10;0/8/9;0,1)CI, where the first numeral indicates the
total number of active electrons, the slash-delimited triplet indicates
the sizes of the RAS1/RAS2/RAS3 subspaces, and the final numerals
indicate the excitations out of (into) RAS1(RAS3)). This showed 11
roots below 2700 cm–1 (arising from the 6H term of the 4f9 configuration), a further 7 roots between
8600 and 9600 cm–1 (arising from the 6F term of the 4f9 configuration), and the next excited
states lying above ca. 35,000 cm–1, thus confirming
a 4f95d1 configuration with a nondegenerate
5d orbital for the high-spin S = 3 state. The resulting
nondegenerate state-average (pseudonatural) orbital is dz2-like in appearance, with its axial lobes oriented perpendicular
to the C(1)–C(2) vector, and has a breakdown of 51% 5d and
17% 6s (determined using Lödwin orthogonalization, Figure 5 and Table S43), similar to that observed previously
in Ln(II) metallocene complexes.18,20 However, we
note that the orbital contribution is different when reported using
Mulliken partitioning onto atomic orbitals (giving 48% 5d and 47%
6s for the ground S = 3 root) and may then differ
depending on which spin-free root is interrogated.63 We subsequently performed CAS(10,8)SCF calculations for
18 roots for both the S = 3 and S = 2 states for 3-Dy using the original active space
(thus accounting for both 6H and 6F terms arising
from the 4f9 configuration), finding average orbital occupations
for both multiplicities corresponding to a 4f95d1 configuration and giving well-separated spin-free terms 7H (E < 2400 cm–1), 5H (4300 < E < 6200 cm–1), 7F (8400 < E < 9300 cm–1), and 5F (12,300 < E < 13,100
cm–1) before spin–orbit coupling, with no
indication of a 5I term arising from a possible 4f10 configuration. This confirms that the ground configuration
is indeed 4f95d1 and that the f–d coupling
obeys Hund’s rules, and further indicates that f–f interelectronic
repulsion > f–d coupling > CF splitting. To examine the
influence
of dynamic correlation on the electronic structure, we have also performed
multistate complete active space second-order perturbation theory
(CASPT2) calculations on the 18 roots of each multiplicity.64 Whereas the spread of each term is more or less
unchanged, the energy of the excited terms is significantly reduced:
the 5H term is lowered by ∼1000 cm–1 (3000 < E < 5000 cm–1),
the 7F term is lowered by ∼2000 cm–1 (6500 < E < 7600 cm–1),
and the 5F term is lowered by ∼3000 cm–1 (9300 < E < 10,100 cm–1), relative to the CASSCF results. This is due to a reduction in
the interelectron repulsion, i.e., reduced Slater integrals or Racah
parameters, for both 4f–4f and 4f–5d electron pairs.
Upon mixing all states under spin–orbit coupling (SOC), the
ground pseudodoublet (which has a tunnel splitting of 0.00002 cm–1 at the CASSCF-SO level or 0.0002 cm–1 at the CASPT2-SO level, as Dy(II) is non-Kramers) is dominated by
the first and second spin-free roots, meaning that it derives from
the 7H term. To interrogate the f–d coupling further,
we project the total ab initio Hamiltonian onto a
model space comprising of S5d = 1/2, S4f = 5/2, and L4f = 5; we do so by projecting the L4f =
5 (H) subspace from the spin-free CASSCF/CASPT2 Hamiltonians and thus
removing the L4f = 3 (F) content,65 which is justified as the f–f interelectronic
repulsion is greater than the f–d coupling here. Then we project
these reduced-dimension ab initio Hamiltonians onto
a model Hamiltonian accounting for f–d coupling, CF splitting
of the 4f states, and 4f SOC (eq 1, Tables S35 and 36, where the R̂ operators represent the spin of the 5d electron
(for which L5d = 0), the Ôqk operators are extended Stevens operators
that are polynomials of the 4f orbital angular momentum operators L̂, and the Ômn operators are extended Stevens operators that are
polynomials of the 4f spin angular momentum operators Ŝ; the θk are operator equivalent
factors).22,23,65−68 For the CASSCF-SO {CASPT2-SO} Hamiltonians, this projection gives
a root-mean-square (RMS) error of <0.4 {6.7} cm–1, indicating an excellent quality model. We find that the SOC constant
is λ = −396 {−396} cm–1, as
expected for a 4f9 configuration,22,23,66 but that it is smaller than the largest
f–d coupling terms that are dominated by the isotropic spin–spin
coupling, having an effective isotropic coupling parameter of Ω
= −1310 {−877} cm–1 ( for the effective operator ΩR̂ · Ŝ). The Ω
parameter being negative indicates the parallel alignment of the d
and f spin momenta (as discussed above) and allows us to give the
final ordering of energy scales as f–f interelectronic repulsion
> f–d coupling > SOC > CF splitting. There are several
other
significant anisotropic f–d coupling terms (Tables S35 and S36) that are all of a tripartite character
(effective operators like R̂αÔmnÔqk); most of these are isotropic in the spin–spin
part with even k and q (i.e., R̂αŜαÔqk), but
two are more complicated (R̂αÔ± 12Ô–25). Comparing
the CASSCF-SO and CASPT2-SO results, the isotropic spin–spin
coupling is reduced by a factor of 0.67, but the effect on the largest
tripartite terms is unpredictable: R̂αÔ± 12Ô–25 is not
affected at all, and R̂αŜαÔ–28 is increased
by 300%.
for the effective operator ΩR̂ · Ŝ). The Ω
parameter being negative indicates the parallel alignment of the d
and f spin momenta (as discussed above) and allows us to give the
final ordering of energy scales as f–f interelectronic repulsion
> f–d coupling > SOC > CF splitting. There are several
other
significant anisotropic f–d coupling terms (Tables S35 and S36) that are all of a tripartite character
(effective operators like R̂αÔmnÔqk); most of these are isotropic in the spin–spin
part with even k and q (i.e., R̂αŜαÔqk), but
two are more complicated (R̂αÔ± 12Ô–25). Comparing
the CASSCF-SO and CASPT2-SO results, the isotropic spin–spin
coupling is reduced by a factor of 0.67, but the effect on the largest
tripartite terms is unpredictable: R̂αÔ± 12Ô–25 is not
affected at all, and R̂αŜαÔ–28 is increased
by 300%.
Figure 5.

Singly degenerate 5d orbital for 3-Tb (left) and 3-Dy (right), calculated with CASSCF-SO, shown at an isosurface value of 0.04 au. The phases of the wave functions (colored lobes) are not observable and could be arbitrarily reversed.
 |
1 |
Given the structural and spectroscopic similarities of 3-Dy and 3-Tb, we proceed to calculate the electronic structure
for 3-Tb assuming a 4f85d1 ground
configuration. Analogously, we perform CAS(9,8)SCF calculations for
seven S = 3.5 and seven S = 2.5
roots, corresponding to the 8F and 6F terms
of Tb(II); the resulting nondegenerate state-average (pseudonatural)
orbital is 53% 5d and 16% 6s (using Lödwin orthogonalization, Figure 5 and Table S43), very similar to that found for 3-Dy (using Mulliken partitioning of the ground S = 3.5 root gives 51% 5d and 45% 6s). The 8F and 6F terms lie below 2500 cm–1 and above 4800
cm–1, respectively, which confirms that the 4f85d1 ground configuration obeys Hund’s rules.
Addition of CASPT2 corrections leads to a slight increase in the spread
of the 8F term (<2800 cm–1) and a
lowering of the 6F term (>3100 cm–1).22 To quantify the spin-coupling of
the electronic
states, we first mix the spin-free states with SOC and then project
the entire set of 98 ab initio SO states onto a model
Hamiltonian (eq 1, Tables S36 and 37) spanning S5d = 1/2, S4f = 3, and L4f = 3, giving an RMS error for the projection
of <0.3 cm–1 (for both CASSCF-SO and CASPT2-SO).
Similarly to 3-Dy, the SOC constant (λ = −297
cm–1, for both CASSCF-SO and CASPT2-SO) is as expected
for a 4f8 configuration,22,23,66 but it is smaller than the largest isotropic spin–spin
f–d coupling term, which has an effective isotropic coupling
parameter of Ω = −1334 {−857} cm–1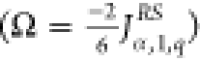 for CASSCF-SO {CASPT2-SO}. The ordering
of energy scales is therefore f–d coupling > SOC > CF
splitting
(we have not assessed the energy scale of the f–f interelectronic
repulsion in this case by examining only the 7F states
of the 4f8 subspace, although interelectronic repulsion
is exactly treated within the complete active space). Similarly as
for 3-Dy, there are several significant anisotropic tripartite
f–d coupling terms (Tables S36 and S37); again, most are isotropic in the spin–spin part with even k and q, but in this case, we see two terms
like R̂αÔ± 12Ô23. Comparing the CASSCF-SO and CASPT2-SO results,
the isotropic spin–spin coupling drops by a factor of 0.64,
very similar to the effect found for 3-Dy, and similarly,
some tripartite terms are not affected at all (R̂αÔ± 12Ô23), and yet R̂αŜαÔ–22 reduced by 96%. Curiously, the
more complicated terms that are unaffected by CASPT2 corrections have k = 3 for 3-Tb and k = 5 for 3-Dy, which match their respective values of L4f.
for CASSCF-SO {CASPT2-SO}. The ordering
of energy scales is therefore f–d coupling > SOC > CF
splitting
(we have not assessed the energy scale of the f–f interelectronic
repulsion in this case by examining only the 7F states
of the 4f8 subspace, although interelectronic repulsion
is exactly treated within the complete active space). Similarly as
for 3-Dy, there are several significant anisotropic tripartite
f–d coupling terms (Tables S36 and S37); again, most are isotropic in the spin–spin part with even k and q, but in this case, we see two terms
like R̂αÔ± 12Ô23. Comparing the CASSCF-SO and CASPT2-SO results,
the isotropic spin–spin coupling drops by a factor of 0.64,
very similar to the effect found for 3-Dy, and similarly,
some tripartite terms are not affected at all (R̂αÔ± 12Ô23), and yet R̂αŜαÔ–22 reduced by 96%. Curiously, the
more complicated terms that are unaffected by CASPT2 corrections have k = 3 for 3-Tb and k = 5 for 3-Dy, which match their respective values of L4f.
Discussion
The single-crystal XRD data collected for 2-Ln and 3-Ln show differences in metrical parameters that are consistent with the latter having Ln(II) centers with formal 4fn5d1 valence electron configurations. The mean Ln–N distances of 3-Tb (2.344(4) Å) and 3-Dy (2.340(4) Å), respectively, increase by 0.041 and 0.049 Å from the corresponding Ln(III) cations (2.303(3) Å for 2-Tb and 2.291(4) Å for 2-Dy). Similar trends have previously been observed for Ln(II)/Ln(III) pairs of both trigonal and axial CpR complexes; e.g., Ln(II) centers with formal 4fn5dz21 configurations in [Ln(Cp′)3]− (Cp′ = {C5H4SiMe3}) and [Ln(C5iPr5)2] show mean Ln···CpRcentroid distances that are 0.02–0.06 Å longer than their respective Ln(III) counterparts [Ln(Cp′)3]8 and [Ln(C5iPr5)2][B(C6F5)4].18 In contrast, the mean Ln···Cp′centroid distances of [Ln(Cp′)3]− anions for Ln(II) centers with 4fn+1 configurations are 0.123–0.156 Å longer than their corresponding parent Ln(III) [Ln(Cp′)3].7,8
The high energy absorptions in the visible absorption spectra of 3-Ln are consistent with those previously reported for the corresponding Tb(II) and Dy(II) complexes [K(2.2.2-crypt)][Ln(Cp′)3]7,8 and [Ln(C5iPr5)2]20 and are considered to be diagnostic of Ln(II) ions with 4fn5dz21 electronic configurations.9,10 Complexes 3-Ln show good thermal stability in solution, comparable to the axial Tb(II) and Dy(II) metallocenes [Ln(C5iPr5)2] that are stable in solutions at room temperature,18,20 which is an improvement over the vast majority of trigonal Tb(II) and Dy(II) complexes of the general formula [LnL3]− that often decompose above −30 °C.2,3,58
Counterintuitively, it seems that the Kramers systems 2-Dy and 3-Tb are EPR silent, whereas the non-Kramers
systems 3-Dy and 2-Tb are EPR active, as
measured from
polycrystalline samples at the X-band and 5 K. This can be rationalized
from the results of the CASSCF/CASPT2-SO calculations. For all four
complexes, the lowest pair of states (either a doublet or a pseudodoublet)
is isolated from the first excited pair of states by several hundred
cm–1 (Tables S33, S34, S39–S42); hence, any EPR transitions we are observing must be within the
ground (pseudo)doublet. The ground-state doublet of Kramers 2-Dy is found to be 99% pure mJ = ±15/2 with gx,y = 0 (Table S33) and therefore should
be EPR silent. For 3-Tb, we can use the projected model
parameters (see Ab Initio Calculations, above) to rebuild the Hamiltonian in an angular momentum
basis and obtain its eigenstates (Tables S39 and S40),22,23 showing that the ground doublet
of 3-Tb is ca. 98% mJ = ±13/2 from a J = 13/2 spin–orbit
multiplet, which would indeed be expected to be EPR silent. The very
low-field resonances of 3-Dy and 2-Tb show
that the bottom pair of states are indeed near-degenerate for these
non-Kramers systems given that the microwave energy in the X-band
EPR experiment is ca. 0.3 cm–1; this is consistent
with the magnetic data. The observation that the low-field resonances
do not behave as effective g-values when measured
at multiple microwave frequencies (Figures S153 and S154) indicates that the transitions are occurring within
a zero-field split pseudodoublet. Our CASSCF-SO calculations give
zero-field splittings of the order 10–5 to 10–4 cm–1, and although the accuracy
of such calculations cannot be trusted on this energy scale, they
do indicate a pseudodoublet ground state in both cases. Despite the
ground pseudodoublet of 2-Tb being well described as
100% mJ = ±6, the
fact that it is non-Kramers and the molecular structure has no symmetry
elements allows mixing between the two states and hence EPR intensity.69 This can be confirmed by calculating the magnetic
moment transition operator  , which is proportional to EPR
intensity)
between the two lowest-lying states with a 0.1 T field perpendicular
to the main anisotropy axis, giving ∼8
, which is proportional to EPR
intensity)
between the two lowest-lying states with a 0.1 T field perpendicular
to the main anisotropy axis, giving ∼8  for 2-Tb and ∼10–2
 for 2-Dy; thus, the expected
EPR intensity is nearly 3 orders of magnitude larger for the non-Kramers
ion than for its Kramers analogue despite both having quite pure mJ ground states. Hence, the
fact that 2-Tb and 3-Dy are non-Kramers
and that CASSCF-SO suggest pseudodoublets is consistent with the EPR
spectra.
for 2-Dy; thus, the expected
EPR intensity is nearly 3 orders of magnitude larger for the non-Kramers
ion than for its Kramers analogue despite both having quite pure mJ ground states. Hence, the
fact that 2-Tb and 3-Dy are non-Kramers
and that CASSCF-SO suggest pseudodoublets is consistent with the EPR
spectra.
The measured χMT products at 300 K for 3-Tb (12.60 cm3 mol–1 K) and 3-Dy (15.03 cm3 mol–1 K) are consistent with the corresponding values for the axial Ln(II) metallocenes [Tb(C5iPr5)2] (12.72 cm3 mol–1 K) and [Dy(C5iPr5)2] (15.15 cm3 mol–1 K)20 but differ from those for the trigonal planar [K(2,2,2-crypt)][Ln(Cp′)3] compounds (13.73 and 16.1 cm3 mol–1 K for Ln = Tb and Dy, respectively), which also formally exhibit 4fn5d1 valence electron configurations.19 It is commonplace in the literature to compare these data with values expected for different d–f coupling schemes to determine how the angular momenta couple.18,19 In the case of 4fn5d1 ground states with a nondegenerate d-orbital and where f–d coupling > SOC, one considers that the spin momenta couple first S⃗tot = S⃗4f + S⃗5d followed by coupling of the total spin to the orbital angular momentum J⃗tot = L⃗4f + S⃗tot (often called the L–S coupling scheme and herein referred to as the |Stot, Jtot, mJ⟩ basis). On the other hand, when the f–d coupling < SOC, then the angular momenta of the 4f shell could be considered to couple first J⃗4f = L⃗4f + S⃗4f followed by coupling to the 5d spin momentum J⃗tot = J⃗4f + S⃗5d (often called the J–s coupling scheme and herein referred to as the |J4f, Jtot, mJ⟩ basis). For Tb(II) and Dy(II) under the assumption of “ferromagnetic” f–d coupling (i.e., Hund’s rules are obeyed), both schemes lead to J = 13/2 and J = 8 ground multiplets, respectively, giving χMT values at 300 K of 14.43 and 17.02 cm3 mol–1 K, respectively. The only difference between the two schemes is the energy scale of the splitting to the first excited multiplet (J = 11/2 or 7, respectively), which would be set by either the SOC (when f–d coupling dominates, L–S scheme) or the f–d coupling (when SOC dominates, J–s scheme) (Figure 6). As the 4f SOC is an atomic parameter and should not be greatly perturbed by coordination chemistry or the presence of a 5d electron, it can be considered to be fixed so that the only variable is the f–d coupling strength. If the f–d coupling were vanishingly weak (implying the J–s scheme) such that at 300 K both the ground and first excited J multiplets are thermally populated, then the χMT values for Tb(II) and Dy(II) are 12.19 and 14.55 cm3 mol–1 K, respectively. However, both sets of values neglect CF splitting, and in fact, both coupling schemes are overly reductive: it is the combination of all terms in the Hamiltonian that determines the eigenstates (and therefore magnetic moments), and the reality is somewhere in between the two. This can be well illustrated by plotting the expected 300 K χMT values for 4f85d1 Tb(II) and 4f95d1 Dy(II) with fixed SOC constants of λ = −297 and −396 cm–1, respectively, and variable f–d coupling for a simple Hamiltonian (eq 2) (Figure 7). Although including an axial CF based on the CASSCF-SO-calculated CF parameters for 3-Ln reduces χMT by ca. 3–5% across the whole range of f–d coupling strengths, the overall behavior is unchanged, and there is a smooth transition between the two regimes where the curves plateau as f–d coupling ≈ SOC.
| 2 |
Figure 6.

Schematic for L–S (left) and J–s (right) coupling schemes, ignoring CF splitting; energies not to scale.
Figure 7.

χMT values at 300 K for 4f85d1 Tb(II) (red) and 4f95d1 Dy(II) (blue) as a function of the isotropic f–d coupling parameter Ω, assuming a nondegenerate 5d orbital. These curves are simulated using eq 2 with fixed λ = −297 and −396 cm–1 for Tb(II) and Dy(II), respectively. The dotted lines indicate where Ω = λ for each ion.
For 3-Tb and 3-Dy, the CASSCF-SO-calculated χMT values at 300 K are 14.01 and 16.44 cm3 mol–1 K, respectively, whereas the inclusion of dynamic correlation via CASPT2-SO calculations gives slightly reduced χMT values of 13.98 and 16.32 cm3 mol–1 K at 300 K, respectively. Based on the calculated values of Ω (from either CASSCF or CASPT2), both compounds are firmly in the f–d coupling > SOC regime; these calculated χMT values are reduced by ca. 3% from the simple predicted values owing to CF splitting. However, both are higher than the experimental values by approximately 1.4 cm3 mol–1 K. Although our CASPT2-SO calculations show that CASSCF-SO does indeed overestimate the f–d coupling by ca. 50%, this has only a marginal influence on the 300 K χMT value owing to the plateau on the right of Figure 7, hence the minimal change in calculated χMT with CASPT2-SO. This tends to suggest that there is some uncertainty in the experimental values, which is not uncommon for air-sensitive molecules such as these. In any case, the experimental results are clearly in between the two limits (Figure 7), so χMT on its own does not serve as a particularly useful measure to discriminate between the two regimes. To assess the coupling more directly, we can use the projected model parameters (see Ab Initio Calculations, above) to rebuild the Hamiltonian in either the |Stot, Jtot, mJ⟩ or the |J4f, Jtot, mJ⟩ basis and obtain its eigenstates (Tables S39 – S42).22,23 For 3-Dy, the lowest 17 states arise predominantly from the J = 8 ground multiplet, and there is no difference expressing this in either basis as J = 8 can only be obtained by “ferromagnetic” coupling of all angular momenta. However, the next lowest-lying pseudodoublet at 2713 cm–1 arises from the J = 7 multiplet and can be decomposed as either 78%|3,7, ± 7⟩ + 16%|2,7, ±7⟩ in the |Stot, Jtot, mJ⟩ basis or 48%|13/2,7, ±7⟩ + 46%|15/2,7, ±7⟩ in the |J4f, Jtot, mJ⟩ basis, showing that the L–S scheme is a better description. For 3-Tb, the lowest seven doublets arise predominantly from the J = 13/2 ground multiplet; however, in this case, there in non-negligible mixing from the J = 11/2 multiplet, and neither choice of basis is obviously the better description (although we have found that |Ω| > |λ|, which in a simplistic picture suggests an L–S description). Clearly, in the presence of significant CF effects, the reductive assignment of a coupling scheme is not particularly beneficial.
Comparing the CASSCF-SO calculated electronic states to dynamic magnetic measurements, 1-Dy appears to show Orbach relaxation over the third excited doublet at 847 K, cf. Ueff = 817(10) K. This SMM metric is far superior for 1-Dy compared to that for the closely related [Dy(Cpttt)2Cl] (Ueff = 56 K, τ0 = 5.1 × 10⁻⁶ s).40 There is no quantifiable Orbach region for 2-Dy, which appears to be due to more efficient Raman relaxation in this compound, and we note that the Raman exponent n is larger for both 1-Dy and 2-Dy than for the corresponding 1-Tb and 2-Tb compounds, explaining why the Orbach region is observed for 2-Tb but not 2-Dy. However, we cannot yet explain why the Dy(III) analogues show larger Raman exponents than their Tb(III) counterparts. The poor SMM properties of 2-Dy contrast with dysprosocenium complexes, [Dy(CpR)2][B(C6F5)4], which exhibit large Ueff and TH.31−35 The measured Ueff for 1-Tb appears to coincide with the first excited pseudodoublet (450 K vs Ueff = 483(232) K), whereas that for 2-Tb lies between the first and second excited pseudodoublets (563 and 1082 K vs Ueff = 714(154) K) and is the second-highest Ueff reported to date for any mononuclear Tb(III) SMM (cf. Ueff = 938 K for [Tb{(O-(C6H4)-p-tBu)8Pc}(Pc)], Pc = phthalocyanine).70 Compared to the similar terbocenium complexes, [Tb(CpR)2][B(C6F5)4],20,71 which do not have measurable energy barriers to magnetic reversal, 2-Tb is much improved. The measured Ueff values for 3-Ln (1920(91) K for 3-Tb and 1964(48) K for 3-Dy) are higher than any previously reported mononuclear Ln(II) SMMs, where the previous mononuclear Ln(II) record Ueff was held by [Tb(C5iPr5)2] (1738 K), whereas [Dy(C5iPr5)2] showed no obvious Orbach process.20 Using our CASSCF/CASPT2-SO-calculated electronic structures, we can build diagrams representing the magnetic relation barriers for 3-Tb and 3-Dy (Figures S159 – S162). The lowest-lying multiplet for 3-Dy is J = 8, and the splitting pattern shows that the lowest-lying states with small < Jz > projections are the third-excited pseudodoublets that lie at 1215 or ca. 1380 cm–1 (ca. 1750 and 1990 K, for CASSCF-SO and CASPT2-SO, respectively), the latter being in excellent agreement with the observed Ueff barrier. Although there are differences in the description of the eigenstates for 3-Tb whether we use the L–S or J–s basis, both show that the low-lying multiplet is dominated by J = 13/2 with substantial J = 11/2 mixing (Tables S39 and S40). The barrier for 3-Tb appears quite linear (Figures S159 and S160), in contrast to the often parabolic-like barriers observed for Dy(III) SMMs,31 and is reminiscent of that calculated for [Tb(C5iPr5)2].63 The results for CASSCF-SO and CASPT2-SO are very similar, and both show a total splitting of the J = 13/2 multiplet of ∼1900 cm–1 (2730 K), which is far larger than the observed Ueff barrier. This suggests that there is efficient thermally assisted QTM around the third or fourth excited doublet, which is where the mixing between the J = 13/2 and J = 11/2 becomes substantial. The high Ueff values for 3-Ln can be attributed to the Piso ligands being more charge-dense than CpR, giving rise to a stronger axial CF. However, the magnetic hysteresis loops for [Tb(C5iPr5)2] and [Dy(C5iPr5)2] remain open in the important zero-field region up to 55 and 10 K, respectively,20 whereas for 3-Tb and 3-Dy, they are already closed at zero field by 2 K. Similarly, for both 1-Tb and 2-Tb, there is no open hysteresis at 2 K observed, which likely arises from the non-Kramers nature of Tb(III). Similar observations have been made for the terbocenium complexes [Tb(Cpttt)2][B(C6F5)4]71 and [Tb(C5iPr5)2][B(C6F5)4]20 and other Tb(III) SMMs with large energy barriers, with Tb(III) substituted bis-phthalocyanine complexes achieving Ueff values up to 938 K.27−29,72,73 Only complexes 1-Dy and 2-Dy show open hysteresis loops, up to 10 and 4.5 K, respectively, but these are still far below the temperatures observed for the [Dy(CpR)2][B(C6F5)4] family (up to 80 K)31−35 or related heteroatom-substituted Dy(III) metallocenes.36−39 This can be attributed to faster Raman and/or QTM relaxation in 3-Ln and 2-Ln, which we suspect arises from the transverse fields imposed by the off-axis N-donor atoms and possibly the C-pπ and N-pπ orbitals,44 leading to stronger mixing of mJ states, along with more low-lying intramolecular vibrational modes involving the first coordination sphere as compared to the rigid cyclopentadienyl rings in [Ln(C5iPr5)2].18,20
Conclusions
We have reported straightforward synthetic routes to the first Tb(II) and Dy(II) amidinate complexes, [Ln(Piso)2]. The relatively high thermal stability of these complexes can be attributed to the near-linear C···Ln···C angles set between the Ln(II) centers and the CN2 backbones of the two amidinate ligands, together with the four N-donor atoms being positioned between tetrahedral and square planar geometries. The arrangement of ligands in [Ln(Piso)2] imposes strong axial crystal fields, leading to interesting electronic structures and magnetic properties. The combination of XRD, SQUID, UV–vis-NIR, and EPR spectroscopic data consistently shows that these complexes formally exhibit 4fn5dz21 valence electron configurations. The effective barriers to magnetic reversal shown by [Ln(Piso)2] provide new evidence for Ln(II) SMMs. However, we suspect that transverse fields introduced by the donation of electron density from off-axis N-donor atoms and the π-orbitals of CN2 backbones result in considerable mixing of mJ states and fast magnetic relaxation in zero field. The physical properties of [Ln(Piso)2] are best compared with the Ln(II) metallocenes [Ln(C5iPr5)2] for Ln = Tb and Dy,20 which also show strong axial ligand fields and 4fn5d1 configurations. However, differences between the ligand fields in these complexes provide some divergent properties, e.g., a high Ueff value for [Dy(Piso)2] vs no barrier observed for [Dy(C5iPr5)2], and no magnetic hysteresis above 2 K was seen for [Tb(Piso)2] at zero field vs open loops for [Tb(C5iPr5)2] up to 55 K.20 The faster Raman relaxation in [Tb(Piso)2] vs [Tb(C5iPr5)2] could be linked to the expected reduced rigidity of Piso compared to the CpR ring. These disparities reiterate that predicting and understanding the magnetic properties of Ln(II) complexes with formal 4fn5d1 valence electron configurations are currently nontrivial. These results emphasize that ligand donor properties and complex geometries are of equal importance in dictating both the thermal stability and SMM properties of nontraditional Ln(II) complexes. Given the large number of multidentate N-donor ligands with delocalized π-systems available to synthetic chemists, we anticipate that future studies of these systems should provide an extended family of thermostable Ln(II) SMMs and could also deliver new insights into the relationship between the lanthanide ligand field, electronic structure, and magnetic properties.
Experimental Section
General Methods
Dry toluene and pentane were obtained from a solvent purification system, where they were passed through columns containing alumina and molecular sieves and then stored over K mirrors. Benzene and hexane were dried by refluxing over potassium and were stored over K mirrors following distillation. Dichloromethane (DCM) was dried over CaH2 and was stored over 3 Å molecular sieves. All solvents were degassed before use. For NMR spectroscopy, C6D6 was dried by refluxing over K, and CD2Cl2 was dried by refluxing over CaH2. NMR solvents were vacuum transferred and degassed by three freeze–pump–thaw cycles before use. All experiments were performed under an atmosphere of dry argon with the rigid exclusion of air and moisture using standard Schlenk and glovebox techniques. 1H (400 MHz) and 13C{1H} (126 MHz), 11B{1H} (128 MHz) and 19F{1H} (376 MHz) NMR spectra were obtained on an Avance III 400 MHz spectrometer at 298 K. UV–vis-NIR spectroscopy was performed on samples in Youngs tap-appended 10 mm path length quartz cuvettes on an Agilent Technologies Cary Series UV–vis-NIR spectrophotometer from 175 to 3300 nm. ATR-IR spectra were recorded as microcrystalline powders by using a Bruker Alpha II spectrometer. Elemental analysis experiments were performed on a Flash 2000 elemental analyzer at the Microanalytical Service, Department of Chemistry, the University of Manchester. ICP-MS experiments were performed on an Agilent 8900 Triple Quadrupole ICP-MS housed in a class 1000 cleanroom, with sample preparation performed in a class 100 cleanroom. In each experiment, ca. 5–15 mg of sample was digested in 3 mL of concentrated HNO3(aq) by heating at 95 °C for 2 h. After acid digestion, 2000× dilution was performed with 2% HNO3(aq) to achieve a final concentration in the solution of ca. 1 ppm.
Single-Crystal XRD
The crystal data for 1-Ln, 2-Ln, and 3-Ln are compiled in Tables S1 and S2. Crystals of 1-Dy and 1-Tb were collected on an Oxford Diffraction SuperNova Atlas CCD diffractometer using mirror-monochromated Mo Kα radiation (λ = 0.71073 Å); 3-Dy was collected on a Rigaku FR-X diffractometer equipped with a Hypix 6000HE photon counting pixel array detector with mirror-monochromated Cu Kα (λ = 1.5418 Å) radiation; and 2-Dy, 2-Tb, and 3-Tb were collected on a Rigaku XtaLAB Synergy-DW VHF equipped with a HyPix-6000HE photon counting pixel array detector with mirror-monochromated Cu Kα (λ = 1.5418 Å) radiation. All data collections were performed at 100 K. The structures were solved by direct methods and were refined by full-matrix least-squares on all unique F2 values, with anisotropic displacement parameters for all non-hydrogen atoms and with constrained riding hydrogen geometries. CrysAlisPro74 was used for control and integration, and SHELXT75,76 was employed through OLEX277 for structure solution and refinement. DIAMOND was used for crystallographic images.78
Powder XRD
Microcrystalline samples of 1-Ln, 2-Ln, and 3-Ln were mounted on a goniometer head with a micromount using a minimum amount of Fomblin. X-ray diffraction data were collected at 100 K using a Rigaku FR-X rotating anode single-crystal X-ray diffractometer with Cu Kα radiation (λ = 1.5418 Å), a Hypix-6000HE detector, and an Oxford Cryosystems nitrogen flow gas system. The instrument was calibrated using silver behenate as standard. Data were collected between 3 and 70° 2θ, with a detector distance of 150 mm and a beam divergence of 1.5 mrad.79 CrysAlisPro74 was used to collect, reduce, and integrate XRD data. Pawley and Rietveld refinement was performed using the TOPAS software, with unit cells and structures obtained from single-crystal XRD analysis.80−82
Magnetic Measurements
Magnetic measurements were performed on a Quantum Design MPMS3 superconducting quantum interference device (SQUID) magnetometer. Samples of 1-Dy (28 mg), 2-Dy (27.1 mg), 3-Dy (25.8 mg), 1-Tb (29.1 mg), 2-Tb (24.2 mg), and 3-Tb (27.4 mg) were ground to powders, loaded in borosilicate glass NMR tubes, and covered in ground eicosane (19, 12.3, 9.8, 14.3, 10.2, and 11.1 mg, respectively) in a glovebox. The tubes were removed from the glovebox, kept under a protected atmosphere, and transferred onto a Schlenk line, where the eicosane powder was melted under an argon atmosphere. The tubes were flame-sealed to ∼3 cm under reduced pressure. Kapton tape was wrapped around the top of the tubes to hold them inside plastic straws by friction, and the straws were attached to the end of the sample rod. The raw data were corrected for the diamagnetic contribution of the sample holder and eicosane using calibrated blanks. The data were corrected for the sample shape using the Quantum Design MPMS3 Geometry Simulator, assuming a uniform cylinder of 4.06 mm diameter and 3.58 mm height. Finally, the data were corrected for the intrinsic diamagnetic contribution of the sample, estimated as the molecular weight (g/mol) multiplied by 0.5 × 10⁻⁶ cm3 mol–1 K. Further details of measurements are compiled in the Supporting Information.
EPR Spectroscopy
Continuous wave EPR spectra were recorded on a Bruker EMX300 spectrometer operating at the X-band (ca. 9.4 GHz) and on a Bruker ElexSys E580E SQFT spectrometer operating at the S-band frequency (ca. 3.8 GHz). Modulation amplitudes of 5 G were used at microwave powers of 2–20 mW. Spectra were recorded for samples of 3-Tb, 3-Dy, 2-Tb, and 2-Dy in the crystalline phase and of 1-Tb, 1-Dy, 3-Tb, and 3-Dy in frozen toluene/hexane (90:10) solutions (5 mM for 1-Tb, 1-Dy; 0.5 mM for 3-Tb, 3-Dy). Samples were prepared in quartz tubes under an inert atmosphere and flame-sealed.
CASSCF Calculations
CASSCF(-MSCASPT2)-SO calculations were carried out using the OpenMolcas program,62 version 21.06. All structures were taken from XRD without optimization. The basis sets were chosen from the ANO-RCC library:83,84 VTZP quality for lanthanide ions, VDZP for the nitrogen atoms located in the first coordination sphere, and VDZ for the rest of atoms. Cholesky decomposition of the two-election integrals was employed to reduce the computational demand with a threshold of 10–8. For Tb(III) calculations, we considered 7 septets, 140 quintets, 588 triplets, and 490 singlets in the orbital optimization and CI step, whereas 7 septets, 140 quintets, 195 triplets, and 197 singlets were mixed by spin–orbit coupling. For Dy(III) calculations, we considered 21 sextets, 224 quartets, and 490 doublets in the orbital optimization and CI step, whereas 21 sextets, 128 quartets, and 130 doublets were mixed by spin–orbit coupling. For Tb(II) calculations, we considered 7 octets and 7 sextets, and for Dy(II), we considered 18 septets and 18 quintets, in all steps. MSCASPT2 calculations were performed using an imaginary shift of 0.1 au. Projection of model Hamiltonian parameters was performed using molcas_suite,85 and construction of model Hamiltonians was performed using angmom_suite86 and PHI.87
Synthesis
Anhydrous TbI3 was purchased from Alfa Aesar and used as received. Anhydrous DyI3,52 KPiso,53 and [H(SiEt3)2][B(C6F5)4]54,55 were prepared according to literature methods.
[Tb(Piso)2I]·C7H8 (1-Tb)
TbI3 (1.080 g, 2.0 mmol) and KPiso (1.832 g, 4.0 mmol) were placed in a 200 mL Rotaflo stopcock-appended flask containing a glass-coated magnetic stirring bar. Toluene (50 mL) was added, and the reaction was heated gradually to 150 °C with vigorous stirring. After 5 days at 150 °C, the reaction mixture was allowed to cool to room temperature, filtered, and concentrated under a vacuum until a white precipitate formed (∼10 mL). The precipitate was redissolved by briefly heating the mixture to 100 °C. The flask was wrapped with Al foil and allowed to cool slowly to room temperature overnight to give colorless crystals of 1-Tb (crystal size ∼0.3 × 0.2 × 0.2 mm), which were isolated by filtration, washed with cold pentane (2 × 5 mL), and dried under a vacuum (1.46 g, 65%). Anal. Calcd for C61.5H90IN4Tb ([Tb(Piso)2I]·0.5C7H8): C, 63.07; H, 7.75; N, 4.78. Found: C, 62.42; H, 8.32; N, 5.01. 1H and 13C{1H} NMR spectra could not be interpreted. ATR-IR (microcrystalline, cm–1) ν̃ : 3059 (w), 2963 (s), 2932 (w), 2873 (w), 1460 (m), 1429 (m), 1396 (m), 1339 (s), 1305 (m), 1239 (w), 1204 (m), 1163 (m), 1100 (w), 1042 (w), 946 (m), 797 (m), 756 (s), 731 (m), 693 (w), 634 (w), 582 (w), 548 (w).
[Dy(Piso)2I]·C7H8 (1-Dy-I) and [Dy(Piso)2I] (1-Dy-II)
DyI3 (1.090 g, 2.0 mmol) and KPiso (1.832 g, 4.0 mmol) were placed in a 200 mL Rotaflo stopcock-appended flask containing a glass-coated magnetic stirring bar. Toluene (50 mL) was added, and the reaction was heated gradually to 150 °C with vigorous stirring. After 5 days at 150 °C, the reaction mixture was allowed to cool to room temperature, filtered, and concentrated under a vacuum until a white precipitate formed (∼10 mL). The precipitate was redissolved by briefly heating the mixture to 100 °C. The flask was wrapped with Al foil and allowed to cool slowly to room temperature overnight to give colorless crystals (crystal size ∼0.2 × 0.2 × 0.1 mm), which were confirmed to be the mixture of 1-Dy-I and 1-Dy-II. The crystals were isolated by filtration, washed with cold pentane (2 × 5 mL) and dried under a vacuum (0.81 g, 36%). Anal. Calcd for C65H94DyIN4 ([Dy(Piso)2I]·C7H8): C, 63.94; H, 7.76; N, 4.59. Found: C, 64.07; H, 7.86; N, 4.61. 1H and 13C{1H} NMR spectra could not be interpreted. ATR-IR (microcrystalline, cm–1) ν̃ : 3063 (w), 2957 (s), 2871 (m), 1618 (s), 1578 (m), 1458 (s), 1432 (s), 1392 (m), 1328 (s), 1247 (w), 1203 (w), 1170 (m), 1104 (w), 1048 (w), 935 (m), 802 (m), 757 (s), 715 (w).
[Tb(Piso)2][B(C6F5)4] (2-Tb)
A solution of [H(SiEt3)2][B(C6F5)4] (0.454 g, 0.5 mmol) in benzene (10 mL) was added dropwise to a stirred solution of 1-Tb (0.562 g, 0.5 mmol) in benzene (15 mL) at room temperature. The colorless reaction mixture was stirred for 48 h, forming a white precipitate. The volatiles were removed under a vacuum to give a white powder, which was washed with hexane (10 mL) and benzene (10 mL). The crude material was dissolved in DCM (5 mL), and the solution was layered with pentane (10 mL). Storage at room temperature overnight gave 2-Tb as colorless crystals (crystal size ∼0.3 × 0.2 × 0.1 mm). (0.253 g, 30%). Anal. Calcd for C82H86BF20N4Tb: C, 58.72; H, 5.17; N, 3.34. Found: C, 57.91; H, 5.17; N, 3.42. 1H and 13C{1H} NMR spectra could not be interpreted. 11B{1H} NMR (C6D6, 128 MHz): δ −14.07 (br). 19F{1H} NMR (C6D6, 376 MHz): δ −130.58 (br), −161.04 (br), −165.03 (br). ATR-IR (microcrystalline, cm–1) ν̃ : 2965 (m), 2871 (w), 1642 (m), 1509 (m), 1461 (s), 1344 (m), 1274 (w), 1207 (w), 1167 (w), 1082 (s), 975 (s), 800 (m), 760 (s), 725 (w), 685 (m), 664 (m), 607 (w), 573 (w).
[Dy(Piso)2][B(C6F5)4] (2-Dy)
A solution of [H(SiEt3)2][B(C6F5)4] (0.454 g, 0.5 mmol) in benzene (10 mL) was added dropwise to a stirred solution of 1-Dy (0.564 g, 0.5 mmol) in benzene (15 mL) at room temperature. The colorless reaction mixture was stirred for 48 h, forming a white precipitate. The volatiles were removed under a vacuum to give a white powder, which was washed with hexane (10 mL) and benzene (10 mL). The crude material was dissolved in DCM (5 mL) and layered with pentane (10 mL). Storage at room temperature overnight gave 2-Dy as colorless crystals (crystal size of ∼0.3 × 0.2 × 0.1 mm) (0.269 g, 32%). Anal. Calcd for C82H86BDyF20N4: C, 58.59; H, 5.16; N, 3.33. Found: C, 56.76; H, 5.00; N, 3.25. 1H and 13C{1H} NMR spectra could not be interpreted. 11B{1H} NMR (C6D6, 128 MHz): δ −22.22 (br). 19F{1H} NMR (C6D6, 376 MHz): δ −137.82 (br), −138.88 (br), −173.17 (br). ATR-IR (microcrystalline, cm–1) ν ∼ : 2972 (m), 2871 (w), 1642 (m), 1514 (m), 1461 (s), 1394 (w), 1336 (s), 1269 (w), 1207 (w), 1165 (m), 1084 (m), 975 (s), 805 (m), 760 (s), 720 (w), 682 (m), 665 (m), 613 (w), 571 (w).
[Tb(Piso)2]·C5H12 (3-Tb)
A solution of 1-Tb (1.125 g, 1 mmol) in benzene (40 mL) was added dropwise to a stirred solution of KC8 (0.149 g, 1.1 mmol) in benzene (20 mL) at room temperature. The reaction mixture was allowed to stir at 25 °C for 6 days (alternatively, the reaction can be expedited by heating at 60 °C for 3 days); the color gradually changed from colorless to green, and bronze KC8 slowly converted to black graphite. The solution was allowed to settle overnight and filtered to another flask. The solvent was removed under a vacuum, and the residue was extracted by stirring with hexane (25 mL) for 15 min. The solution was filtered, and hexane was removed under a vacuum. The green crude product was dissolved in 10 mL of pentane, concentrated to ∼3 mL under a vacuum, and stored at −35 °C. Orange crystals of 3-Tb formed after several days (crystal size ∼0.3 × 0.2 × 0.2 mm) (0.234 g, 22%). Anal. Calcd for C58H86N4Tb: C, 69.78; H, 8.68; N, 5.61. Found: C, 66.32; H, 8.58; N, 5.09. 1H and 13C{1H} NMR spectra could not be interpreted. UV–vis-NIR ύmax/ cm–1: ∼14,000 (ε = 2100 M–1 cm–1), ∼ 14,000 (ε = 3050 M–1 cm–1). ATR-IR (microcrystalline, cm–1) ν̃ : 3060 (w), 2959 (s), 2870 (m), 1615 (m), 1588 (s), 1456 (m), 1432 (s), 1384 (s), 1357 (s), 1315 (m), 1253 (m), 1204 (m), 1170 (s), 1097 (m), 1042 (m), 949 (m), 800 (s), 756 (s), 725 (w), 793 (w).
[Dy(Piso)2]·C5H12 (3-Dy)
A solution of 1-Dy (0.564 g, 0.5 mmol) in benzene (20 mL) was added dropwise to a stirred solution of KC8 (0.074 g, 0.55 mmol) in benzene (10 mL) at room temperature. The reaction mixture was allowed to stir at 25 °C for 6 days (alternatively, the reaction can be expedited by heating at 60 °C for 3 days); the color gradually changed from colorless to green, and bronze KC8 slowly converted to black graphite. The solution was allowed to settle overnight and filtered to another flask. The solvent was removed under a vacuum, and the residue was extracted by stirring with hexane (25 mL) for 15 min. The solution was filtered, and hexane was removed under a vacuum. The green crude product was dissolved in 10 mL of pentane, concentrated to ∼3 mL under a vacuum, and stored at −35 °C. Orange crystals of 3-Dy formed after several days (crystal size ∼0.2 × 0.2 × 0.1 mm) (0.103 g, 19%). Anal. Calcd for C58H86DyN4: C, 69.53; H, 8.65; N, 5.59. Found: C, 66.53; H, 8.54; N, 5.20. 1H and 13C{1H} NMR spectra could not be interpreted. UV–vis-NIR ύmax/ cm–1: ∼14,000 (ε = 2050 M–1 cm–1), ∼14,000 (ε = 2800 M–1 cm–1). ATR-IR (microcrystalline, cm–1) ν̃ : 3063 (w), 3020 (w), 2957 (s), 2877 (m), 1618 (w), 1586 (w), 1429 (s), 1388 (s), 1360 (s), 1314 (m), 1239 (m), 1203 (m), 1162 (s), 1104 (w), 1040 (w), 949 (m), 800 (m), 757 (s), 710 (w), 642 (w).
Acknowledgments
P.-B.J. and Q.-C.L. thanks the China Scholarship Council for a research scholarship. P.-B.J. thanks the Shaanxi Province postdoctoral research project (2023BSHYDZZ12). Y.-Z.Z. is grateful for the support of the National Natural Science Foundation of China (No. 22375157) and the Medical-Engineering Cross Project of the First Affiliated Hospital of XJTU (QYJC02). Y.-Z.Z. and P.-B.J. thank the Fundamental Research Funds for the Central Universities (xtr052023002 and xzy012023024). We thank the University of Manchester for access to the Computational Shared Facility. We acknowledge the UK Engineering and Physical Sciences Research Council (EPSRC) (EP/P001386/1 and EP/S033181/1) and European Research Council (ERC-2017-ADG-786734, ERC-2019-COG-816268, and ERC-2019-STG-851504) for funding. R.E.P.W. thanks the UK EPSRC for an Established Career Fellowship (EP/R011079/1), and N.F.C. thanks the Royal Society for a University Research Fellowship (URF191320). We thank the EPSRC UK EPR National Research Facility for access and the SQUID magnetometer (EP/W014521/1, EP/V035231/1, EPS033181/1). We would like to thank Anne Davies for collecting elemental analysis data and Hannah Redmill for sample preparation for ICP-MS and elemental analysis experiments.
Supporting Information Available
The Supporting Information is available free of charge at https://pubs.acs.org/doi/10.1021/jacs.3c07978.
Additional experimental details for physical and computational data associated with this manuscript (PDF)
The authors declare no competing financial interest.
Supplementary Material
References
- The Lanthanides and Actinides; Liddle S. T.; Mills D. P.; Natrajan L. S., Eds.; World Scientific Publishing Europe Ltd.: Singapore, 2022. [Google Scholar]
- Wedal J. C.; Evans W. J. A Rare-Earth Metal Retrospective to Stimulate All Fields. J. Am. Chem. Soc. 2021, 143 (44), 18354–18367. 10.1021/jacs.1c08288. [DOI] [PubMed] [Google Scholar]
- Evans W. J. The Importance of Questioning Scientific Assumptions: Some Lessons from f Element Chemistry. Inorg. Chem. 2007, 46 (9), 3435–3449. 10.1021/ic062011k. [DOI] [PubMed] [Google Scholar]
- Hitchcock P. B.; Lappert M. F.; Maron L.; Protchenko A. V. Lanthanum Does Form Stable Molecular Compounds in the + 2 Oxidation State. Angew. Chem., Int. Ed. 2008, 47 (8), 1488–1491. 10.1002/anie.200704887. [DOI] [PubMed] [Google Scholar]
- MacDonald M. R.; Ziller J. W.; Evans W. J. Synthesis of a Crystalline Molecular Complex of Y2+, [(18-crown-6)K][(C5H4SiMe3)3Y]. J. Am. Chem. Soc. 2011, 133 (40), 15914–15917. 10.1021/ja207151y. [DOI] [PubMed] [Google Scholar]
- MacDonald M. R.; Bates J. E.; Fieser M. E.; Ziller J. W.; Furche F.; Evans W. J. Expanding Rare-Earth Oxidation State Chemistry to Molecular Complexes of Holmium(II) and Erbium(II). J. Am. Chem. Soc. 2012, 134 (20), 8420–8423. 10.1021/ja303357w. [DOI] [PubMed] [Google Scholar]
- MacDonald M. R.; Bates J. E.; Ziller J. W.; Furche F.; Evans W. J. Completing the Series of + 2 Ions for the Lanthanide Elements: Synthesis of Molecular Complexes of Pr2+. Gd2+, Tb2+, and Lu2+. J. Am. Chem. Soc. 2013, 135 (26), 9857–9868. 10.1021/ja403753j. [DOI] [PubMed] [Google Scholar]
- Fieser M. E.; MacDonald M. R.; Krull B. T.; Bates J. E.; Ziller J. W.; Furche F.; Evans W. J. Structural, Spectroscopic, and Theoretical Comparison of Traditional vs Recently Discovered Ln2+ Ions in the [K(2.2.2-Cryptand)][(C5H4SiMe3)3Ln] Complexes: The Variable Nature of Dy2+ and Nd2+.. J. Am. Chem. Soc. 2015, 137 (1), 369–382. 10.1021/ja510831n. [DOI] [PubMed] [Google Scholar]
- Evans W. J. Tutorial on the Role of Cyclopentadienyl Ligands in the Discovery of Molecular Complexes of the Rare-Earth and Actinide Metals in New Oxidation States. Organometallics 2016, 35 (18), 3088–3100. 10.1021/acs.organomet.6b00466. [DOI] [Google Scholar]
- Woen D. H.; Evans W. J.. Chapter 293 - Expanding the + 2 Oxidation State to the Rare-Earth Metals, Uranium, and Thorium in Molecular Complexes. Handbook on the Physics and Chemistry of the Rare Earths Including Actinides. Bünzli J.-C. G.; Pecharsky V. K., Eds.; Elsevier B. V.: Amsterdam, 2016, 50, 337–394. [Google Scholar]
- Fieser M. E.; Palumbo C. T.; La Pierre H. S.; Halter D. P.; Voora V. K.; Ziller J. W.; Furche F.; Meyer K.; Evans W. J. Comparisons of lanthanide/actinide + 2 ions in a tris(aryloxide)arene coordination environment. Chem. Sci. 2017, 8 (11), 7424–7433. 10.1039/C7SC02337E. [DOI] [PMC free article] [PubMed] [Google Scholar]
- Jenkins T. F.; Woen D. H.; Mohanam L. N.; Ziller J. W.; Furche F.; Evans W. J. Tetramethylcyclopentadienyl Ligands Allow Isolation of Ln(II) Ions across the Lanthanide Series in [K(2.2.2-Cryptand)][(C5Me4H)3Ln] Complexes. Organometallics 2018, 37 (21), 3863–3873. 10.1021/acs.organomet.8b00557. [DOI] [Google Scholar]
- Huh D. N.; Ziller J. W.; Evans W. J. Isolation of Reactive Ln(II) Complexes with C5H4Me Ligands (CpMe) Using Inverse Sandwich Countercations: Synthesis and Structure of [(18-Crown-6)K(μ-CpMe)K(18-Crown-6)][CpMe3LnII] (Ln = Tb, Ho). Dalton Trans. 2018, 47 (48), 17285–17290. 10.1039/C8DT03890B. [DOI] [PubMed] [Google Scholar]
- Ryan A. J.; Darago L. E.; Balasubramani S. G.; Chen G. P.; Ziller J. W.; Furche F.; Long J. R.; Evans W. J. Synthesis, Structure, and Magnetism of Tris(amide) [Ln{N(SiMe3)2}3]1– Complexes of the Non-traditional + 2 Lanthanide Ions. Chem.—Eur. J. 2018, 24 (30), 7702–7709. 10.1002/chem.201800610. [DOI] [PubMed] [Google Scholar]
- Moehring S. A.; Beltrán-Leiva M. J.; Páez-Hernández D.; Arratia-Pérez R.; Ziller J. W.; Evans W. J. Rare-Earth Metal(II) Aryloxides: Structure, Synthesis, and EPR Spectroscopy of [K(2.2.2-cryptand)][Sc(OC6H2tBu2-2,6-Me-4)3]. Chem.—Eur. J. 2018, 24 (68), 18059–18067. 10.1002/chem.201803807. [DOI] [PubMed] [Google Scholar]
- Ryan A. J.; Ziller J. W.; Evans W. J. The Importance of the Counter-Cation in Reductive Rare-Earth Metal Chemistry: 18-Crown-6 Instead of 2,2,2-Cryptand Allows Isolation of [YII(NR2)3]1– and Ynediolate and Enediolate Complexes from CO Reactions. Chem. Sci. 2020, 11 (7), 2006–2014. 10.1039/C9SC05794C. [DOI] [PMC free article] [PubMed] [Google Scholar]
- Moehring S. A.; Miehlich M.; Hoerger C. J.; Meyer K.; Ziller J. W.; Evans W. J. A Room-Temperature Stable Y(II) Aryloxide: Using Steric Saturation to Kinetically Stabilize Y(II) Complexes. Inorg. Chem. 2020, 59 (5), 3207–3214. 10.1021/acs.inorgchem.9b03587. [DOI] [PubMed] [Google Scholar]
- McClain K. R.; Gould C. A.; Marchiori D. A.; Kwon H.; Nguyen T. T.; Rosenkoetter K. E.; Kuzmina D.; Tuna F.; Britt R. D.; Long J. R.; Harvey B. G. Divalent Lanthanide Metallocene Complexes with a Linear Coordination Geometry and Pronounced 6s–5d Orbital Mixing. J. Am. Chem. Soc. 2022, 144 (48), 22193–22201. 10.1021/jacs.2c09880. [DOI] [PubMed] [Google Scholar]
- Meihaus K. R.; Fieser M. E.; Corbey J. R.; Evans W. J.; Long J. R. Record High Single-Ion Magnetic Moments through 4fn5d1 Electron Configurations in the Divalent Lanthanide Complexes [(C5H4SiMe3)3Ln]−. J. Am. Chem. Soc. 2015, 137 (31), 9855–9860. 10.1021/jacs.5b03710. [DOI] [PubMed] [Google Scholar]
- Gould C. A.; McClain K. R.; Yu J. M.; Groshens T. J.; Furche F.; Harvey B. G.; Long J. R. Synthesis and Magnetism of Neutral, Linear Metallocene Complexes of Terbium(II) and Dysprosium(II). J. Am. Chem. Soc. 2019, 141 (33), 12967–12973. 10.1021/jacs.9b05816. [DOI] [PubMed] [Google Scholar]
- Moutet J.; Schleinitz J.; La Droitte L.; Tricoire M.; Pointillart F.; Gendron F.; Simler T.; Clavaguéra C.; Le Guennic B.; Cador O.; Nocton G. Bis-Cyclooctatetraenyl Thulium(II): Highly Reducing Lanthanide Sandwich Single-Molecule Magnets. Angew. Chem., Int. Ed. 2021, 60 (11), 6042–6046. 10.1002/anie.202015428. [DOI] [PMC free article] [PubMed] [Google Scholar]
- Gould C. A.; McClain K. R.; Reta D.; Kragskow J. G. C.; Marchiori D. A.; Lachman E.; Choi E. S.; Analytis J. G.; Britt R. D.; Chilton N. F.; Harvey B. G.; Long J. R. Ultrahard Magnetism from Mixed-Valence Dilanthanide Complexes with Metal-Metal Bonding. Science 2022, 375 (6577), 198–202. 10.1126/science.abl5470. [DOI] [PubMed] [Google Scholar]
- Gould C. A.; McClain K. R.; Reta D.; Kragskow J. G. C.; Marchiori D. A.; Lachman E.; Choi E. S.; Analytis J. G.; Britt R. D.; Chilton N. F.; Harvey B. G.; Long J. R. Erratum for the Report “Ultrahard Magnetism from Mixed-Valence Dilanthanide Complexes with Metal-Metal Bonding,” by C. A. Gould et al. Science 2023, 378 (6620), eadf5804. 10.1126/science.adf5804. [DOI] [PubMed] [Google Scholar]
- Ariciu A. M.; Woen D. H.; Huh D. N.; Nodaraki L. E.; Kostopoulos A. K.; Goodwin C. A. P.; Chilton N. F.; McInnes E. J. L.; Winpenny R. E. P.; Evans W. J.; Tuna F. Engineering Electronic Structure to Prolong Relaxation Times in Molecular Qubits by Minimising Orbital Angular Momentum. Nat. Commun. 2019, 10 (1), 3330. 10.1038/s41467-019-11309-3. [DOI] [PMC free article] [PubMed] [Google Scholar]
- Kundu K.; White J. R. K.; Moehring S. A.; Yu J. M.; Ziller J. W.; Furche F.; Evans W. J.; Hill S. A. 9.2-GHz Clock Transition in a Lu(II) Molecular Spin Qubit Arising from a 3,467-MHz Hyperfine Interaction. Nat. Chem. 2022, 14 (4), 392–397. 10.1038/s41557-022-00894-4. [DOI] [PubMed] [Google Scholar]
- Ortu F.; Mills D. P.. Chapter 306 - Low-Coordinate Rare-Earth and Actinide Complexes. Handbook on the Physics and Chemistry of the Rare Earths Including Actinides. Bünzli J.-C. G.; Pecharsky V. K., Eds.; Elsevier B. V.: Amsterdam, 2019, 55, 1–87. [Google Scholar]
- Molecular Nanomagnets; Gatteschi D.; Sessoli R.; Villain J., Eds.; Oxford University Press: Oxford, 2006. [Google Scholar]
- Lanthanides and Actinides in Molecular Magnetism; Layfield R. A.; Murugesu M., Eds.; Wiley: Hoboken, 2015. [Google Scholar]
- Giansiracusa M. J.; Gransbury G. K.; Chilton N. F.; Mills D. P.. Encyclopedia of Inorganic and Bioinorganic Chemistry; R. A. ScottJohn Wiley, 2021. [Google Scholar]
- Rinehart J. D.; Long J. R. Exploiting Single-Ion Anisotropy in the Design of f-Element Single-Molecule Magnets. Chem. Sci. 2011, 2 (11), 2078–2085. 10.1039/c1sc00513h. [DOI] [Google Scholar]
- Goodwin C. A. P.; Ortu F.; Reta D.; Chilton N. F.; Mills D. P. Molecular Magnetic Hysteresis at 60 K in Dysprosocenium. Nature 2017, 548 (7668), 439–442. 10.1038/nature23447. [DOI] [PubMed] [Google Scholar]
- Guo F. S.; Day B. M.; Chen Y. C.; Tong M. L.; Mansikkamäki A.; Layfield R. A. A Dysprosium Metallocene Single-Molecule Magnet Functioning at the Axial Limit. Angew. Chem., Int. Ed. 2017, 56 (38), 11445–11449. 10.1002/anie.201705426. [DOI] [PubMed] [Google Scholar]
- Guo F. S.; Day B. M.; Chen Y. C.; Tong M. L.; Mansikkamäki A.; Layfield R. A. Corrigendum: A Dysprosium Metallocene Single-Molecule Magnet Functioning at the Axial Limit. Angew. Chem., Int. Ed. 2020, 59 (43), 18844–18844. 10.1002/anie.202010617. [DOI] [PubMed] [Google Scholar]
- Randall McClain K.; Gould C. A.; Chakarawet K.; Teat S. J.; Groshens T. J.; Long J. R.; Harvey B. G. High-Temperature Magnetic Blocking and Magneto-Structural Correlations in a Series of Dysprosium(III) Metallocenium Single-Molecule Magnets. Chem. Sci. 2018, 9 (45), 8492–8503. 10.1039/C8SC03907K. [DOI] [PMC free article] [PubMed] [Google Scholar]
- Guo F. S.; Day B. M.; Chen Y. C.; Tong M. L.; Mansikkamäki A.; Layfield R. A. Magnetic Hysteresis up to 80 K in a Dysprosium Metallocene Single-Molecule Magnet. Science 2018, 362 (6421), 1400–1403. 10.1126/science.aav0652. [DOI] [PubMed] [Google Scholar]
- Evans P.; Reta D.; Whitehead G. F. S.; Chilton N. F.; Mills D. P. Bis-Monophospholyl Dysprosium Cation Showing Magnetic Hysteresis at 48 K. J. Am. Chem. Soc. 2019, 141 (50), 19935–19940. 10.1021/jacs.9b11515. [DOI] [PMC free article] [PubMed] [Google Scholar]
- Guo F.-S.; He M.; Huang G.-Z.; Giblin S. R.; Billington D.; Heinemann F. W.; Tong M.-L.; Mansikkamäki A.; Layfield R. A. Discovery of a Dysprosium Metallocene Single-Molecule Magnet with Two High-Temperature Orbach Processes. Inorg. Chem. 2022, 61 (16), 6017–6025. 10.1021/acs.inorgchem.1c03980. [DOI] [PMC free article] [PubMed] [Google Scholar]
- Vanjak J. C.; Wilkins B. O.; Vieru V.; Bhuvanesh N. S.; Reibenspies J. H.; Martin C. D.; Chibotaru L. F.; Nippe M. A High-Performance Single-Molecule Magnet Utilizing Dianionic Aminoborolide Ligands. J. Am. Chem. Soc. 2022, 144 (39), 17743–17747. 10.1021/jacs.2c06698. [DOI] [PubMed] [Google Scholar]
- Vincent A. H.; Whyatt Y. L.; Chilton N. F.; Long J. R. Strong Axiality in a Dysprosium(III) Bis(Borolide) Complex Leads to Magnetic Blocking at 65 K. J. Am. Chem. Soc. 2023, 145 (3), 1572–1579. 10.1021/jacs.2c08568. [DOI] [PMC free article] [PubMed] [Google Scholar]
- Goodwin C. A. P.; Reta D.; Ortu F.; Chilton N. F.; Mills D. P. Synthesis and Electronic Structures of Heavy Lanthanide Metallocenium Cations. J. Am. Chem. Soc. 2017, 139 (51), 18714–18724. 10.1021/jacs.7b11535. [DOI] [PubMed] [Google Scholar]
- Reta D.; Kragskow J. G. C.; Chilton N. F. Ab Initio Prediction of High-Temperature Magnetic Relaxation Rates in Single-Molecule Magnets. J. Am. Chem. Soc. 2021, 143 (15), 5943–5950. 10.1021/jacs.1c01410. [DOI] [PubMed] [Google Scholar]
- Garlatti E.; Chiesa A.; Bonfà P.; Macaluso E.; Onuorah I. J.; Parmar V. S.; Ding Y. S.; Zheng Y. Z.; Giansiracusa M. J.; Reta D.; Pavarini E.; Guidi T.; Mills D. P.; Chilton N. F.; Winpenny R. E. P.; Santini P.; Carretta S. A Cost-Effective Semi-Ab Initio Approach to Model Relaxation in Rare-Earth Single-Molecule Magnets. J. Phys. Chem. Lett. 2021, 12 (36), 8826–8832. 10.1021/acs.jpclett.1c02367. [DOI] [PMC free article] [PubMed] [Google Scholar]
- Chiesa A.; Cugini F.; Hussain R.; Macaluso E.; Allodi G.; Garlatti E.; Giansiracusa M. J.; Goodwin C. A. P.; Ortu F.; Reta D.; Skelton J. M.; Guidi T.; Santini P.; Solzi M.; De Renzi R.; Mills D. P.; Chilton N. F.; Carretta S. Understanding magnetic relaxation in single-ion magnets with high blocking temperature. Phys. Rev. B 2020, 101 (17), 174402 10.1103/PhysRevB.101.174402. [DOI] [Google Scholar]
- Edelmann F. T. Recent Progress in the Chemistry of Metal Amidinates and Guanidinates. Syntheses, Catalysis and Materials. Adv. Organomet. Chem. 2013, 61, 55–374. 10.1016/B978-0-12-407692-1.00002-3. [DOI] [Google Scholar]
- Jin P.-B.; Yu K.-X.; Zhai Y.-Q.; Luo Q.-C.; Wang Y.-D.; Zhang X.-F.; Lv Y.; Zheng Y.-Z. Chelating Guanidinates for Dysprosium(III) Single-Molecule Magnets. Chin. J. Chem. 2021, 39 (6), 1635–1640. 10.1002/cjoc.202100041. [DOI] [Google Scholar]
- Lv Z.-J.; Chai Z.-Q.; Zhu M.-M.; Wei J.-N.; Zhang W.-X. Selective Coupling of Lanthanide Metallacyclopropenes and Nitriles via Azametallacyclopentadiene and η2-Pyrimidine Metallacycle. J. Am. Chem. Soc. 2021, 143 (24), 9151–9161. 10.1021/jacs.1c03604. [DOI] [PubMed] [Google Scholar]
- Wang Y.-D.; Luo Q.-C.; Zhai Y.-Q.; Jin P.-B.; Fu Z.; Sun Q.; Li F.-N.; Zheng Y.-Z. Heteroleptic Dysprosium(III) Single-Molecule Magnets with Amidinate and Cyclopentadienyl Ligands. Cryst. Growth Des. 2022, 22 (11), 6398–6404. 10.1021/acs.cgd.2c00892. [DOI] [Google Scholar]
- Delano F. IV; Demir S. Guanidinate Rare-Earth Tetraphenylborate Complexes and Their Prospects in Single-Molecule Magnetism. Cryst. Growth Des. 2023, 23 (5), 3134–3143. 10.1021/acs.cgd.2c01258. [DOI] [Google Scholar]
- Heitmann D.; Jones C.; Mills D. P.; Stasch A. Low Coordinate Lanthanide(II) Complexes Supported by Bulky Guanidinato and Amidinato Ligands. Dalton Trans 2010, 39 (7), 1877–1882. 10.1039/b924367d. [DOI] [PubMed] [Google Scholar]
- Heitmann D.; Jones C.; Junk P. C.; Lippert K.-A.; Stasch A. Homoleptic Lanthanide(II)–Bis(Guanidinate) Complexes, [Ln(Giso)2] (Giso = [(ArN)2CN(C6H11)2]−, Ar = C6H3Pri2-2,6): Planar 4-Coordinate (Ln = Sm or Eu) vs Distorted Tetrahedral (Ln = Yb) Geometries. Dalton Trans 2007, 187–189. 10.1039/B614028A. [DOI] [PubMed] [Google Scholar]
- Dröse P.; Hrib C. G.; Hilpert L.; Edelmann F. T. Synthesis and Structure of a Rare Unsolvated Bis(amidinato) Lanthanide Chloride, (Piso)2CeCl (Piso = [tBuC(NAr)2]−, Ar = C6H3iPr2-2,6). Z. Anorg. Allg. Chem. 2011, 637 (1), 31–33. 10.1002/zaac.201000338. [DOI] [Google Scholar]
- Taylor M. D.; Carter C. P. Preparation of Anhydrous Lanthanide Halides, Especially Iodides. J. Inorg. Nucl. Chem. 1962, 24 (4), 387–391. 10.1016/0022-1902(62)80034-7. [DOI] [Google Scholar]
- Xia A.; El-Kaderi H. M.; Jane Heeg M.; Winter C. H. Synthesis, Structure, and Properties of Magnesium Complexes Containing Cyclopentadienyl and Amidinate Ligand Sets. J. Organomet. Chem. 2003, 682 (1–2), 224–232. 10.1016/S0022-328X(03)00787-3. [DOI] [Google Scholar]
- Stoyanov E. S.; Stoyanova I. V.; Reed C. A. The Basicity of Unsaturated Hydrocarbons as Probed by Hydrogen-Bond-Acceptor Ability: Bifurcated N–H+···π Hydrogen Bonding. Chem.—Eur. J. 2008, 14 (26), 7880–7891. 10.1002/chem.200800337. [DOI] [PMC free article] [PubMed] [Google Scholar]
- Lambert J. B.; Zhang S.; Ciro S. M. Silyl cations in the Solid and in Solution. Organometallics 1994, 13 (6), 2430–2443. 10.1021/om00018a041. [DOI] [Google Scholar]
- Gabbaï F. P.; Chirik P. J.; Fogg D. E.; Meyer K.; Mindiola D. J.; Schafer L. L.; You S.-L. An Editorial About Elemental Analysis. Organometallics 2016, 35 (19), 3255–3256. 10.1021/acs.organomet.6b00720. [DOI] [Google Scholar]
- Yang L.; Powell D. R.; Houser R. P. Structural Variation in Copper(I) Complexes with Pyridylmethylamide Ligands: Structural Analysis with a New Four-Coordinate Geometry Index, τ4. Dalton Trans. 2007, 9, 955–964. 10.1039/B617136B. [DOI] [PubMed] [Google Scholar]
- Moore W. N. G.; Ziller J. W.; Evans W. J. Optimizing Alkali Metal (M) and Chelate (L) Combinations for the Synthesis and Stability of [M(L)][(C5H4SiMe3)3Y] Yttrium(II) Complexes. Organometallics 2021, 40 (18), 3170–3176. 10.1021/acs.organomet.1c00379. [DOI] [Google Scholar]
- Reta D.; Chilton N. F. Uncertainty Estimates for Magnetic Relaxation Times and Magnetic Relaxation Parameters. Phys. Chem. Chem. Phys. 2019, 21, 23567–23575. 10.1039/C9CP04301B. [DOI] [PubMed] [Google Scholar]
- Blackmore W. J. A.; Gransbury G. K.; Evans P.; Kragskow J. G. C.; Mills D. P.; Chilton N. F. Characterisation of Magnetic Relaxation on Extremely Long Timescales. Phys. Chem. Chem. Phys. 2023, 25, 16735–16744. 10.1039/D3CP01278F. [DOI] [PMC free article] [PubMed] [Google Scholar]
- Topping C. V.; Blundell S. J. A.C. Susceptibility as a Probe of Low-Frequency Magnetic Dynamics. J. Phys.: Condens. Matter 2019, 31 (1), 013001 10.1088/1361-648X/aaed96. [DOI] [PubMed] [Google Scholar]
- Fdez Galván I.; Vacher M.; Alavi A.; Angeli C.; Aquilante F.; Autschbach J.; Bao J. J.; Bokarev S. I.; Bogdanov N. A.; Carlson R. K.; Chibotaru L. F.; Creutzberg J.; Dattani N.; Delcey M. G.; Dong S. S.; Dreuw A.; Freitag L.; Frutos L. M.; Gagliardi L.; Gendron F.; Giussani A.; González L.; Grell G.; Guo M.; Hoyer C. E.; Johansson M.; Keller S.; Knecht S.; Kovačević G.; Källman E.; Li Manni G.; Lundberg M.; Ma Y.; Mai S.; Malhado J. P.; Malmqvist P. Å.; Marquetand P.; Mewes S. A.; Norell J.; Olivucci M.; Oppel M.; Phung Q. M.; Pierloot K.; Plasser F.; Reiher M.; Sand A. M.; Schapiro I.; Sharma P.; Stein C. J.; Sørensen L. K.; Truhlar D. G.; Ugandi M.; Ungur L.; Valentini A.; Vancoillie S.; Veryazov V.; Weser O.; Wesołowski T. A.; Widmark P. O.; Wouters S.; Zech A.; Zobel J. P.; Lindh R. OpenMolcas: From Source Code to Insight. J. Chem. Theory Comput. 2019, 15 (11), 5925–5964. 10.1021/acs.jctc.9b00532. [DOI] [PubMed] [Google Scholar]
- Dubrovin V.; Popov A. A.; Avdoshenko S. Magnetism in Ln molecular systems with 4f/valence-shell interplay (FV-magnetism). Chem. Commun. 2019, 55, 13963–13966. 10.1039/C9CC06913E. [DOI] [PubMed] [Google Scholar]
- Finley J.; Malmqvist P.-Å.; Roos B. O.; Serrano-Andrés L. The Multi-State CASPT2Method. Chem. Phys. Lett. 1998, 288 (2–4), 299–306. 10.1016/S0009-2614(98)00252-8. [DOI] [Google Scholar]
- Li Manni G.; Fdez; Galván I.; Alavi A.; Aleotti F.; Aquilante F.; Autschbach J.; Avagliano D.; Baiardi A.; Bao J. J.; Battaglia S.; Birnoschi L.; Blanco-González A.; Bokarev S. I.; Broer R.; Cacciari R.; Calio P. B.; Carlson R. K.; Carvalho Couto R.; Cerdán L.; Chibotaru L. F.; Chilton N. F.; Church J. R.; Conti I.; Coriani S.; Cuéllar-Zuquin J.; Daoud R. E.; Dattani N.; Decleva P.; de Graaf C.; Delcey M. G.; De Vico L.; Dobrautz W.; Dong S. S.; Feng R.; Ferré N.; Filatov Gulak M.; Gagliardi L.; Garavelli M.; González L.; Guan Y.; Guo M.; Hennefarth M. R.; Hermes M. R.; Hoyer C. E.; Huix-Rotllant M.; Jaiswal V. K.; Kaiser A.; Kaliakin D. S.; Khamesian M.; King D. S.; Kochetov V.; Krośnicki M.; Kumaar A. A.; Larsson E. D.; Lehtola S.; Lepetit M.-B.; Lischka H.; López Ríos P.; Lundberg M.; Ma D.; Mai S.; Marquetand P.; Merritt I. C. D.; Montorsi F.; Mörchen M.; Nenov A.; Nguyen V. H. A.; Nishimoto Y.; Oakley M. S.; Olivucci M.; Oppel M.; Padula D.; Pandharkar R.; Phun Q. M.; Plasser F.; Raggi G.; Rebolini E.; Reihe M.; Rivalta I.; Roca-Sanjuán D.; Romig T.; Safari A. A.; Sánchez-Mansilla A.; Sand A. M.; Schapiro I.; Scott T. R.; Segarra-Martí J.; Segatta F.; Sergentu D.-C.; Sharma P.; Shepard R.; Shu Y.; Staab J. K.; Straatsma T. P.; So̷rensen L. K.; Cabral Tenorio B. N.; Truhlar D. G.; Ungur L.; Vacher M.; Veryazov V.; Voß T. A.; Weser O.; Wu D.; Yang X.; Yarkony D.; Zhou C.; Zobel J. P.; Lindh R. The OpenMolcas Web: A Community-Driven Approach to Advancing Computational Chemistry. J. Chem. Theory Comput. 2023, 19 (20), 6933–6991. 10.1021/acs.jctc.3c00182. [DOI] [PMC free article] [PubMed] [Google Scholar]
- Zhang P.; Nabi R.; Staab J. K.; Chilton N. F.; Demir S. Taming Super-Reduced Bi23– Radicals with Rare Earth Cations. J. Am. Chem. Soc. 2023, 145 (16), 9152–9163. 10.1021/jacs.3c01058. [DOI] [PMC free article] [PubMed] [Google Scholar]
- Ryabov I. D. On the Generation of Operator Equivalents and the Calculation of Their Matrix Elements. J. Magn. Reson. 1999, 140 (1), 141–145. 10.1006/jmre.1999.1783. [DOI] [PubMed] [Google Scholar]
- Iwahara N.; Chibotaru L. F. Exchange Interaction Between J Multiplets. Phys. Rev. B 2015, 91 (17), 174438 10.1103/PhysRevB.91.174438. [DOI] [Google Scholar]
- Ghosh S.; Datta S.; Friend L.; Cardona-Serra S.; Gaita-Ariño A.; Coronado E.; Hill S. Multi-Frequency EPR Studies of a Mononuclear Holmium Single-Molecule Magnet Based on the Polyoxometalate [HoIII(W5O18)2]9–. Dalton Trans. 2012, 41, 13697–13704. 10.1039/c2dt31674a. [DOI] [PubMed] [Google Scholar]
- Ganivet C. R.; Ballesteros B.; de la Torre G.; Clemente-Juan J. M.; Coronado E.; Torres T. Influence of Peripheral Substitution on the Magnetic Behavior of Single-Ion Magnets Based on Homo- and Heteroleptic TbIII Bis(Phthalocyaninate). Chem.—Eur. J. 2013, 19 (4), 1457–1465. 10.1002/chem.201202600. [DOI] [PubMed] [Google Scholar]
- Goodwin C. A. P.; Reta D.; Ortu F.; Liu J.; Chilton N. F.; Mills D. P. Terbocenium: Completing a Heavy Lanthanide Metallocenium Cation Family with an Alternative Anion Abstraction Strategy. Chem. Commun. 2018, 54, 9182–9185. 10.1039/C8CC05261A. [DOI] [PubMed] [Google Scholar]
- Ishikawa N.; Sugita M.; Ishikawa T.; Koshihara S.; Kaizu Y. Lanthanide Double-Decker Complexes Functioning as Magnets at the Single-Molecular Level. J. Am. Chem. Soc. 2003, 125, 8694–8695. 10.1021/ja029629n. [DOI] [PubMed] [Google Scholar]
- Ganivet C. R.; Ballesteros B.; de la Torre G.; Clemente-Juan J. M.; Coronado E.; Torres T. Influence of Peripheral Substitution on the Magnetic Behavior of Single-Ion Magnets Based on Homo- and Heteroleptic TbIII Bis(phthalocyaninate). Chem.—Eur. J. 2013, 19 (4), 1457–1465. 10.1002/chem.201202600. [DOI] [PubMed] [Google Scholar]
- CrysAlisPRO ver.39.27b, 2017 (Oxford Diffraction /Agilent Technologies UK Ltd.: Yarnton, England).
- Sheldrick G. M. SHELXT – Integrated Space-Group and Crystal-Structure Determination. Acta Crystallogr., Sect. A 2015, 71 (1), 3–8. 10.1107/S2053273314026370. [DOI] [PMC free article] [PubMed] [Google Scholar]
- Sheldrick G. M. Crystal Structure Refinement with SHELXL. Acta Crystallogr. Sect. C Struct. Chem. 2015, 71, 3–8. 10.1107/S2053229614024218. [DOI] [PMC free article] [PubMed] [Google Scholar]
- Dolomanov O. V.; Bourhis L. J.; Gildea R. J.; Howard J. A. K.; Puschmann H. OLEX2: A Complete Structure Solution, Refinement and Analysis Program. J. Appl. Crystallogr. 2009, 42 (2), 339–341. 10.1107/S0021889808042726. [DOI] [Google Scholar]
- Diamond-Crystal and Molecular Structure Visualization, ver. 4.6.6 (Eds Putz H.; Brandenburg K.) 2021. (Crystal Impact GbR: Bonn: ). [Google Scholar]
- Kabova E. A.; Blundell C. D.; Muryn C. A.; Whitehead G. F. S.; Vitorica-Yrezabal I. J.; Ross M. J.; Shankland K. SDPD-SX: Combining a Single Crystal X-Ray Diffraction Setup with Advanced Powder Data Structure Determination for Use in Early Stage Drug Discovery. CrystEngComm 2022, 24, 4337–4340. 10.1039/D2CE00387B. [DOI] [Google Scholar]
- Pawley G. S. Unit-Cell Refinement from Powder Diffraction Scans. J. Appl. Crystallogr. 1981, 14 (6), 357–361. 10.1107/S0021889881009618. [DOI] [Google Scholar]
- Rietveld H. M. A Profile Refinement Method for Nuclear and Magnetic Structures. J. Appl. Crystallogr. 1969, 2, 65–71. 10.1107/S0021889869006558. [DOI] [Google Scholar]
- Coelho A. A. An Indexing Algorithm Independent of Peak Position Extraction for X-Ray Powder Diffraction Patterns. J. Appl. Crystallogr. 2017, 50 (5), 1323–1330. 10.1107/S1600576717011359. [DOI] [Google Scholar]
- Roos B. O.; Lindh R.; Malmqvist P.-Å.; Veryazov V.; Widmark P.-O. Main Group Atoms and Dimers Studied with a New Relativistic ANO Basis Set. J. Phys. Chem. A 2004, 108 (15), 2851–2858. 10.1021/jp031064+. [DOI] [Google Scholar]
- Malmqvist P. A.; Roos B. O.; Schimmelpfennig B. The Restricted Active Space (RAS) State Interaction Approach with Spin–Orbit Coupling. Chem. Phys. Lett. 2002, 357 (15), 230–240. 10.1016/S0009-2614(02)00498-0. [DOI] [Google Scholar]
- https://gitlab.com/chilton-group/molcas_suite. Accessed June 2023.
- https://gitlab.com/chilton-group/angmom_suite. Accessed June 2023.
- Chilton N. F.; Anderson R. P.; Turner L. D.; Soncini A.; Murray K. S. PHI: A Powerful New Program for the Analysis of Anisotropic Monomeric and Exchange-Coupled Polynuclear d- and f-block Complexes. J. Comput. Chem. 2013, 34 (13), 1164–1175. 10.1002/jcc.23234. [DOI] [PubMed] [Google Scholar]
Associated Data
This section collects any data citations, data availability statements, or supplementary materials included in this article.