

Abstract
Three successive multiple generations of rats were exposed to different toxicants and then bred to the transgenerational F5 generation to assess the impacts of multiple generation different exposures. The current study examines the actions of the agricultural fungicide vinclozolin on the F0 generation, followed by jet fuel hydrocarbon mixture exposure of the F1 generation, and then pesticide dichlorodiphenyltrichloroethane on the F2 generation gestating females. The subsequent F3 and F4 generations and F5 transgenerational generation were obtained and F1–F5 generations examined for male sperm epigenetic alterations and pathology in males and females. Significant impacts on the male sperm differential DNA methylation regions were observed. The F3–F5 generations were similar in ∼50% of the DNA methylation regions. The pathology of each generation was assessed in the testis, ovary, kidney, and prostate, as well as the presence of obesity and tumors. The pathology used a newly developed Deep Learning, artificial intelligence-based histopathology analysis. Observations demonstrated compounded disease impacts in obesity and metabolic parameters, but other pathologies plateaued with smaller increases at the F5 transgenerational generation. Observations demonstrate that multiple generational exposures, which occur in human populations, appear to increase epigenetic impacts and disease susceptibility.
Keywords: Epigenetic, transgenerational, inheritance, sperm, vinclozolin, jet fuel, DDT, pathology, testis, obesity, review
Introduction
In addition to the classic genetic inheritance mechanism, we now know the environment can promote a non-genetic inheritance process termed epigenetic transgenerational inheritance [1, 2]. The ability of environmental factors such as nutrition, temperature, stress, and toxicants to promote the epigenetic transgenerational inheritance in all organisms examined, from plants to humans, has been observed [3]. As with genetic inheritance and DNA sequence, epigenetic inheritance requires the germline transmission of epigenetic information between generations [4]. The sperm and/or egg with environmentally responsive epigenetic factors can be passed to the zygote and subsequent embryonic totipotent stem cells to impact all subsequent somatic cell types to influence later life phenotypic variation and disease [4]. Although high-density CpG DNA methylation is erased during early embryonic development, the transgenerational DNA methylation regions (DMRs) are not erased and are retained to facilitate epigenetic inheritance [5]. All epigenetic mechanisms have been shown to be involved including DNA methylation, histone modification, non-coding RNA, and chromatin structure [6]. The initial observations were focused on DNA methylation in mammals [1]. One of the more common class of environmental exposures investigated has involved chemicals with an individual toxicant exposures assessed [2]. This includes the fungicide vinclozolin [1], pesticide DDT (dichlorodiphenyltrichloroethane) [7], herbicide glyphosate [8, 9], industrial contaminants jet fuel hydrocarbons [10], dioxins [11], and plastic-derived bisphenol A [12]. These individual toxicant exposures have promoted significant impacts on subsequent generations through epigenetic transgenerational inheritance mechanisms [2]. Since most natural populations are exposed generationally to different types of nutrition and toxicant exposures, the question raised is what are the impacts of successive generation distinct exposures?
One of the best examples of multiple generation impacts is contemporary human population exposures. One of the first agricultural compounds developed was DDT in the late 1940s and used extensively in agriculture, and to rid North America and Europe of malaria, in the 1950s and 1960s [13]. Plastic compound exposures and hydrocarbon oil spills and jet fuel exposures were initiated in the 1960s and 1970s. Subsequently, in the late 1970s, 1980s, 1990s, and 2000s, agricultural compounds such as the fungicide vinclozolin and herbicide glyphosate were introduced and persist today [14]. Since the 1950s, we now have four to five generations successively exposed to distinct environmental toxicants. Although the transgenerational actions of many of these individual toxicant exposures have been examined in mammalian models [15], the successive exposures of each generation have not been examined. Will the pathology and disease impact be comparable, additive, or differ due to each generation having a new distinct baseline exposure and epigenetics?
The current study experimental design used three successive generations of gestating female exposures during fetal gonadal sex determination, followed by three generations of no exposure to obtain the F5 generation to reveal the ultimate transgenerational phenotype for pathology and disease. The F0 generation gestating female was exposed to the agricultural fungicide vinclozolin, which is an anti-androgenic compound [16], and has been shown through a single exposure to promote the epigenetic transgenerational inheritance of disease and pathologies [1, 17]. Vinclozolin is used in the fruit and vegetable industry as a fungicide currently and was developed in the 1970s [18]. The second successive exposure of the F1 generation gestating female involved jet fuel (JP8) as an industrial hydrocarbon mixture, which is a toxicant that acts through the aryl hydrocarbon receptor (AHR) system. Jet fuel is used today and was introduced in the 1960s [19]. The toxicity of the hydrocarbon mixture jet fuel has been previously observed [20]. Jet fuel individually has also been demonstrated to promote the epigenetic transgenerational inheritance of a variety of pathologies and diseases [21]. The third successive exposure of the F2 generation-gestating female involved DDT. DDT is an estrogenic toxicant developed as a pesticide and used in agriculture in the 1950s–1970s in North America and still used in India and now Africa [22]. The issue with DDT is it has a half-life of 25 years, so it will persist in the environment for the next 500 years [23]. A single exposure of DDT has also been shown to promote the epigenetic transgenerational inheritance of disease and pathology phenotypes [24]. The question addressed in the current study is “what are the sequential impacts of multiple distinct exposures on the transgenerational disease and pathology phenotypes.” One of the reasons these three exposures were selected is each acts at distinct receptor systems with vinclozolin on the androgen receptor, jet fuel on the AHR receptor, and DDT on the estrogen receptor [15]. Therefore, a potential greater chance of additive or distinct forms of toxicity can be assessed. The question was if the multiple exposures would become additive or plateau in regards to the sperm epigenetics and adult pathologies.
Previously, the integrated actions of DNA methylation, ncRNA, and histone modifications have been shown to be involved in epigenetic transgenerational inheritance [6]. This appears to involve ncRNA-directed DNA methylation and DNA methylation actions on histone retention and modifications in sperm [6]. Although the current study focused on the DNA methylation of sperm, all epigenetic mechanisms are anticipated to be involved. Previously, a number of different environmental toxicants have been shown to promote epigenetic transgenerational inheritance of pathology and disease through exposure-specific epigenetic alterations in the sperm [15]. Although similar disease is induced, the associated epigenetic alterations are exposure-specific and subsets of a larger set of DNA methylation associations with disease [15]. Therefore, exposure- and disease-specific epigenetic biomarkers appear to exist, and subsets of epigenetic alterations within a larger disease-associated gene set appear to be involved with epigenetically inherited disease etiology observed [15]. Considering these previous observations with individual exposures, the current study investigated the influence of successive distinct toxicant exposures, which may develop additive or unique epigenetic alterations or pathology. All the previous pathologies associated with individual toxicant exposure were investigated and the effects with obesity had the highest levels of multigenerational impacts transgenerationally. Observations help elucidate the effects of several known multiple distinct environmental exposures that occurred in the human population and other species.
Results
The experimental design involved the successive exposure of multiple generations to environmental toxicants followed by multiple unexposed multigenerational and transgenerational generations, Fig. 1A. The exposures for the F0, F1, and F2 generation females involved gestating females using daily intraperitoneal (IP) injections during fetal days E8–E14 of embryonic development, which correspond to the gonadal sex determination period of development, to impact the germ-cell epigenetics. The daily IP injection for the F0 generation involved the anti-androgenic fungicide vinclozolin (100 mg/kg BW/day), which has a 25 mg/kg lowest observable adverse effect level (LOAEL) [25]. The F1 generation exposure involved the hydrocarbon mixture jet fuel (JP8) (500 mg/kg BW/day), which has a 1000 mg/kg/day LOAEL [26]. The F2 generation exposure involved the pesticide DDT (25 mg/kg/day), which has a 20 mg/kg BW/day LOAEL [27]. The subsequent unexposed F3, F4, and F5 generations were generated (Fig. 1A). All animals were aged to 1 year of age to collect sperm from the males for epigenetic analysis and to perform pathology analysis on both males and females. Pathology for the male evaluated the testis, prostate, kidney, and metabolic parameters of obesity. Pathology for the females evaluated the ovary, kidney, and metabolic parameters of obesity. The analysis involved generational comparisons to assess the impacts of multigeneration exposures on epigenetics and pathology. There were approximately 16 breeding pairs for each generation to maintain animal number to avoid any inbreeding. The number of offspring for each generation was approximately 130 with 50% male and female ratio. The number of animals for each generation pooled for the molecular analysis were 5–7 F1 generation, 7–9 F2 generation, 6–9 F3 generation, 9–10 F4 generation, and 8–9 F5 generation for a total of 6 pools for each generation epigenetic analysis. This reflects total animals for F1–36, F2–48, F3–48, F4–60, and F5–51. Sufficient numbers of animals and litters were used to avoid any inbreeding within the generations or colony (see “Methods” section).
Figure 1:
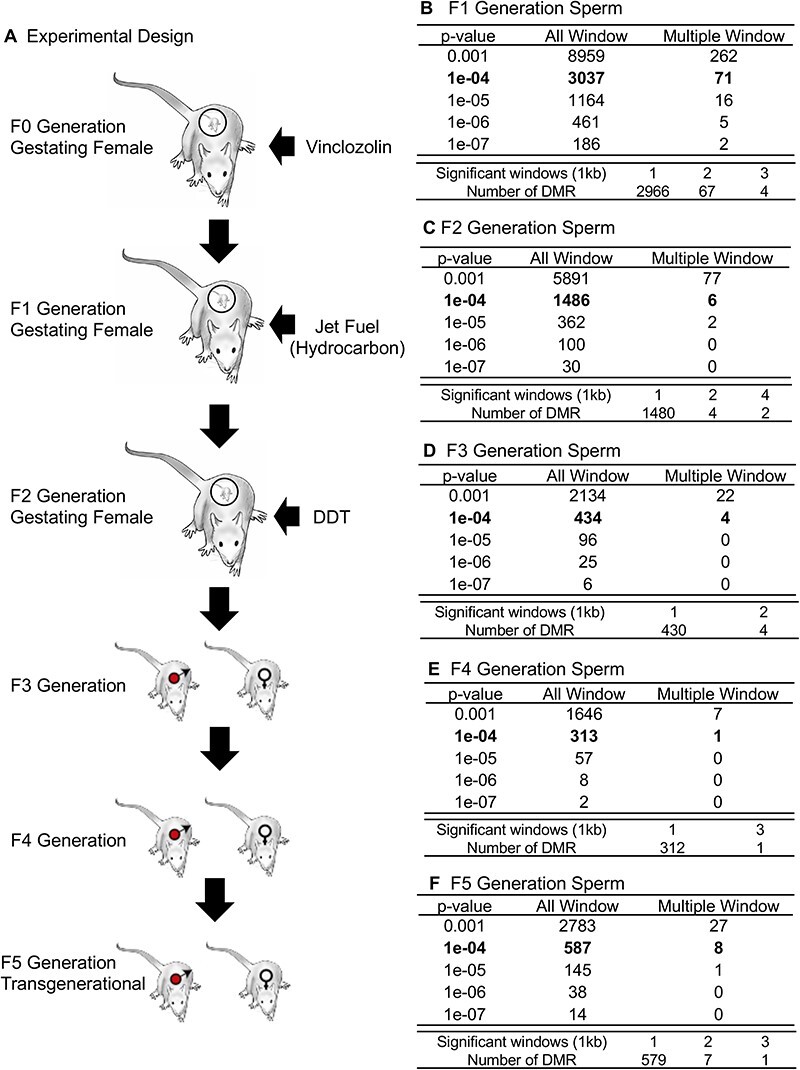
DMR identification. The number of DMRs found using different P-value cutoff thresholds. The All-Window column shows all DMRs. The Multiple Window column shows the number of DMRs containing at least two nearby significant windows (1 kb each). The number of DMRs with the number of significant windows (1 kb per window) at a P-value threshold of P < 1e-04 for DMR is bolded. (A) Experimental design; (B) F1 generation 1e-04; (C) F2 generation 1e-04; (D) F3 generation 1e-04; (E) F4 generation 1e-04; (F) F5 generation 1e-04
The sperm collected were used to assess the generational impacts on sperm DNA methylation. Sperm were isolated from the cauda epididymis and fragmented to assess DNA methylation with methylated DNA immunoprecipitation (MeDIP), as previously described [28]. The differential DMRs between the control lineage and exposure lineage were identified, as previously described [28]. Control F0 generation lineage gestating females were exposed to the vehicle dimethyl sulfoxide (DMSO) only to compare with the toxicant exposure that we dissolved in DMSO as well, as previously described [1]. The control F1 generation offspring were then bred to generate the F2 generation and the F2 generation was used to generate the F3 generation and all aged to 1 year of age for sperm collection and pathology analysis. The F1 generation control was compared to the F1 generation multigeneration exposure lineage, the F2 generation control to the F2 generation multigeneration lineage, and the F3 generation control compared to all subsequent F3, F4, and F5 generation exposure lineages for epigenetic and pathology analysis. The sperm epigenetic analysis is summarized in Fig. 1. The edgeR P-value is presented and the associated DMRs for each generation are presented for the F1 generation (Fig. 1B), F2 generation (Fig. 1C), F3 generation (Fig. 1D), F4 generation (Fig. 1E), and F5 generation (Fig. 1F). The number of single window 1 kb DMR is presented and multiple-window adjacent 1 kb DMR is presented. The majority of DMRs identified were single-window DMRs, Fig. 1. All DMRs with an edgeR P < 1e-4 had an FDR < 0.1 in the F1 and F2 generation analyses. In the F3, F4, and F5 generations, only a portion of the P < 1e-4 DMRs had an FDR < 0.1 threshold. At edgeR P < 1e-05 all the generations had an FDR < 0.1, except the F4 generation which only had a portion of the FDR at <0.1 threshold. A principal component analysis of the DMR read depth demonstrated a good separation between the control versus exposure lineage samples when DMR sites were considered, Supplementary Fig. S1. The DMR names and characteristics are presented in Supplementary Tables S1–S5 for each generation.
The genomic chromosomal locations of the DMRs are presented in Fig. 2 for each generation. The chromosomal number and size of chromosome are presented with red arrowheads indicating the locations of the DMRs and black boxes clusters of DMRs, Fig. 2. The DMRs have a genome-wide distribution. The CpG density of the DMRs is presented in Fig. 3 for each generation. The CpG densities are generally 1–3 CpG/100 bp. Therefore, these are primarily lower density CpG desert densities, as previously described [29]. The DMR length was found to be primarily 1 kb with some at 3–4 kb, Fig. 4. All the specific DMR statistics and characteristics are presented in Supplementary Tables S1–S5 for each generation. A comparison of the DMRs at each generation indicated the highest number in the F1 generation with reductions to the lowest number in the F4 generation and rebound in the transgenerational F5 generation, Fig. 1. An overlap of the DMRs with an extended overlap for the P < 1e-04 DMR sets is compared with other generations with a reduced statistical cut-off of P < 0.05 and presented in Fig. 5. The F1 generation had the highest number of DMRs, but lower overlap with subsequent generations. The F3 generation, F4 generation, and F5 transgenerational generation had the highest overlap (∼40–60%), with generally <20% overlap with the previous F1–F2 generations, Fig. 5A. Similar observations are found with the P < 1e-04 and P < 1e-05 statistical cut-off DMRs. At P < 1e-04 there are no DMRs present in all generations, Fig. 5B. At the reduced extended overlap statistics there were 92 DMRs common between the F1 generation considering the F5 generation DMRs, Fig. 5A and D, and 370 DMRs common between the F5 generation considering the F1 generation DMRs, Fig. 5A and C. These common DMRs are presented in Supplementary Tables S6 and S7.
Figure 2:
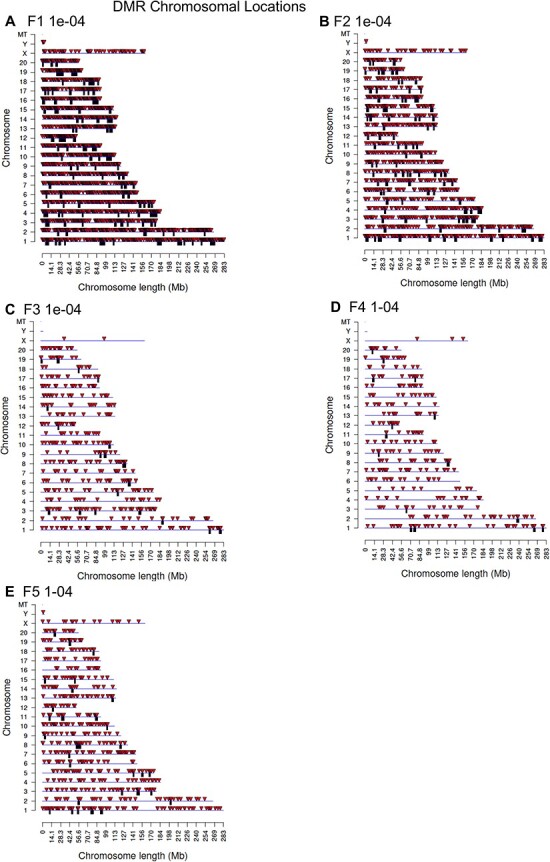
DMR chromosomal locations. (A) F1 generation 1e-04; (B) F2 generation 1e-04; (C) F3 generation 1e-04; (D) F4 generation 1e-04; (E) F5 generation 1e-04
Figure 3:
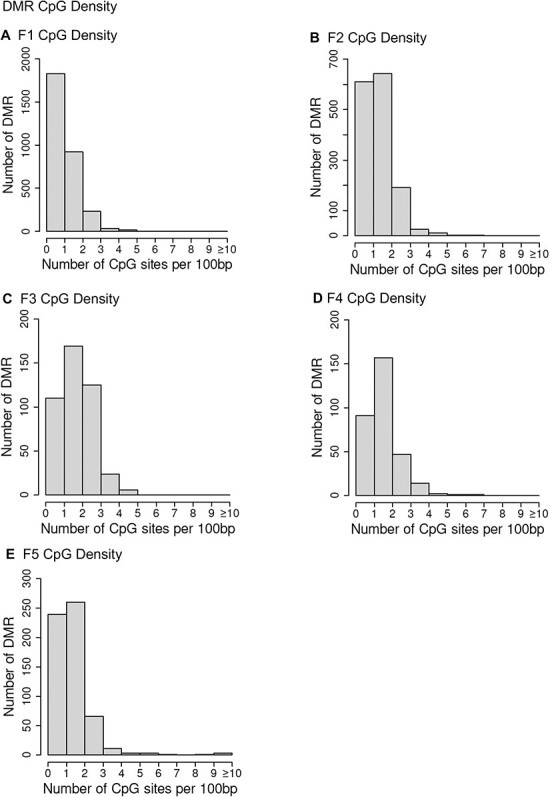
DMR CpG density. (A) F1 CpG density; (B) F2 CpG density; (C) F3 CpG density; (D) F4 CpG density; (E) F5 CpG density
Figure 4:
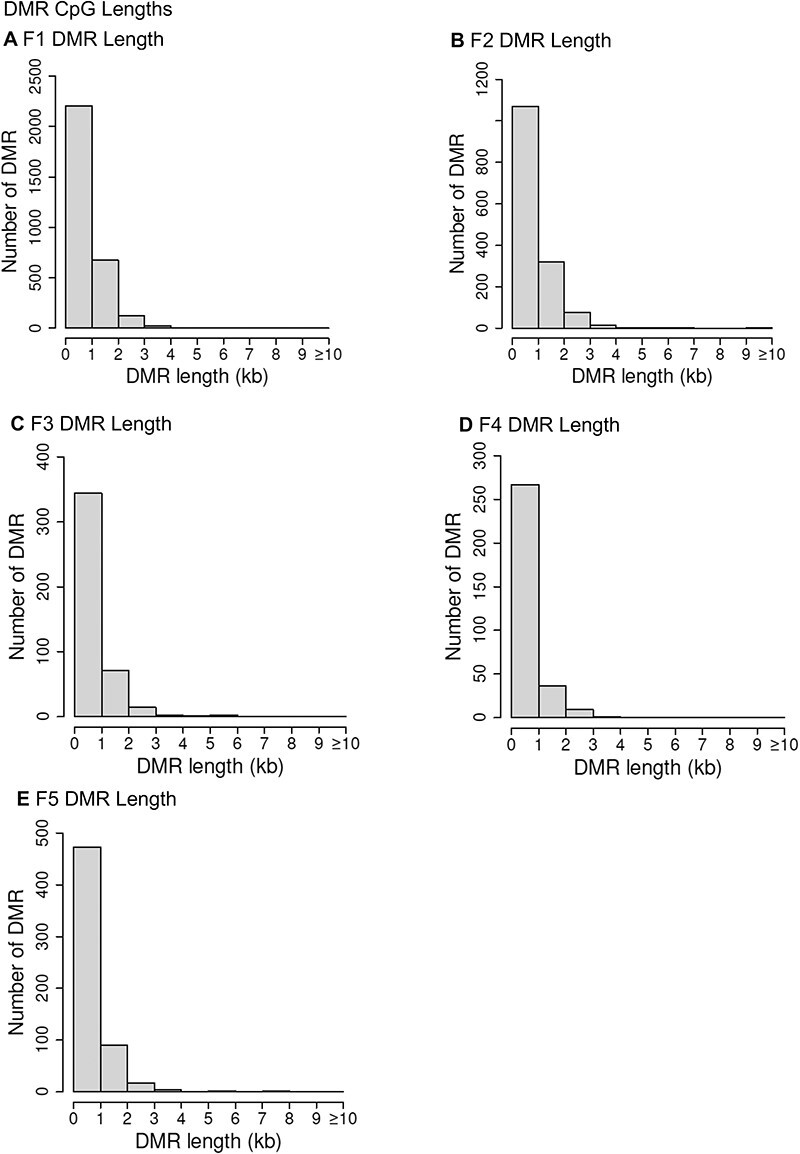
DMR length. (A) F1 DMR length; (B) F2 DMR length; (C) F3 DMR length; (D) F4 DMR length; (E) F5 DMR length
Figure 5:
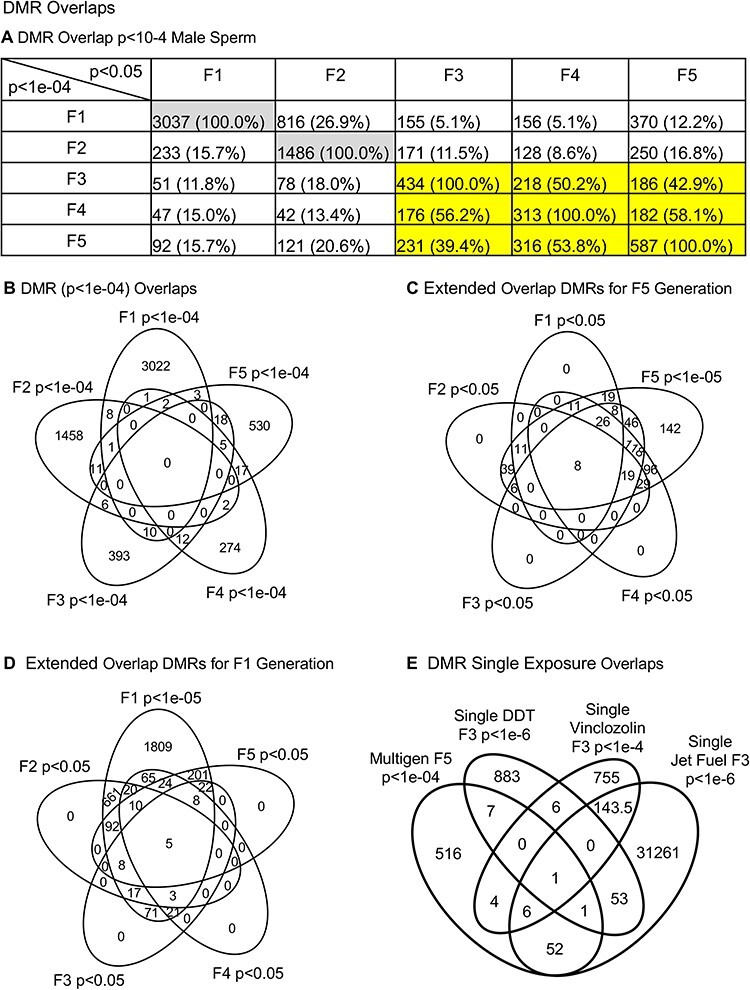
DMR overlaps. (A) DMR overlap P < 10-4 with P < 0.05 in other generations in male sperm; (B) DMR overlap P < 10-4 male sperm; and (C) extended overlap for F5 generation (D) extended overlap DMRs for F1 generation, and (E) DMR single exposure overlaps
Previously, studies with a single exposure of the F0 generation gestating female for each of the DDT [6], jet fuel [15], and vinclozolin [30] toxicants have been reported. A Venn diagram overlap of the individual exposure transgenerational F3 generation DMRs with the multiple generation exposure F5 generation DMRs is presented in Fig. 5E. There was a minimal overlap between the transgenerational DMRs of the single exposures and the multiple generation exposure, Fig. 5E. Therefore, considering different experimental design, negligible overlap was observed and the presence of multiple generational exposure generated new transgenerational DMRs. This is important to consider in final data interpretation.
For each generation DMR names, chromosomal locations, fold change, and statistics are presented in Supplementary Tables S1–S5. DMR information is also presented for gene associations. The DMR identified with gene associations found are presented in the Supplementary Tables. The gene-associated DMR are DMRs that are within 10 kb of a gene to include the proximal and distal promoter regions, Fig. 6A. The DMR gene associations for the conserved DMRs of the F1–F5 generations demonstrate numerous metabolism pathway associations and functional gene categories, Fig. 6B. Therefore, a variety of functional category genes are associated with the conserved set of DMRs following a multiple generation exposure.
Figure 6:
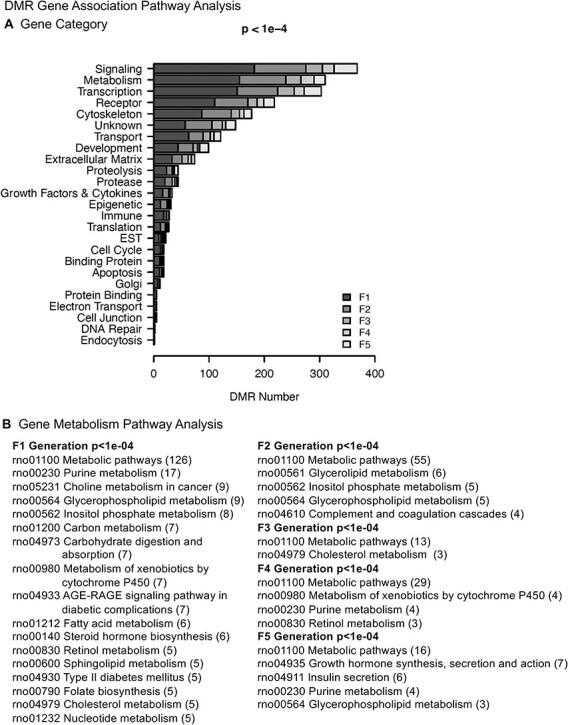
DMR gene association pathway analysis. (A) Number of DMR-associated genes in each gene category. (B) Gene pathway analysis. KEGG pathway identifier numbers and names are presented. The number of DMR-associated genes that fall into each pathway is indicated in parentheses ()
The initial pathology analysis used the paraffin-fixed sections stained with hematoxylin and eosin and manual microscopic histology analysis. This involved evaluations by three different individuals blinded to the generation and exposure lineage. Images of a predetermined portion of each tissue section were assessed and used to score the various tissue pathologies present, Fig. 7A–E. For the testis, the tubule atrophy and vacuoles were identified pathologies. For the ovary, the large and small cysts, primordial, pre-antral, antral follicle number, and total follicle number were identified for pathologies. For the kidneys, the cysts, reduced glomerulus and thickened Bowman’s capsule pathologies were identified. For the prostate, glandular atrophy, vacuoles, and collapsed gland pathologies were identified, Fig. 8. Tumors were identified and generally involved mammary tumors, as previously described [30]. Obesity or metabolic parameters were also assessed including animal weights, abnormal fat content, and adipocyte size [31]. The most accurate obesity assessment involved isolation of adipocytes from the gonadal fat pads and analysis of adipocyte size, as previously described [32]. Examples of each of the tissue pathologies identified are presented in Supplementary Fig. S2–S6. The analysis of each generation’s male and female manual pathologies is presented in Fig. 7A–E. The different manual tissue pathology analyses are presented for each generation and compared to the different control F1, F2, and F3 generation lineage. For the male testis, pathology in the F1 generation was high, then declined and increased at each generation to the F5 generation. For the male kidney, there was a gradual increase in pathology to the F4 generation then maintained. The male prostate pathology was sporadic with highest at the F4 and F5 generation, Fig. 7A–C. For the female ovary there was negligible change with the highest at the F2 generation, Fig. 7E, the female kidney the highest was at the F5 generation, Fig. 7D, and the female tumor at high levels in the F3, F4, and F5 generations, Fig. 9B.
Figure 7:
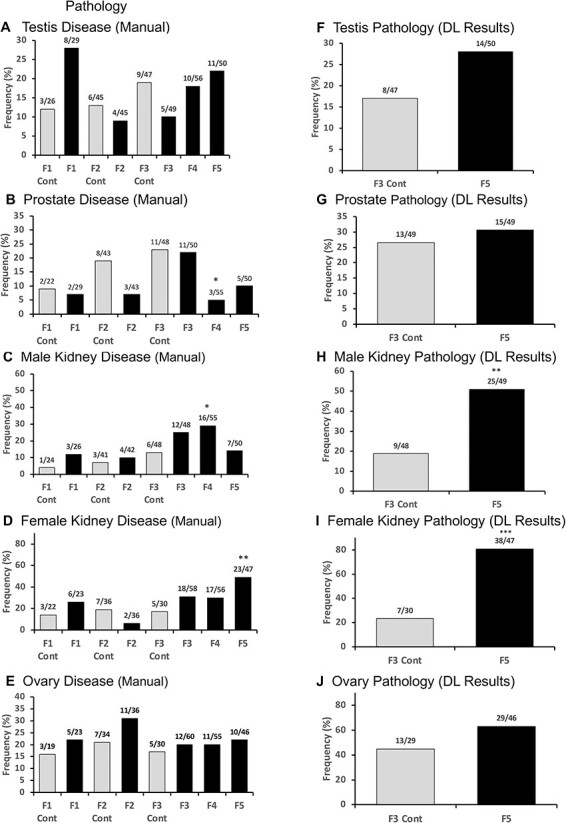
pathology. (A) Testis disease; (B) prostate disease; (C) prostate disease; (D) male kidney disease; (E) ovary disease; (F) testis pathologies DL results; (G) prostate pathologies DL results; (H) male kidney individual pathologies DL results; (I) female kidney pathologies DL results; and (J) ovary pathologies DL results. Statistical differences were determined by Fisher’s exact tests. F3, F4, and F5 are compared to F3 Control. * P < 0.05. ** P < 0.01
Figure 8:
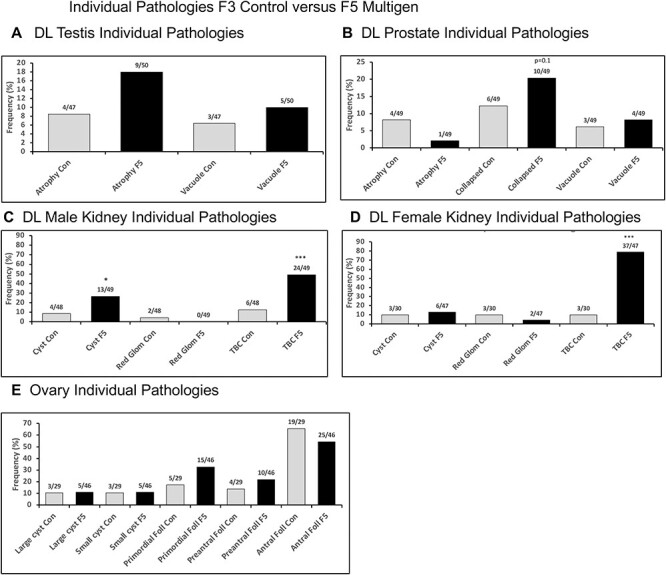
DL individual tissue sub-pathologies. (A) DL testis individual pathologies; (B) DL prostate individual pathologies; (C) DL male kidney individual pathologies; (D) DL female kidney individual pathologies; and (E) ovary individual pathologies. Statistical differences were determined by Fisher’s exact tests. * =P < 0.05. *** =P < 0.001
Figure 9:

Multigen study other pathologies. (A) Male tumors; (B) female tumors; (C) multiple disease (male); (d) multiple disease (female); (E) DL pathology for multiple disease (male); and (F) DL pathology for multiple disease (female). Statistical differences were determined by Fisher’s exact tests. F3, F4, and F5 are compared to F3 control. * P < 0.05. *** P < 0.001
For the obesity analysis, a statistical increase was observed in several parameters assessed including average weight, average body mass index (BMI), and adipocyte size, Fig. 10. Similar observations were obtained for both males and females, which demonstrated that adipocyte size was the least variable parameter, so was used in the subsequent analysis, Fig. 10E–H. Observations with the obesity demonstrated a decreased trend in the F1 generation, Fig. 10G. The frequencies of obesity were very high in the multigeneration exposure F4 generation and F5 transgenerational animals, Fig. 10G and H. A statistical increase was observed for average weight, BMI, and adipocyte area animals, Fig. 10. Previously, we have shown that there can be litter mates with and without obesity on the same diet and exercise regimen, such that altered food consumption is not anticipated to be a major factor, but rather there is susceptibility for obesity on the same diet [31]. An example of the size of the non-obese and obese animals is presented in Supplementary Figure S2. Generally, higher pathology was observed in the F4 and F5 generations. The presence of multiple pathologies was assessed. In females, there was an increase in those having multiple diseases in the F3 and F5 generations, Fig. 9D.
Figure 10:

Obesity parameters. (A) Average weight in multigen and control females; (B) Average weight in multigen and control males; (C) Average BMI in multigen and control females; (D) Average BMI in multigen and control males; (E) Average adipocyte area in multigen and control females; (F) Average adipocyte area in multigen and control males; (G) Obesity disease in females; and (H) Obesity disease in males. Statistical differences determined by Student’s t-test for A–F. Statistical differences were determined by Fisher’s exact tests for G and H. F1 compared to F1 Control. F3, F4, and F5 are compared to F3 Control. * P < 0.05. ** P < 0.01. *** P < 0.001
Although the manual pathology was adequate to assess the general trends in specific pathology, the variability of the observations in the control slide pathology between generations and pathologies was a concern. In addition, the reliance on sub-sections (i.e. portions) of the histology sections was a concern. An alternate approach the laboratory has developed involves an artificial intelligence (AI) protocol involving Deep Learning (DL) histology analysis that examines the entire section area as well as adjacent general sections [33]. For this DL histology, all the different sub-pathologies identified by manual analysis were used for training of the DL histology algorithms to identify all the sub-pathologies in the entire section and adjacent sections. The training DL system involved the placing of tiled areas on the slide where pathologies are predicted to be, in order to quantitate the pathology incidence and allow a more accurate section wide analysis of the pathologies. Examples of the tiled pathology sub-types for the tissues are presented in Supplementary Figs S3–S6. The testis sub-types involved testis atrophy and vacuoles, Fig. 8 and Supplementary Fig. S3. Prostate sub-types involved atrophy, vacuoles, and hyperplasia, Fig. 8 and Supplementary Fig. S4. The ovary sub-types involved small cysts, large cysts, and follicle number alterations, Fig. 8 and Supplementary Fig. S5. The kidney sub-types involved reduced glomeruli, thickened Bowman’s capsules, and cysts, Fig. 8 and Supplementary Fig. S6. Obesity and tumors were not assessed with the DL histology analysis, but are outlined in the manual pathology, Figs 9 and 10. Application of this DL histology analysis in the different generation histology sections demonstrated the same general trends of the manual pathology observed, but since full section areas are assessed, a more accurate pathology analysis is expected, as previously described [34]. The male testis pathology demonstrated a trend for an increase in the F5 generation, Figs 7F and 8. The male kidney pathology demonstrated a significant increase in the F5 generation, Figs 7H and 8. The male prostate pathology demonstrated negligible effect in the F5 generation, Figs 7G and 8. The female ovary DL pathology demonstrated negligible effect in the F5 generation, Figs 7J and 8. The female kidney DL pathology demonstrated a significant increase in the F5 generation, Figs 7I and 8. A statistical Fisher’s exact test demonstrated that the DL histology analysis was more accurate for all tissues, Figs 7–8, than the manual histology pathology analysis. The successive vinclozolin, jet fuel, and DDT toxicant exposures on multiple generations for some diseases such as obesity and testis pathology, appear more additive transgenerationally. Other diseases, such as kidney appear to plateau at an intermediate level. In addition, the multiple disease frequency was also increased in the transgenerational generations, in particular in females, Fig. 9C–F.
Discussion
Most organisms, including humans, have different generations that each has distinct exposures to impact the populations phenotypes and pathology characteristics. For humans, the 1800s and early 1900s had nutrition limitations (i.e. caloric restrictions) and air pollution (i.e. wood and coal burning) as prominent environmental exposures [35]. In the last 50–75 years, the exposures for humans and most organisms have changed to include a significant level of environmental toxicants [36]. The initial toxicant exposures involved DDT in the 1950s and 1960s, followed by plastics starting in the 1970s, dioxin/2,3,7,8-tetrachlorodibenzo-p-dioxin in the 1960s and 1970s, and then fungicide vinclozolin and herbicides glyphosate (Roundup) and atrazine in the 1980s and still used currently [37]. Other environmental exposures include increased stress and climate change elements such as temperature [38–40]. Although a more appropriate toxicant exposure sequence involves DDT [22], followed by dioxin [41] or plastics [42], and then vinclozolin [18] or glyphosate [43] would be more accurate timing for humans, the focus of the current study was to examine exposures that have toxicants with distinct receptor-mediated systems. Therefore, the current study examined the successive generational exposures of vinclozolin (anti-androgen), followed by jet fuel hydrocarbons (AHR receptor), and then DDT estrogenic toxicant (estrogen receptor). Following the multiple-generation gestating female exposure of F0 generation to vinclozolin, F1 generation jet fuel, and F2 generation DDT, all F1–F4 generations and transgenerational F5 generation were analyzed for sperm epigenetics, as well as male and female pathology.
The multigenerational exposures to distinct toxicants (i.e. F0 generation vinclozolin, F1 generation jet fuel, and F2 generation DDT) promoted epigenetic variation in the sperm DNA methylation, which in part mediates the epigenetic transgenerational inheritance to the F5 generation. The highest level of epigenetic change was observed in the F1 generation, then declined at each generation to the F4 generation and then increased in the F5 generation. The minimal overlap between the sperm DMRs in the F1–F3 generations suggest a continual baseline reprogramming of the epigenetics. Following this, more overlap was observed between the F3, F4, and F5 generations. The same control F3 generation was used for the subsequent generations to help compare and normalize the epigenetics and pathology analysis. This common control may partially explain the increased overlap in DMRs for these generations. Although some of the F5 generation sperm DMRs were similar with all generations, overall, the distinct generation toxicant exposures appeared to continually reprogram the baseline epigenetics of the sperm. The potential plateau of the epigenetic reprogramming observed in the transgenerational F5 generation appeared to stabilize more than the previous altered exposure generations. The specific DMR characteristics were similar in regard to size, CpG density, and genome-wide localization at all generations. The set of DMR that overlapped throughout the different generations were characterized and shown, Supplementary Table S1 for the F1 generation DMR in the F5 generation, and Supplementary Table S5 for the F5 generation DMR in the F1 generation. The generational biological variations assessed were disease and pathology.
The generational pathology induced from the successive generational exposure initially was evaluated using a classic manual pathology procedure previously described for each of the individual exposures induced transgenerational disease [1, 7, 8, 10–12]. The histological features evaluated for each tissue are shown in Supplementary Figs S3–S8 and involved evaluation of predetermined portions of each tissue section to assess the pathology present, Fig. 7A–E. The different pathologies observed in the testis, ovary, kidney (male and female), and prostate, as well as the presence of obesity (male and female), tumors, and multiple disease are presented in Figs 7–10. Although the manual pathology has the disadvantage of not assessing the entire section, similar trends with the AI-based DL histology were observed, Figs 7 and 9. Examples of additive pathology frequency with the multiple distinct exposures are the obesity and testis, Figs 7 and 10. Therefore, some pathology and disease appeared to plateau and not be additive with each exposure (e.g. kidney), but others did appear to become additive (e.g. obesity), Figs 7–10. Clearly, more detailed pathology would be useful. For example, assessment of additional metabolic parameters such as glucose tolerance or insulin resistance, but these are beyond the scope of the current study and require future studies.
Recently, a more advanced pathology analysis has been developed by our laboratories to improve the accuracy of the pathology analysis with AI [34]. A large number of AI-based pathology procedures have recently been developed [44]. A DL histology was developed that used slides with the absence or presence of defined pathologies to train the DL histology procedures for all the tissues and histology assessed [34]. The major advantage with DL histology is the entire section is examined, including sequential sections of tissues to then use the trained DL histology AI tool to identify and quantitate the pathology and disease. In addition, this process can be done in weeks rather than the multiple months or years needed for the manual histology analysis. The testis, ovary, kidney, prostate, and multiple disease pathologies were identified with the DL pathology, Figs 7 and 8. Observations were found to be more accurate and did show similar trends as the manual pathology. The DL histology AI approach is more accurate and less time consuming, so will likely be the predominant approach in the future for general pathology.
Multigenerational exposure to distinct toxicant exposures promoted transgenerational inheritance of higher disease frequency for nearly all the different diseases examined. The sperm epigenetics had overlap in the F3 generation, F4 generation, and F5 transgenerational generation, but in prior generations each exposure promoted a more distinct epigenetic change that was generally not overlapped. Those DMRs that do overlap are presented and discussed. Observations indicate each distinct exposure promotes a reset and unique baseline epigenetics, likely due to the distinct actions of each exposure. Therefore, the epigenetic programming is more complex and dynamic, which appears to be due more to the distinct actions of each of the exposures. A simple additive response was not observed. The pathology response was also more complex and not simply additive. Examples of the non-additive response are the kidney and ovary pathology, which appeared to plateau. In contrast, others such as obesity were compared and more additive with each generation’s exposure. Therefore, successive generations with distinct exposures do impact future generations with an increased magnitude of epigenetic transgenerational inheritance of disease. A potential explanation is that some pathologies reach a maximum rate and so plateau, and others have the capacity to become additive such as obesity. This is likely linked to the epigenetics within the effected cell types in the tissues associated with the pathologies. Future multigenerational studies of this phenomenon will likely help elucidate these phenomena that are relevant to the human population today.
Observations indicate multigenerational distinct exposures need to be considered to assess the potential future generation impacts from ancestral exposures on disease susceptibility, and the magnitude of the multiple generation distinct toxicant exposures. The current study suggests this will not simply be an additive response, but more complex with some pathology becoming additive (e.g. obesity), while others may plateau. However, the magnitude of the impact of multigeneration exposures on the transgenerational pathology promoted a high level of pathology and increase epigenetic programming alterations. A more accurate sequence of successive distinct exposures in humans would be DDT, followed by dioxin, followed by plastics, followed by agricultural compounds (e.g. glyphosate), and then stress to assess the multiple generation exposure impacts. The current observations demonstrate that successive disease generational exposure will impact and likely lead to higher frequency pathologies. In addition to the need to consider epigenetic-mediated toxicology, the generational toxicology from multiple generation exposures needs to be considered to correlate the human exposure at each generation with the anticipated generational toxicology. The ethics of knowing that our exposures today will impact our future generations’ health and pathology, raises issues of environmental justice around generational toxicology not currently being considered [45].
Methods
Animal Studies and Breeding
As previously described [21, 46–51], female and male rats of an outbred strain Hsd:Sprague Dawley SD (Harlan) were fed ad lib with a standard rat diet and ad lib tap water. All animal cages were housed in the same room and environment with gestating females and females with litters being housed individually within cages. Conditions were designed to minimize differences that would cause maternal effects. The breeding of unrelated males and females at 70–100 days of age within specific exposure lineages (interbreeding) was used to optimize the maternal and paternal lineage contributions to the phenotypes observed [30]. No inbreeding within the colonies was performed. Previous studies have demonstrated inbreeding suppression of epigenetics [52–54]. Sixteen unrelated breeding pairs made up the treated lineage F0 generation, so that offspring of subsequent generations could be bred at the F1, F2, F3, and F4 generations without inbreeding. The numbers of breeding pairs, offspring, and sex are presented in Supplementary Table S6. Therefore, F1 through F5 generation pups were not inbred. Timed-pregnant F0, F1, and F2 generation females were mated and on embryonic days 8 through 14 (E8–E14) of gestation were daily administered IP injections of the treatment compound (vinclozolin 100 mg/kg) (Chem Service Inc., West Chester, PA, USA) as previously described [24]. Similarly, pregnant F1 females were treated with jet fuel hydrocarbons (250 mg/kg JP8), and F2 females were treated with 25 mg/kg DDT (Chem Service Inc.). The F3 and F4 generations were bred without additional treatments during gestation. The F5 generation animals are considered transgenerational, as neither they nor the germ cells that produced them were directly exposed to these toxicants [55]. For control lineage animals, F0 generation pregnant females were treated with vehicle DMSO (Sigma-Aldrich) from E8–E14, the F1 and F2 generations were not treated during pregnancy, and the F3 generation rats were considered to be the control lineage transgenerational generation. No sibling or cousin breeding was used to avoid any inbreeding artifacts. All animals were aged to 1 year for pathology and epigenetic analysis. Animals were euthanized by use of a CO2 chamber, followed by cervical dislocation as a secondary method. All experimental protocols for the procedures with rats were pre-approved by the Washington State University Animal Care and Use Committee (IACUC approval # 2568 & 6931). All methods were performed in accordance with the relevant IACUC and ARRIVE guidelines and regulations.
Epididymal Sperm Collection
The protocol used is as previously described [56]. Briefly, the epididymis was dissected free of fat and connective tissue, then, after cutting open the cauda, placed into 6 ml of phosphate buffer saline (PBS) for 20 min at room temperature. The tissue was then minced, the released sperm pelleted at 4ºC by centrifuging at 3000g for 10 min, then resuspended in 250 µL NIM buffer and stored at −80ºC.
DNA Isolation
For molecular analysis, an appropriate amount of rat sperm suspension (∼50 µL) was used for DNA extraction. Previous studies have shown mammalian sperm heads are resistant to sonication, unlike somatic cells [57, 58]. Somatic cell contamination and debris were removed by brief sonication (Fisher Sonic Dismembrator, model 300, power level 25), which destroys the somatic cells, then centrifugation and washing 1–2 times in 1× PBS. The resulting purified sperm pellet was resuspended in 820 µL DNA extraction buffer and 80 µl 0.1 M DTT added, then incubated at 65°C for 15 min. Proteinase K (80 µl of 20 mg/ml) was added and the sample was incubated at 55°C for 2-3 h under constant rotation. Protein was removed by addition of protein precipitation solution (300 µl, Promega A795A), incubation for 15 min on ice, then centrifugation at 13 500g for 30 min at 4°C. One milliliter of the supernatant was precipitated with 2 µl of GlycoBlue (Invitrogen, AM9516) and 1 ml of cold 100% isopropanol at −20° overnight. After incubation, the sample was spun at 13 500g for 30 min at 4°C, then washed with 70% cold ethanol. The pellet was air-dried for ∼5 min then resuspended in 100 µl of nuclease free water.
MeDip
Sperm DNA from individual animals were obtained and pooled with 5–10 different animals DNA samples, with equal amounts of DNA from each animal present in each pool. The number of animals per pool for each generation is presented in Supplementary Table S6B. The DNA samples were prepared as previously described [56]. Genomic DNA was sonicated and run on 1.5% agarose gel for fragment-size verification. The sonicated DNA was then diluted with 1× TE buffer to 400 μl, then heat-denatured for 10 min at 95˚C, and immediately cooled on ice for 10 min to create single-stranded DNA fragments. Then 100 μl of 5× IP buffer and 5 μg of antibody (monoclonal mouse anti-5-methyl cytidine; Diagenode #C15200006) were added, and the mixture was incubated overnight with rotation at 4˚C. The following day magnetic beads (Dynabeads M280 Sheep anti-Mouse IgG; Life Technologies 11201D) were pre-washed as per manufacturer’s instructions, and for each sample 50 μl of beads were added to the 500 μl of DNA–antibody mixture from the overnight incubation, then incubated for 2 h with rotation at 4˚C. After this incubation, the samples were washed three times with 1× IP buffer using a magnetic rack. The washed samples were then resuspended in 250 μl digestion buffer (5 mM Tris PH 8, 10.mM EDTA, 0.5% SDS) with 3.5 μl Proteinase K (20 mg/ml), and incubated for 2–3 h on a rotator at 55˚C. DNA clean-up was performed using a Phenol–Chloroform–Isoamyl–Alcohol extraction, and the supernatant precipitated with 2 μl of GlycoBlue (20 mg/ml), 20 μl of 5 M NaCl and 500 μl ethanol at −20˚C for one to several hours. The DNA precipitate was pelleted at 13 500g for 30 min at 4°C, washed twice with 70% ethanol, then dried and resuspended in 20 μl H2O. DNA concentration was measured in a Qubit apparatus (Life Technologies) with the ssDNA analysis kit (Molecular Probes Q10212).
MeDIP-Seq Analysis Sequencing Libraries
MeDIP DNA was used to create libraries for next generation sequencing (NGS) using the NEBNext Ultra II RNA Library Prep Kit for Illumina (E770L, New England Biolabs, San Diego, CA, USA) starting at step 1.4 of the manufacturer’s protocol to generate double-stranded DNA from the single-stranded DNA resulting from MeDIP. After this step, the manufacturer’s protocol was followed indexing each sample individually with NEBNext Multiplex Oligos for Illumina. The WSU Spokane Genomics Core sequenced the samples on the Illumina HiSeq 2500 at PE50, with a read size of ∼50 bp and ∼6–22 million reads per pool, with most at 12 million reads. Twelve libraries were run in one lane. Reagent information and commercial kits are listed in Supplementary Table S7.
Statistics and Bioinformatics
The DMR identification and annotation methods follow those presented in previous published papers [51, 56]. Data quality was assessed using the FastQC program (https://www.bioinformatics.babraham.ac.uk/projects/fastqc/). The data were cleaned and filtered to remove adapters and low-quality bases using Trimmomatic [59]. The reads for each MeDIP sample were mapped to the Rnor 6.0 rat genome using Bowtie2 [60] with default parameter options. The mapped read files were then converted to sorted BAM files using SAMtools [61]. The MEDIPS R package [62] was used to calculate differential coverage between disease and non-disease sample groups. The edgeR P-value [63] was used to determine the relative difference between the two groups for each genomic window. Windows with an edgeR P-value less than the selected P < 1e-04 threshold were considered as DMR. The site edges were extended until no genomic window with an edgeR P < 0.1 remained within 1000 bp of the DMR. The edgeR P-value was used to assess the significance of the DMR identified. A false discovery rate (FDR) analysis for each comparison was performed and provided FDR P < 0.1 for the F1 and F2 generations, Supplementary Tables S1–S4. A portion of the DMRs at P < 1e-4met an FDR < 0.1 threshold in the F3, F4, and F5 generations. The DMR associated genes were annotated using the biomaRt R package [64] to access the Ensembl [65] database. Genes were sorted into categories by converting Panther [66] protein classifications into more general groups. All molecular data has been deposited into the public database at NCBI (GEO # GSE244603) and R code computational tools available at GitHub (https://github.com/skinnerlab/MeDIP-seq) and www.skinner.wsu.edu. All bioinformatics tools and molecular data deposit information is presented in Supplementary Table S7.
Manual Pathology Analysis
Histopathology Examination and Disease Classification
The oversight of the pathology analysis involved the co-author, Dr Eric Nilsson, DVM/PhD, with over 20 years of pathology analysis in rats [51, 67]. The Washington Animal Disease Diagnostic Laboratory (WADDL) at the Washington State University College of Veterinary Medicine has board certified veterinary pathologists and assisted in initially establishing the criteria for the pathology analyses and identifying parameters to assess [68]. WADDL performed full necropsies as required on animals that died prior to the time of scheduled sacrifice at one year, and performed tumor classifications in the current study. Upon dissection, a brief examination of abdominal and thoracic organs was performed to look for obvious abnormalities. The tissues evaluated histologically were selected from previous literature showing them to have pathology in transgenerational models [1, 21, 24, 46, 48–51, 68, 69], with an emphasis on reproductive organs. Histopathology readers were trained to recognize the specific abnormalities evaluated for this study in rat testis, ventral prostate, ovary, and kidney (see further). Three different pathology readers were used for each tissue that were blinded to the treatment groups. A set of quality control (QC) slides was generated for each tissue and was read by each reader prior to evaluating any set of experimental slides. These QC slide results are monitored for reader accuracy and concordance. Previous studies by the laboratory help confirm and validate the pathology analysis [1, 21, 24, 46, 48–51, 68, 69].
As previously described [70], testis histopathology criteria included the presence of vacuoles in the seminiferous tubules, azoospermic atretic seminiferous tubules, and “other” abnormalities including sloughed spermatogenic cells in center of the tubule and a lack of a tubule lumen. As previously described [67, 71], prostate histopathology criteria included the presence of vacuoles in the glandular epithelium, atrophic glandular epithelium, and hyperplasia of prostatic gland epithelium. Kidney histopathology criteria included reduced size of glomerulus, thickened Bowman’s capsule, and the presence of proteinaceous fluid-filled cysts >50 μm in diameter. As previously described [72], ovarian features quantified included primordial follicles, developing pre-antral follicles, antral follicles, small cystic structures (50–250 µm in diameter) and large cysts (>250 µm in diameter). A cut-off was established to declare a tissue “diseased” based on the mean number of histopathological abnormalities ±1.5 standard deviations from the mean of control group tissues, as assessed by each of the three individual observers blinded to the treatment groups. This number (i.e. >1.5 standard deviations) was used to classify rats into those with and without testis, prostate, ovary, or kidney disease in each lineage. A rat tissue section was finally declared “diseased” only when at least two of the three observers marked the same tissue section “diseased”.
Obesity was assessed with an increase in adipocyte size (area), BMI, and abdominal adiposity, as previously described [24, 48, 73–75]. BMI was calculated with weight (g)/length (cm)2 with the length of the animal measured from the nose to the base of the tail. Gonadal fat pad slides were imaged using a Nikon Eclipse E800 microscope (10×) with an AVT Prosilica GE1050C Color GigE camera. Five field of view image captures were taken per slide in varying parts of the fat pad. Adipocyte size was measured converting pixels into microns using Adiposoft [61]. Measurements of the 20 largest cells from each image for a total of 100 were averaged as hypertrophic cells are the most metabolically relevant and susceptible to cell death [62]. Obesity and lean phenotypes were determined utilizing the mean of the control population males and females, and a cut off of 1.5 standard deviations above and below the mean.
Statistical Analyses for Pathology
As previously described [47], for results that yielded continuous data (age at puberty, weight at euthanization, sex ratio, litter size, fertility rate, and parturition abnormality), treatment groups were analyzed using Student’s t-test. For results expressed as the proportion of affected animals that exceeded a predetermined threshold (testis, prostate, kidney, or ovary disease frequency, tumor frequency, lean/obese frequency), groups were analyzed using Fisher’s exact test.
DL Histology Pathology Analysis
The DL model is designed for segmenting and classifying gigapixel histology images. In the case of this study, the resolution range of all the whole slide images (WSI) is ∼(80 000–120 000) × (30 000–80 000) pixels. The approach used for the DL analysis is built on top of the current deep histology models by taking advantage of state-of-the-art DL practices and methods such as transfer learning, spatial attention, and memory efficient bootstrap-aggregating. Notably, tiling is the most prominent method that transpires across all recent work in gigapixel histology segmentation.
Tiling is the process in which a sliding window is used to extract patches of a large image. This method is used to break up an image into a grid-like structure where the tiles can be classified individually and then patched back together. Without tiling, using DL for gigapixel image classification or segmentation is not possible since the computational overhead would be unachievable. Tiling the gigapixel WSIs was done by using a sliding window of size 256 × 256 pixels. This tile size is the nearest power of 2 that is optimal for minimizing computational overhead and maximizing information perception. The DL model is designed to classify what pathologies are present in each individual tile. Using this information, the tiles classifications can be merged back together to recreate the original WSI with pathology segmentations.
The model used for tile classification was built using the latest standard practices for high precision image classification. Google’s EfficientNetV2 models [76] were implemented for the convolutional backbone to the neural network. The EfficientNetV2 architecture provides the best performance while also minimizing the number of trainable parameters. To utilize the effectiveness of transfer learning, the pretrained ImageNet [77] weights are used instead of training from scratch, as that has been shown to significantly improve training time and classification performance. For the output of the model, seven ensemble classifier blocks are used for prediction. The classifier blocks take the output of the CNN backbone where attention is used, followed by global average pooling and finally a fully connected layer used for prediction. Averaged voting is used to include the effectiveness of all seven ensemble classifiers. Sigmoid activations are used for the classification rather than SoftMax since multiple classes can be present in one tile, making this a multilabel problem, not a multiclass problem. Additionally, empirical results show that using sigmoid activations is the best way to handle training a model on heavily imbalanced data. The model outputs a set of probabilities for each tile, where the probabilities correspond to each of the possible classes (all pathologies and one class for normal non-pathology tissue). A confidence threshold of 0.95 is used to determine which classes are present in each tile. This is how the raw tile counts are computed for further analysis.
DL Histology Informatics
Given the ability to accurately classify individual tiles in a whole-tissue slide, a method analogous to the manual instance counting was devised to determine if an animal is diseased or not. Since the number of predicted tiles for each class is available, the total area of each pathology as a ratio to the total area of tissue can be computed. This is better than simply using the tile counts to compute statistics because the size of the images may vary, so this is the normalization process to compute the relative amount of pathology in an image. For a given pathology p, the area ratio is referred to as Rp. With this ratio, we have the normalized area which can be used to compute group statistics. Recall that the determining factor for an animal being diseased using the manual counts depends solely on the mean of any amount of pathology being 1.5 standard deviations higher than the mean of the same pathology count in the control group. The same procedure can be replicated using the area ratios of the pathologies rather than the instance counts. The mean μ and standard deviation σ of the area ratios of the control group are computed for each pathology. The area ratios of the experimental group can then be standardized by subtracting each area ratio by μ and then dividing by σ. Now that the experimental values are standardized relative to the control group, the classification can be made to determine if any whole-slide tissue sample taken from the experimental group belongs to a diseased animal as follows:
 |
In the equation above, P represents the set of pathologies that belong to any one image. δ is the threshold on the number of standard deviations which must be met or exceeded by the standardized area ratio for the statement to become true. In other words, if the area ratio  for any pathology p in the given image is δ standard deviations above the mean of the control group, then the entire image belongs to the diseased class. In this case,
  resulted in final predictions that aligned more closely to the manual counts that used
  . This is likely due to noise in the DL predictions due to a constant but low false-positive rate. For this reason, the higher WSI threshold is justified. Finally, the Fisher’s exact test is used to show significant differences between the disease frequencies found in the control group versus the experimental group. The amount of significance is determined by the P-values for each individual group categorized by the following levels: (*)
  , (**)
  , and (***)
  .
.
Ethics
All study protocols for the procedures with rats were pre-approved by the Washington State University Animal Care and Use Committee (IACUC approval # 2568 & 6931). All methods were performed in accordance with the relevant guidelines and regulations.
Inclusion and Diversity Statement
Both sexes within the animal model were assessed.
Supplementary Material
Acknowledgements
We acknowledge Ms Sasha Korolenko, Ms Emma Impala, Ms Madelyn Rode and Mr Grant Rickard for technical assistance. We acknowledge Ms Heather Johnson for assistance in preparation of the manuscript. We acknowledge the molecular assistance of Dr Ingrid Sadler-Riggleman, Dr Rashmi Joshi, current address, Children’s Hospital, University of Southern California, Los Angeles, CA, Dr Millissia Ben Maamar, current address TekTeam Medical Consulting, Palo Alto, CA, and Dr Jennifer L.M. Thorson, current address IEH Laboratories & Consulting Group, Lake Forest Park, WA. We thank the Genomics Core Laboratory at WSU Spokane for sequencing data.
Contributor Information
Eric E Nilsson, Center for Reproductive Biology, School of Biological Sciences, Washington State University, Pullman, WA 99164-4236, USA.
Margaux McBirney, Center for Reproductive Biology, School of Biological Sciences, Washington State University, Pullman, WA 99164-4236, USA.
Sarah De Santos, Center for Reproductive Biology, School of Biological Sciences, Washington State University, Pullman, WA 99164-4236, USA.
Stephanie E King, Center for Reproductive Biology, School of Biological Sciences, Washington State University, Pullman, WA 99164-4236, USA.
Daniel Beck, Center for Reproductive Biology, School of Biological Sciences, Washington State University, Pullman, WA 99164-4236, USA.
Colin Greeley, School of Electrical Engineering and Computer Science, Washington State University, Pullman, WA 99164, USA.
Lawrence B Holder, School of Electrical Engineering and Computer Science, Washington State University, Pullman, WA 99164, USA.
Michael K Skinner, Center for Reproductive Biology, School of Biological Sciences, Washington State University, Pullman, WA 99164-4236, USA.
Supplementary data
Supplementary data are available at EnvEpig online.
Conflict of interest statement
None declared.
Funding
This study was supported by John Templeton Foundation (50183 and 61174) (https://templeton.org/) grants to M.K.S. S.D.S. was supported by a NIH MIRA undergraduate fellowship at WSU. The funders had no role in study design, data collection, and analysis, decision to publish, or preparation of the manuscript.
Data Availability
All molecular data has been deposited into the public database at NCBI https://www.ncbi.nlm.nih.gov/geo/ (GEO # GSE244603), and R code computational tools are available at GitHub (https://github.com/skinnerlab/MeDIP-seq) and https://skinner.wsu.edu/genomic-data-and-r-code-files/. All computational tools can be downloaded for independent use.
Author Contributions
Eric E. Nilsson Animal studies, cell isolations, data analysis, edited manuscript.
Margaux McBirney Animal studies, molecular analysis, data analysis, edited manuscript.
Sarah De Santos Pathology analysis, data analysis, edited manuscript.
Stephanie E. King Pathology analysis for obesity, data analysis, edited manuscript.
Daniel Beck Bioinformatic analysis, data analysis, edited manuscript.
Colin Greeley Deep learning pathology analysis, data analysis, edited manuscript.
Lawrence B Holder Deep learning pathology analysis, data analysis, edited manuscript.
Michael K. Skinner Conceived, oversight, obtained funding, wrote and edited manuscript.
References
- 1. Anway MD, Cupp AS, Uzumcu M et al. Epigenetic transgenerational actions of endocrine disruptors and male fertility. Science 2005;308:1466–9. [DOI] [PMC free article] [PubMed] [Google Scholar]
- 2. Nilsson EE, Ben Maamar M, and Skinner MK. Role of epigenetic transgenerational inheritance in generational toxicology. Environ Epigenet 2022;8:1–9. [DOI] [PMC free article] [PubMed] [Google Scholar]
- 3. Nilsson E, Sadler-Riggleman I, Beck D et al. Differential DNA methylation in somatic and sperm cells of hatchery versus Wild (Natural-Origin. Steelhead Trout Popul Environ Epigenetics 2021;7:1–17. [DOI] [PMC free article] [PubMed] [Google Scholar]
- 4. Ben Maamar M, Nilsson EE, Skinner MK. Epigenetic transgenerational inheritance, gametogenesis and germline development. Biol Reprod 2021;105:570–92. [DOI] [PMC free article] [PubMed] [Google Scholar]
- 5. Ben Maamar M, Wang Y, Nilsson EE et al. Transgenerational sperm DMRs escape DNA methylation erasure during embryonic development and epigenetic inheritance. Environ Epigenetics 2023;9:1–15. [DOI] [PMC free article] [PubMed] [Google Scholar]
- 6. Beck D, Ben Maamar M, Skinner MK. Integration of sperm ncRNA-directed DNA methylation and DNA methylation-directed histone retention in epigenetic transgenerational inheritance. Epigenetics Chromatin 2021;14:1–14. [DOI] [PMC free article] [PubMed] [Google Scholar]
- 7. Ben Maamar M, Nilsson E, Sadler-Riggleman I et al. Developmental origins of transgenerational sperm DNA methylation epimutations following ancestral DDT exposure. Dev Biol 2019;445:280–93. [DOI] [PMC free article] [PubMed] [Google Scholar]
- 8. Ben Maamar M, Beck D, Nilsson EE et al. Epigenome-wide association study for glyphosate induced transgenerational sperm DNA methylation and histone retention epigenetic biomarkers for disease. Epigenetics 2021;16:1150–67. [DOI] [PMC free article] [PubMed] [Google Scholar]
- 9. Skinner MK, Nilsson E, Sadler-Riggleman I et al. Transgenerational sperm DNA methylation epimutation developmental origins following ancestral vinclozolin exposure. Epigenetics 2019;14:721–39. [DOI] [PMC free article] [PubMed] [Google Scholar]
- 10. Ben Maamar M, Nilsson E, Thorson JLM et al. Epigenome-wide association study for transgenerational disease sperm epimutation biomarkers following ancestral exposure to jet fuel hydrocarbons. Reprod Toxicol 2020;98:61–74. [DOI] [PMC free article] [PubMed] [Google Scholar]
- 11. Ben Maamar M, Nilsson E, Thorson JLM et al. Transgenerational disease specific epigenetic sperm biomarkers after ancestral exposure to dioxin. Environ Res 2020;192:1–14. [DOI] [PMC free article] [PubMed] [Google Scholar]
- 12. Thorson JLM, Beck D, Ben Maamar M et al. Ancestral plastics exposure induces transgenerational disease-specific sperm epigenome-wide association biomarkers. Environ Epigenet 2021;7:1–13, dvaa023. [DOI] [PMC free article] [PubMed] [Google Scholar]
- 13. Yipei Y, Zhilin L, Yuhong L et al. Assessing the risk of diabetes in participants with DDT DDE exposure- A systematic review and meta-analysis. Environ Res 2022;210:1–14. [DOI] [PubMed] [Google Scholar]
- 14. Kass L, Gomez AL, Altamirano GA. Relationship between agrochemical compounds and mammary gland development and breast cancer. Mol Cell Endocrinol 2020;508:1–9. [DOI] [PubMed] [Google Scholar]
- 15. Beck D, Nilsson EE, Ben Maamar M et al. Environmental induced transgenerational inheritance impacts systems epigenetics in disease etiology. Sci Rep 2022;12:1–17. [DOI] [PMC free article] [PubMed] [Google Scholar]
- 16. Feijo M, Martins RVL, Socorro S et al. Effects of the endocrine disruptor vinclozolin in male reproduction: a systematic review and meta-analysisdagger. Biol Reprod 2021;104:962–75. [DOI] [PubMed] [Google Scholar]
- 17. Skinner MK. Endocrine disruptors in 2015: epigenetic transgenerational inheritance. Nat Rev Endocrinol 2016;12:68–70. [DOI] [PMC free article] [PubMed] [Google Scholar]
- 18. van Ravenzwaay B, Kolle SN, Ramirez T et al. Vinclozolin: a case study on the identification of endocrine active substances in the past and a future perspective. Toxicol Lett 2013;223:271–9. [DOI] [PubMed] [Google Scholar]
- 19. Rea WJ. History of chemical sensitivity and diagnosis. Rev Environ Health 2016;31:353–61. [DOI] [PubMed] [Google Scholar]
- 20. Bendtsen KM, Bengtsen E, Saber AT et al. A review of health effects associated with exposure to jet engine emissions in and around airports. Environ health 2021;20:1–21. [DOI] [PMC free article] [PubMed] [Google Scholar]
- 21. Tracey R, Manikkam M, Guerrero-Bosagna C et al. Hydrocarbons (jet fuel JP-8) induce epigenetic transgenerational inheritance of obesity, reproductive disease and sperm epimutations. Reprod Toxicol 2013;36:104–16. [DOI] [PMC free article] [PubMed] [Google Scholar]
- 22. Turusov V, Rakitsky V, Tomatis L. Dichlorodiphenyltrichloroethane (DDT): ubiquity, persistence, and risks. Environ Health Perspect 2002;110:125–8. [DOI] [PMC free article] [PubMed] [Google Scholar]
- 23. Morisawa S, Kato A, Yoneda M et al. The dynamic performances of DDTs in the environment and Japanese exposure to them: a historical perspective after the ban. Risk Anal 2002;22:245–63. [DOI] [PubMed] [Google Scholar]
- 24. Skinner MK, Manikkam M, Tracey R et al. Ancestral dichlorodiphenyltrichloroethane (DDT) exposure promotes epigenetic transgenerational inheritance of obesity. BMC Med 2013;11:1–16. [DOI] [PMC free article] [PubMed] [Google Scholar]
- 25. Schneider S, Fussell KC, Melching-Kollmuss S et al. Investigations on the dose-response relationship of combined exposure to low doses of three anti-androgens in Wistar rats. Arch Toxicol 2017;91:3961–89. [DOI] [PMC free article] [PubMed] [Google Scholar]
- 26. Rohan JG, McInturf SM, Miklasevich MK et al. Comparative electrophysiological evaluation of hippocampal function following repeated inhalation exposures to JP-8, Jet A, JP-5, and the synthetic Fischer Tropsch fuel. J Toxicol Environ Health A 2018;81:314–32. [DOI] [PubMed] [Google Scholar]
- 27. Villalobos SA, Papoulias DM, Pastva SD et al. Toxicity of o,p’-DDE to medaka d-rR strain after a one-time embryonic exposure by in ovo nanoinjection: an early through juvenile life cycle assessment. Chemosphere 2003;53:819–26. [DOI] [PubMed] [Google Scholar]
- 28. Ben Maamar M, Sadler-Riggleman I, Beck D et al. Genome-wide mapping of DNA methylation 5mC by methylated DNA immunoprecipitation (MeDIP) –sequencing. DNA Modif Methods Mol Biol 2021;2198:301–10. [DOI] [PMC free article] [PubMed] [Google Scholar]
- 29. Skinner MK, Guerrero-Bosagna C. Role of CpG deserts in the epigenetic transgenerational inheritance of differential DNA methylation regions. BMC Genomics 2014;15:1–6. [DOI] [PMC free article] [PubMed] [Google Scholar]
- 30. Ben Maamar M, King SE, Nilsson E et al. Epigenetic transgenerational inheritance of parent-of-origin allelic transmission of outcross pathology and sperm epimutations. Dev Biol 2020;458:106–19. [DOI] [PMC free article] [PubMed] [Google Scholar]
- 31. King SE, Skinner MK. Epigenetic transgenerational inheritance of obesity susceptibility. Trends Endocrinol Metab 2020;31:478–94. [DOI] [PMC free article] [PubMed] [Google Scholar]
- 32. King SE, Nilsson E, Beck D et al. Adipocyte epigenetic alterations and potential therapeutic targets in transgenerationally inherited lean and obese phenotypes following ancestral exposures. Adipocyte 2019;8:362–78. [DOI] [PMC free article] [PubMed] [Google Scholar]
- 33. Mungenast F, Fernando A, Nica R et al. Next-generation digital histopathology of the tumor microenvironment. Genes (Basel) 2021;12:1–27. [DOI] [PMC free article] [PubMed] [Google Scholar]
- 34. Greeley C, Holder LB, Nilsson EE et al. Histopathology slide classification with deep learning. PLoS Comput Biol 2023. (In Review). [Google Scholar]
- 35. Costa DL. Historical highlights of air pollution toxicology. Toxicol Sci 2018;164:5–8. [DOI] [PubMed] [Google Scholar]
- 36. Tudi M, Daniel Ruan H, Wang L et al. Agriculture development, pesticide application and its impact on the environment. Int J Environ Res Public Health 2021;18. [DOI] [PMC free article] [PubMed] [Google Scholar]
- 37. Young AL, Newton M. Long overlooked historical information on Agent Orange and TCDD following massive applications of 2,4,5-T-containing herbicides, Eglin Air Force Base, Florida. Environ Sci Pollut Res Int 2004;11:209–21. [DOI] [PubMed] [Google Scholar]
- 38. Giddens J, Kobayashi DR, Mukai GNM et al. Assessing the vulnerability of marine life to climate change in the Pacific Islands region. PloS one 2022;17:1–30. [DOI] [PMC free article] [PubMed] [Google Scholar]
- 39. Guihur A, Rebeaud ME, Goloubinoff P. How do plants feel the heat and survive? Trends Biochem Sci 2022;47:824–38. [DOI] [PubMed] [Google Scholar]
- 40. Koch CA, Sharda P, Patel J et al. Climate change and obesity. Horm Metab Res 2021;53:575–87. [DOI] [PMC free article] [PubMed] [Google Scholar]
- 41. de Lacerda JPA. The history of the dioxin issue in Brazil: from citrus pulp crisis to food monitoring (REVIEW). Environ Int 2019;122:11–20. [DOI] [PubMed] [Google Scholar]
- 42. Vogel SA. The politics of plastics: the making and unmaking of bisphenol a “safety”. Am J Public Health 2009;99:S559–66. [DOI] [PMC free article] [PubMed] [Google Scholar]
- 43. Munoz JP, Bleak TC, Calaf GM. Glyphosate and the key characteristics of an endocrine disruptor: A review. Chemosphere 2021;270:1–15. [DOI] [PubMed] [Google Scholar]
- 44. Trepanier C, Huang A, Liu M et al. Emerging uses of artificial intelligence in breast and axillary ultrasound. Clin Imaging 2023;100:64–8. [DOI] [PubMed] [Google Scholar]
- 45. Korolenko AA, Noll SE, Skinner MK. Epigenetic inheritance and transgenerational environmental justice. Yjbm 2023;96:241–50. [DOI] [PMC free article] [PubMed] [Google Scholar]
- 46. Manikkam M, Tracey R, Guerrero-Bosagna C et al. Dioxin (TCDD) induces epigenetic transgenerational inheritance of adult onset disease and sperm epimutations. PloS one 2012;7:1–15, e46249. [DOI] [PMC free article] [PubMed] [Google Scholar]
- 47. Kubsad D, Nilsson EE, King SE et al. Assessment of glyphosate induced epigenetic transgenerational inheritance of pathologies and sperm epimutations: generational toxicology. Sci Rep 2019;9:1–17. [DOI] [PMC free article] [PubMed] [Google Scholar]
- 48. Manikkam M, Tracey R, Guerrero-Bosagna C et al. Pesticide and insect repellent mixture (permethrin and DEET) induces epigenetic transgenerational inheritance of disease and sperm epimutations. Reprod Toxicol 2012;34:708–19. [DOI] [PMC free article] [PubMed] [Google Scholar]
- 49. Manikkam M, Tracey R, Guerrero-Bosagna C et al. Plastics derived endocrine disruptors (BPA, DEHP and DBP) induce epigenetic transgenerational inheritance of obesity, reproductive disease and sperm epimutations. PloS one 2013;8:1–18, e55387. [DOI] [PMC free article] [PubMed] [Google Scholar]
- 50. Manikkam M, Haque MM, Guerrero-Bosagna C et al. Pesticide methoxychlor promotes the epigenetic transgenerational inheritance of adult onset disease through the female germline. PloS one 2014;9:1–19, e102091. [DOI] [PMC free article] [PubMed] [Google Scholar]
- 51. McBirney M, King SE, Pappalardo M et al. Atrazine induced epigenetic transgenerational inheritance of disease, lean phenotype and sperm epimutation pathology biomarkers. PloS one 2017;12:1–37, e0184306. [DOI] [PMC free article] [PubMed] [Google Scholar]
- 52. Han T, Wang F, Song Q et al. An epigenetic basis of inbreeding depression in maize. Sci Adv 2021;7:1–12. [DOI] [PMC free article] [PubMed] [Google Scholar]
- 53. Cheptou PO, Donohue K. Epigenetics as a new avenue for the role of inbreeding depression in evolutionary ecology. Heredity 2013;110:205–6. [DOI] [PMC free article] [PubMed] [Google Scholar]
- 54. Pennisi E. European Society for Evolutionary Biology meeting. Epigenetics linked to inbreeding depression. Science 2011;333:1563. [DOI] [PubMed] [Google Scholar]
- 55. Skinner MK. What is an epigenetic transgenerational phenotype? F3 or F2. Reprod Toxicol 2008;25:2–6. [DOI] [PMC free article] [PubMed] [Google Scholar]
- 56. Ben Maamar M, Sadler-Riggleman I, Beck D et al. Alterations in sperm DNA methylation, non-coding RNA expression, and histone retention mediate vinclozolin-induced epigenetic transgenerational inheritance of disease. Environ Epigenetics 2018;4:1–19, dvy010. [DOI] [PMC free article] [PubMed] [Google Scholar]
- 57. Huang TT Jr, Yanagimachi R. Inner acrosomal membrane of mammalian spermatozoa: its properties and possible functions in fertilization. Am J Anat 1985;174:249–68. [DOI] [PubMed] [Google Scholar]
- 58. Calvin HI. Isolation of subfractionation of mammalian sperm heads and tails. Methods Cell Biol 1976;13:85–104. [DOI] [PubMed] [Google Scholar]
- 59. Bolger AM, Lohse M, Usadel B. Trimmomatic: a flexible trimmer for Illumina sequence data. Bioinformatics 2014;30:2114–20. [DOI] [PMC free article] [PubMed] [Google Scholar]
- 60. Langmead B, Salzberg SL. Fast gapped-read alignment with Bowtie 2. Nat Methods 2012;9:357–9. [DOI] [PMC free article] [PubMed] [Google Scholar]
- 61. Li H, Handsaker B, Wysoker A et al. The sequence alignment/map format and SAMtools. Bioinformatics 2009;25:2078–9. [DOI] [PMC free article] [PubMed] [Google Scholar]
- 62. Lienhard M, Grimm C, Morkel M et al. MEDIPS: genome-wide differential coverage analysis of sequencing data derived from DNA enrichment experiments. Bioinformatics 2014;30:284–6. [DOI] [PMC free article] [PubMed] [Google Scholar]
- 63. Robinson MD, McCarthy DJ, Smyth GK. edgeR: a Bioconductor package for differential expression analysis of digital gene expression data. Bioinformatics 2010;26:139–40. [DOI] [PMC free article] [PubMed] [Google Scholar]
- 64. Durinck S, Spellman PT, Birney E et al. Mapping identifiers for the integration of genomic datasets with the R/Bioconductor package biomaRt. Nat Protoc 2009;4:1184–91. [DOI] [PMC free article] [PubMed] [Google Scholar]
- 65. Yates AD, Achuthan P, Akanni W et al. Ensembl 2020. Nucleic Acids Res 2020;48:D682–D8. [DOI] [PMC free article] [PubMed] [Google Scholar]
- 66. Mi H, Muruganujan A, Casagrande JT et al. Large-scale gene function analysis with the PANTHER classification system. Nat Protoc 2013;8:1551–66. [DOI] [PMC free article] [PubMed] [Google Scholar]
- 67. Anway MD, Skinner MK. Transgenerational effects of the endocrine disruptor vinclozolin on the prostate transcriptome and adult onset disease. Prostate 2008;68:517–29. [DOI] [PMC free article] [PubMed] [Google Scholar]
- 68. Anway MD, Leathers C, Skinner MK. Endocrine disruptor vinclozolin induced epigenetic transgenerational adult-onset disease. Endocrinology 2006;147:5515–23. [DOI] [PMC free article] [PubMed] [Google Scholar]
- 69. Guerrero-Bosagna C, Settles M, Lucker BJ et al. Epigenetic transgenerational actions of vinclozolin on promoter regions of the sperm epigenome. PloS one 2010;5:1–17, e13100. [DOI] [PMC free article] [PubMed] [Google Scholar]
- 70. Nilsson E, Sadler-Riggleman I, Skinner MK. Environmentally induced epigenetic transgenerational inheritance of disease. Environ Epigenetics 2018;4:1–13, dvy016. [DOI] [PMC free article] [PubMed] [Google Scholar]
- 71. Taylor JA, Richter CA, Ruhlen RL et al. Estrogenic environmental chemicals and drugs: mechanisms for effects on the developing male urogenital system. J Steroid Biochem Mol Biol 2011;127:83–95. [DOI] [PMC free article] [PubMed] [Google Scholar]
- 72. Nilsson E, Klukovich R, Sadler-Riggleman I et al. Environmental toxicant induced epigenetic transgenerational inheritance of ovarian pathology and granulosa cell epigenome and transcriptome alterations: ancestral origins of polycystic ovarian syndrome and primary ovarian insufiency. Epigenetics 2018;13:875–95. [DOI] [PMC free article] [PubMed] [Google Scholar]
- 73. McAllister EJ, Dhurandhar NV, Keith SW et al. Ten putative contributors to the obesity epidemic. Crit Rev Food Sci Nutr 2009;49:868–913. [DOI] [PMC free article] [PubMed] [Google Scholar]
- 74. Xie F, Zhang R, Yang C et al. Long-term neuropeptide Y administration in the periphery induces abnormal baroreflex sensitivity and obesity in rats. Cell Physiol Biochem 2012;29:111–20. [DOI] [PubMed] [Google Scholar]
- 75. Phillips LK, Prins JB. The link between abdominal obesity and the metabolic syndrome. Curr Hypertens Rep 2008;10:156–64. [DOI] [PubMed] [Google Scholar]
- 76. Tan M, Le QV EfficientNetV2: smaller models and faster training. CoRR, abs/210400298. 2021:1–11.
- 77. Russakovsky O, Deng J, Su H et al. ImageNet large scale visual recognition challenge. Int J Comput Vis 2015;115:211–52. [Google Scholar]
Associated Data
This section collects any data citations, data availability statements, or supplementary materials included in this article.
Supplementary Materials
Data Availability Statement
All molecular data has been deposited into the public database at NCBI https://www.ncbi.nlm.nih.gov/geo/ (GEO # GSE244603), and R code computational tools are available at GitHub (https://github.com/skinnerlab/MeDIP-seq) and https://skinner.wsu.edu/genomic-data-and-r-code-files/. All computational tools can be downloaded for independent use.