

Summary
The combination of high sensitivity and rapid readout makes it possible for electron-counting detectors to record cryogenic electron microscopy data faster and more accurately without increasing the number of electrons used for data collection. This is especially useful for MicroED of macromolecular crystals where the strength of the diffracted signal at high resolution is comparable to the surrounding background. The ability to decrease fluence also alleviates concerns about radiation damage which limits the information that can be recovered from a diffraction measurement. The major concern with electron-counting direct detectors lies at the low end of the resolution spectrum: their limited linear range makes strong low-resolution reflections susceptible to coincidence loss and careful data collection is required to avoid compromising data quality. Nevertheless, these cameras are increasingly deployed in cryo-EM facilities, and several have been successfully used for MicroED. Provided coincidence loss can be minimized, electron-counting detectors bring high potential rewards.
Keywords: Electron-counting, MicroED, Microcrystal electron diffraction, Cryo-EM
Graphical Abstract
eTOC blurb
Sensitive electron-counting direct detectors with rapid readout rates can record more accurate data faster than integrating cameras. Hattne et al. discuss their use for structure determination by MicroED. A particular concern is coincidence loss, which may occur when electrons arrive on the detector in quick succession and needs to be controlled by careful data collection.
Introduction
Microcrystal electron diffraction (MicroED) is a technique in cryogenic electron microscopy (cryo-EM) that has proven effective for determining structures from crystalline samples that are only a few hundred nanometers thick 1,2. The method has significant advantages in structural biology because growing large and well-ordered crystals is often the bottleneck in crystallographic structure determination. This advantage stems from the larger cross-section and more favorable ratio of elastic to inelastic interactions of electrons with matter 3, which means that even minuscule crystals exposed to few electrons per unit area (low fluence, e− Å−1) can provide the necessary information to determine the structure at atomic resolution 4.
The resolution of the measurable data from a diffracting crystal is limited by the relative intensity in the reflections compared to the surrounding background. The intensity is proportional to the number of scattered electrons, which increases with the number of unit cells illuminated by the beam, so the diffracted intensity from a small crystal with fewer unit cells is correspondingly weaker. A faint reflection may not be discernible from the contribution of the solvent in or around the crystal, lattice disorder, or the Poisson noise of the scattering process. High-resolution features are particularly susceptible to this limitation because the spots from which they derive are inherently weaker than the low-resolution reflections near the center of the diffraction pattern. Therefore, sensitive electron detection devices are needed to accurately record the pixel values in the diffraction pattern to the highest resolution possible.
In the past, weak reflections in MicroED have typically been recovered by increasing the flux density (e− Å− 2 s−1). This increases the signal and reduces the Poisson noise for all reflections, but also leads to higher energy absorption by the sample, resulting in more radiation damage 5. This signal-to-damage trade-off is not unique to MicroED, but is a concern for all modalities of structural biology, particularly those dealing with very small samples 6,7. Increasing the flux density boosts the signal at high resolution but also amplifies the intensity of the strong spots at low resolution. This is not a concern when using integrating detectors with a high dynamic range, but can be problematic with direct electron-counting detectors, which are limited in their ability to distinguish individual electrons at high flux (e− s−1).
Electron-counting cameras can measure very low electron counts at high quantum efficiency. With these devices the accuracy of a diffraction measurement is ultimately determined by noise sources upstream of the electron detection process, such as shot noise. Unlike scintillator-based CCD or CMOS detectors that integrate the accumulated secondary effects, electron-counting devices rely on direct detection. The charge separation caused by primary electrons incident on the sensor is compared to set thresholds and individually registered, allowing single-electron events to be represented. Provided the threshold is exceeded, the flux can then be reduced without compromising the accuracy of the detection. However, counting cameras face a significant challenge when dealing with strong reflections 8. After an electron hits a pixel, the read-out electronics must reset before the next electron can be counted, lest two electrons striking the same pixel in rapid succession will be recorded as a single event. Such coincidence loss causes the detector response to become nonlinear and disrupts data reduction, which is based on the premise that the integrated intensity is proportional to the number of scattered electrons.
The limited count-rate capability of direct electron detectors poses a challenge for macromolecular MicroED. But with careful data collection and analysis, these detectors can provide data to higher resolution with fewer electrons per unit area. For weakly diffracting crystals of radiation-sensitive molecules, they may prove critical for successful structure solution. Here, we briefly summarize our experience with electron-counting cameras and discuss some practical aspects in their use for MicroED. The present discussion is necessarily limited to the devices we have had access to; other instruments have been successfully used for structure determination in other laboratories.
Results and discussion
Coincidence loss
Direct electron detectors operate at high internal frame rates (250 Hz for the Falcon 4, 320 Hz for the Falcon 4i, 400 Hz for the K2 Summit, and 1500 Hz for the K3). If the count rate capability is not greater than the internal frame rate at most one electron can be registered on a given pixel per internal frame and subsequent electrons on the pixel during the readout cycle are ignored. Under these conditions, pixels are independent and their values in an internal frame are inherently binary. To increase the information content per data transfer, the camera system sums batches of consecutive frames. Summation reduces the effective frame rate (~35 Hz for the Falcon 4 and Falcon 4i, 40 Hz for the K2 Summit, and >75 Hz for the K3) but does not degrade the accuracy of the pixel values since readout noise is negligible and noise due to variations in the deposited energy is eliminated by the discrete counting process 9,10. Because summation also increases the effective linear range on the summed frame, individual electrons can still be discerned in the recorded data (Figure 1).
Figure 1:

Closeups of the weak signal in diffraction patterns from proteinase K on different detectors. (a) Sum of 20 internal frames over 13 ms on the K3, where pixel values represent individual single-electron events. (b) MRC output of 35 summed internal frames over 140 ms on the Falcon 4, where electron events are amplified and distributed over several pixels. (c) The area in (b) after sharpening, which reduces the artificial spread in the MRC output from the Falcon 4 and recovers approximate electron counts. (d) For comparison, output from the Falcon 3 in integrating mode. All areas are 12×12 px2 in size and extracted at ~2 Å resolution. Unlabeled pixels in (a), (b), and (c) are zero.
Coincidence loss happens before the linear range of a pixel has been exhausted. Assuming the arrival time of electrons is randomly distributed and they impinge on a pixel capable of accurately registering counts per second (cps), such that each of the counting intervals is equally likely to see an electron during any given second, the probability of zero coincidence loss, , may be recursively modelled as
where for . This is a simplification, because the actual arrival time is not randomly distributed, but for sufficiently small , the error may be acceptable. This can be confirmed by simulating the corresponding Poisson process. However, because the total number of electrons in a given simulation will not necessarily equal the rate of the Poisson distribution, the result of the simulation diverges from the simple model as increases. For example, for cps, the probability of observing electrons without coincidence loss is zero. The corresponding Poisson process yields , because it accounts for the possibility that fewer than 11 electrons arrive on the detector in the simulated interval, and these can possibly be detected without loss (Figure 2).
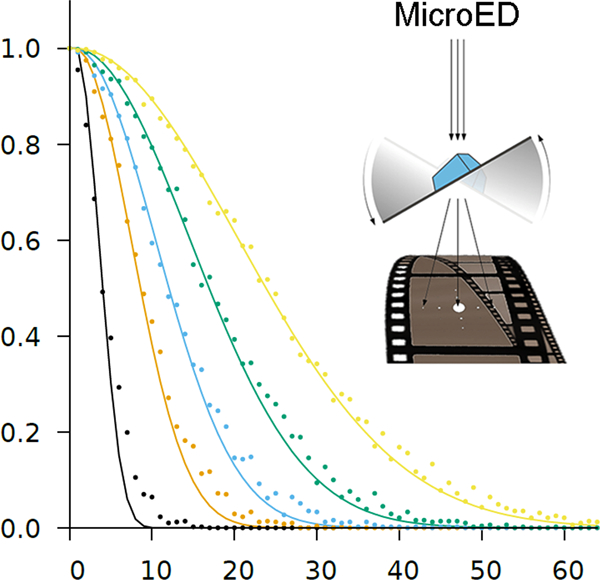
Figure 2:

The modelled probability of zero coincidence loss (no loss, ) as a function of flux for count rate capabilities between 10 cps (black) and 400 cps (yellow). Colored points indicate the probability derived from 512 simulation runs of the corresponding Poisson process.
The effective count rate capability can be increased by computational means. Signal processing in the camera system can transparently compensate for events that would otherwise result in coincidence loss 11,12. Various post-processing corrections have long been used to model some of the information lost due to pile-up with counting detectors of many different kinds 13. Post-processing of electron-counted diffraction data in software can generally be tailored towards the specific requirements of the measurement. Because the associated computational cost of processing the recorded images in multiple passes conflicts with rapid data collection and analysis 14 we currently do not make use of it in our workflow.
The only way to reduce corruption of the pixel values while collecting an electron-counted dataset on a given camera is to lower the flux to within the count rate capability of the pixels in the camera. To avoid sacrificing the weak high-resolution reflections, data can be collected in two passes 15: one pass aimed at recording the strongest low-resolution reflections and another pass for the high-resolution reflections. The flux during the low-resolution pass is minimized to avoid coincidence loss and radiation damage. The flux is increased for the high-resolution pass to capture the weak reflections without concern for pile-up in the low-resolution data. As with single-pass data collection, the optimal flux depends on the scattering power of the sample and trades completeness against signal strength and resolution. Multipass data collection predates counting: in X-ray crystallography it has been used to recover saturated pixel values that result when the flux is tuned to adequately measure weak reflections on integrating detectors.
For severely overexposed samples, pixel values are eventually capped at a maximum determined by the count rate capability of the camera. Importantly, measures of internal consistency such as and may not detect degradation of data quality due to coincidence loss because the integrated intensities tend to become more similar as intensities are only underestimated, but never overestimated. Instead, detrimental pile-up may be diagnosed during structure refinement from poor correlations between observed and calculated low-resolution reflections 16.
In practice, some coincidence loss is inevitable. Coincidence loss is most severe at low resolution, where the phasing method will ultimately determine how much degradation is tolerable 15. Quantifying coincidence loss is difficult due to several other factors that predominately affect low-resolution data. So far, molecular replacement has proven resilient to whatever systematic discrepancies are introduced by electron pile-up.
Fine-slicing and bandwidth concerns
The high sensitivity and high frame rate allow counting data to be collected in much finer slices than previously possible with scintillator-based cameras. Fine slicing of reciprocal space produces a large amount of data in a short time but captures the scattering process at much greater detail and allows for more accurate modelling of spot profiles 17. This information can be useful in refining the crystal structure and understanding its properties.
The rotation range of the finest measurable slice is determined by the effective frame rate of the camera and the slowest permissible rotation speed of the sample stage. In practice, the smallest rotation range is bound by the camera system’s memory buffers and network bandwidth because data must be transferred off the camera system in near-real time. The bandwidth concern can be addressed by compression since, even after internal summation, most pixel values in an electron-counted MicroED dataset are zero (Figure 3). Standard compression algorithms tend to perform well on such sparse data and the MicroED tools (see section Error Reference source not found.) can now decompress such files on the fly while converting data directly from the camera to formats readable by the downstream data reduction pipeline. Alternatively, emerging event-based image formats make more efficient use of computational resources in the camera system 18 and allow internal summation to be skipped altogether. While event-based formats are well-suited to store and transmit electron-counted data, they are not yet widely supported by pipelines for diffraction data reduction.
Figure 3:

Logarithmic histogram of pixel values on a single output frame. The statistics are calculated from all the pixels in the frames used to extract the corresponding smaller areas in Figure 1. (a) Sum of 20 internal frames on the K3. (b) MRC output of 35 summed internal frames on the Falcon 4, where single-electron events are affected by convolution. (c) The Falcon 4 dataset in (b) after sharpening. (d) For comparison, the Falcon 3 in integrating mode.
Image analysis
Electron-counting data have a noticeably different appearance from data recorded on an integrating, indirect detector (Figure 1). Because neither a scintillator nor fiberoptic coupling are needed the point-spread is essentially zero. Rather, the size of a reflection is mostly determined by factors such as crystal size, mosaicity, beam divergence, chromatic aberrations, and inelastic scattering that all come into play before the scattered electrons reach the detector surface. Since these effects become more apparent in the absence of point spread, it is conceivable that they could be better modelled during reduction of data from an electron-counting device. The distinctly discrete nature of electron-counting diffraction images also demands different analysis methods. This is not unique to MicroED data. For instance, Adxv 19 has options for enhancing spots on very weak backgrounds, and integration in XDS 20 is often improved by using settings originally devised for photon-counting X-ray detectors 16.
The cameras used in cryo-EM are generally developed for single-particle analysis, where the goal is to obtain the highest possible spatial resolution of images of single macromolecules. Recent models can be operated in superresolution mode, which increases spatial resolution by calculating the point of impact of an electron on the detector surface to subpixel precision. Superresolution is not as important for MicroED; rather, images are typically binned further to reduce processing time and produce sharper diffraction patterns. When storing images from the Falcon 4 in MRC format, some superresolution information appears to be retained by convoluting the raw data with one of 16 different kernels, determined by the sub-pixel position of the electron event (Figure 1).
Convolution blurs an electron event over a small area. It makes the distribution of pixel values more uniform and complicates recovery of single-electron events during electron diffraction data reduction (Figure 3). At high scattering angles, where a relatively small number of electron events tends to be well separated on the image, single electron events can be approximated by deconvoluting with the kernel that best matches the observed pattern (Figure 1). Sharpening at low scattering angles is challenging because the electron events are close together on the detector and the tails introduced by the convolution overlap. For binned images, the appropriate deconvolution kernel is ambiguous, regardless of the location of the electron event. Nevertheless, sharpening the Falcon 4 data by deconvolution can partially recover the overall pixel value statistics of a raw electron-counted diffraction pattern. Even so, we now circumvent the problem by using images before they are converted by the camera software.
To ensure uniform response across the detector surface, electron-counting data must be gain-corrected. Using images and correction files directly from the camera system is important, as any intermediate conversion steps carry the risk of introducing unwanted transformations and inconsistencies. To that end, the most recent MicroED tools can apply a gain correction while summing and converting the data from the camera system. Since the resulting unit gain images, where each electron increases the corresponding pixel value by one, are generally real-valued and cannot be losslessly represented in integer-based image formats such as SMV, pixel values can be scaled to reduce precision loss. For example, multiplication by 32 will preserve five bits of the fractional precision, which is usually sufficient. The factor introduced by this multiplication effectively changes the gain, which must be accounted for during subsequent data processing.
Conclusions
Fast-counting detectors have been used in X-ray crystallography for many years 21, where they have enabled shutterless collection of finely sliced rotation diffraction data. Their more recent use in cryo-EM is largely motived by their high frame rate, which enables image processing algorithms to correct for beam-induced motion which otherwise introduces blurring as the sample moves during the exposure 10. In contrast, reciprocal space, as captured on a diffraction pattern in MicroED, is invariant to translation. A fast-framing detector with negligible dead time allows data to be collected in continuous rotation mode without introducing gaps between frames 2. Continuous rotation under constant fluence avoids the need for synchronization between stage ramp-up, beam shuttering, and readout and has become common in other modes diffraction data collection as well 22.
The use of electron counting has improved the accuracy of MicroED data. In early work with a scintillator-based camera, practical considerations forced sacrifices in accuracy. To enable continuous rotation data collection the camera was configured in rolling shutter mode 23. In this mode, the TemCam-F416 could record data in a single uninterrupted sweep, but had no time for e.g. correlated double-sampling, and intensity modelling was required to recover high-resolution information lost to truncation 24. The processing pipeline with a counting direct electron detector is both simpler and provides more accurate data. A striking illustration is the successful phasing of two different macromolecules without reference to their known structures 4. Such ab initio phasing is critically dependent on data quality. Another example is provided by the structure of a protoglobin variant from crystals that had long resisted solution by synchrotron X-ray crystallography 25.
Due to their higher sensitivity, direct electron detectors allow for lower fluences and shorter exposure times without compromising the quality of the data. This reduces the total dose absorbed by the sample, which in turn decreases radiation damage 5,26. Ideally, the noise in the electron detection process is eliminated, such that the error in a diffraction measurement and the amount of information that can be extracted from a diffraction crystal, is entirely determined by noise sources upstream of electron detection. The ability to collect useful data using fewer electrons has been a hallmark of MicroED since its inception, and the required fluence generally continues to trend downwards (Table 1). Methodological advances, notably FIB-milling for better control of the sample thickness 27, have improved the data quality as judged by signal strength and agreement between observations and atomic model (, ). With counting detectors, results of similar or better quality have been obtained even with reduced total fluence.
Table 1:
Merging and refinement statistics from proteinase K have improved over time owing to advances in sample preparation, data collection, and detector technology. Italicized columns indicate that the corresponding structures were obtained from FIB-milled crystals; columns set in bold denote that electron-counting was used. Resolution and are strongly dependent on the number of electrons used to collect the data and have generally improved despite the decreased total fluence.
| Camera | TemCam-F416 (6cl7) 5 | Falcon 3 (6pu4) 26 | CetaD (7jsy) 28 | Falcon 4 (7skx) 4 | Falcon 4 (8fyq) 29 |
|---|---|---|---|---|---|
| Number of crystals | 6 | 3 | 1 | 2 | 5 |
| Resolution (Å) | 20.74–1.71 | 27.64–2.10 | 43.32–1.78 | 43.35–1.50 | 19.77–1.40 |
| 3.8 | 3.1 | 7.8 | 5.7 | 7.6 | |
| 0.95 | 0.91 | 0.97 | 0.99 | 0.99 | |
| 22.13 / 25.34 | 22.06 / 26.70 | 16.94 / 20.94 | 14.95 / 20.46 | 13.74 / 17.50 | |
| Total fluence (e− Å−2) | 1.8 | 1.3 | 2.4 | 1.0 | 1.0 |
Coincidence loss remains a concern for electron-counted MicroED data. But detector manufacturers are continuously increasing frame rates and improving electron-detection algorithms to extend the count-rate capabilities of their products. Integrating detectors have been designed to overcome the problem in X-ray diffraction by automatically switching to low-gain integrating mode when the flux exceeds a set threshold 8. Emerging hybrid detectors may alleviate the problem of coincidence loss because they can record both strong and weak signals at high accuracy. These hybrid detectors have successfully been used for small-molecule MicroED by several laboratories but have not been thoroughly tested with macromolecular MicroED; their relatively smaller number of pixels currently make them less attractive for work on crystals with large unit cells. Because their larger pixel sizes also render them less suited for single-particle analysis, they tend to be rare in cryo-EM facilities.
STAR methods
Resource availability
Lead contact
Further information and requests for resources should be directed to and will be fulfilled by the lead contact, Tamir Gonen (tgonen@g.ucla.edu).
Materials availability
This study did not generate any new reagents.
Data and code availability
Atomic coordinates and density maps are available from the Protein Data Bank and the Electron Microscopy Data Bank, respectively, under ID codes given in the Key resources table.
The source code for the MicroED tools (RRID:SCR_021179) with multithreaded summation, compression, and gain-correction support is available from https://cryoem.ucla.edu/downloads. The next upcoming snapshot can convert all versions of Gatan’s Digital Micrograph format to either SMV or TIFF.
Any additional information required to reanalyze the data reported in this paper is available from the lead contact upon request.
Key resources table
| Reagent or resource | Source | Identifier |
|---|---|---|
| Deposited data | ||
| Proteinase K on TemCam-F416 | 5 | PDB: 6cl7; EMDB: EMD-7490 |
| Proteinase K on Falcon 3 | 26 | PDB: 6pu4; EMDB: EMD-20475 |
| Proteinase K on CetaD | 28 | PDB: 7jsy; EMDB: EMD-22463 |
| Proteinase K on Falcon 4 | 4 | PDB: 7skx; EMDB: EMD-25185 |
| Proteinase K on K2 Summit | 16 | PDB: 8e52; EMDB: EMD-27900 |
| Proteinase K on K3 | 16 | PDB: 8e53; EMD: EMD-27901 |
| Proteinase K on Falcon 4 | 29 | PDB: 8fyq; EMDB: EMD-29590 |
| Software and algorithms | ||
| Adxv | 19 | |
| AIMLESS | 30 | RRID:SCR_015747 |
| MicroED tools | 31 | RRID:SCR_021179 |
| phenix.refine | 32 | RRID:SCR_016736 |
| REFMAC | 33 | RRID:SCR_014225 |
| XDS | 20 | RRID:SCR_015652 |
Method details
Data collection
Data were collected on an FEI Tecnai F20 transmission electron microscope with a TVIPS TemCam-F416 camera, a Thermo Fisher Talos Arctica with a Falcon 3 or CetaD camera, and a Thermo Fisher Titan Krios with a Falcon 4, Gatan K2 Summit, or Gatan K3 camera, as detailed in their respective primary publications.
Quantification and statistical analysis
The statistical analysis underlying the values in Table 1 was performed using the data reduction software listed in the Key resources table; see the primary publication for each model for further details.
Highlights.
Electron-counting can improve the accuracy of MicroED data
Coincidence loss may affect data collected with electron-counting direct detectors
Adapting the data collection strategy can reduce the effects of coincidence loss
Acknowledgments
We would like to acknowledge Alexis Rohou (Genentech) and Jonathan Herrmann (Thermo Fisher) for fruitful discussions. This study was supported by the National Institutes of Health P41GM136508. Portions of this research or manuscript completion were developed with funding from the Department of Defense grants MCDC-2202-002 and HDTRA1-21-1-0004. Effort sponsored by the U.S. Government under Other Transaction number W15QKN-16-9-1002 between the MCDC, and the Government. The US Government is authorized to reproduce and distribute reprints for Governmental purposes, notwithstanding any copyright notation thereon. The views and conclusions contained herein are those of the authors and should not be interpreted as necessarily representing the official policies or endorsements, either expressed or implied, of the U.S. Government. The PAH shall flowdown these requirements to its subawardees, at all tiers. The Gonen laboratory is supported by funds from the Howard Hughes Medical Institute.
Footnotes
Publisher's Disclaimer: This is a PDF file of an unedited manuscript that has been accepted for publication. As a service to our customers we are providing this early version of the manuscript. The manuscript will undergo copyediting, typesetting, and review of the resulting proof before it is published in its final form. Please note that during the production process errors may be discovered which could affect the content, and all legal disclaimers that apply to the journal pertain.
Declaration of interests
The authors declare no competing interests.
References
- 1.Shi D, Nannenga BL, Iadanza MG, and Gonen T (2013). Three-dimensional electron crystallography of protein microcrystals. eLife 2, e01345. 10.7554/elife.01345. [DOI] [PMC free article] [PubMed] [Google Scholar]
- 2.Nannenga BL, Shi D, Leslie AGWW, and Gonen T (2014). High-resolution structure determination by continuous-rotation data collection in MicroED. Nat. Methods 11, 927–930. 10.1038/nmeth.3043. [DOI] [PMC free article] [PubMed] [Google Scholar]
- 3.Henderson R (1995). The potential and limitations of neutrons, electrons and X-rays for atomic resolution microscopy of unstained biological molecules. Q. Rev. Biophys 28, 171–193. 10.1017/S003358350000305X. [DOI] [PubMed] [Google Scholar]
- 4.Martynowycz MW, Clabbers MTB, Hattne J, and Gonen T (2022). Ab initio phasing macromolecular structures using electron-counted MicroED data. Nat. Methods 19, 724–729. 10.1038/s41592-022-01485-4. [DOI] [PMC free article] [PubMed] [Google Scholar]
- 5.Hattne J, Shi D, Glynn C, Zee C-T, Gallagher-Jones M, Martynowycz MW, Rodriguez JA, and Gonen T (2018). Analysis of Global and Site-Specific Radiation Damage in Cryo-EM. Structure 26, 759–766.e4. 10.1016/j.str.2018.03.021. [DOI] [PMC free article] [PubMed] [Google Scholar]
- 6.Holton JM, and Frankel KA (2010). The minimum crystal size needed for a complete diffraction data set. Acta Crystallogr. D Biol. Crystallogr 66, 393–408. 10.1107/S0907444910007262. [DOI] [PMC free article] [PubMed] [Google Scholar]
- 7.Yamamoto M, Hirata K, Yamashita K, Hasegawa K, Ueno G, Ago H, and Kumasaka T (2017). Protein microcrystallography using synchrotron radiation. IUCrJ 4, 1–11. 10.1107/S2052252517008193. [DOI] [PMC free article] [PubMed] [Google Scholar]
- 8.Leonarski F, Redford S, Mozzanica A, Lopez-Cuenca C, Panepucci E, Nass K, Ozerov D, Vera L, Olieric V, Buntschu D, et al. (2018). Fast and accurate data collection for macromolecular crystallography using the JUNGFRAU detector. Nat. Methods 15, 799–804. 10.1038/s41592-018-0143-7. [DOI] [PubMed] [Google Scholar]
- 9.Battaglia M, Contarato D, Denes P, Doering D, Giubilato P, Kim TS, Mattiazzo S, Radmilovic V, and Zalusky S (2009). A rad-hard CMOS active pixel sensor for electron microscopy. Nucl. Instrum. Methods Phys. Res. Sect. Accel. Spectrometers Detect. Assoc. Equip 598, 642–649. 10.1016/j.nima.2008.09.029. [DOI] [Google Scholar]
- 10.Li X, Mooney P, Zheng S, Booth CR, Braunfeld MB, Gubbens S, Agard DA, and Cheng Y (2013). Electron counting and beam-induced motion correction enable near-atomic-resolution single-particle cryo-EM. Nat. Methods 10, 584–590. 10.1038/nmeth.2472. [DOI] [PMC free article] [PubMed] [Google Scholar]
- 11.Loeliger T, Bronnimann C, Donath T, Schneebeli M, Schnyder R, and Trub P (2012). The new PILATUS3 ASIC with instant retrigger capability. In 2012 IEEE Nuclear Science Symposium and Medical Imaging Conference Record (NSS/MIC) (IEEE), pp. 610–615. 10.1109/NSSMIC.2012.6551180. [DOI] [Google Scholar]
- 12.Trueb P, Dejoie C, Kobas M, Pattison P, Peake DJ, Radicci V, Sobott BA, Walko DA, and Broennimann C (2015). Bunch mode specific rate corrections for PILATUS3 detectors. J. Synchrotron Radiat 22, 701–707. 10.1107/S1600577515003288. [DOI] [PMC free article] [PubMed] [Google Scholar]
- 13.Müller JW (1973). Dead-time problems. Nucl. Instrum. Methods 112, 47–57. 10.1016/0029-554X(73)90773-8. [DOI] [Google Scholar]
- 14.Unge J, Lin J, Weaver SJ, Sae Her A, and Gonen T (2023). Autonomous MicroED data collection enables compositional analysis. Preprint at Chemistry, 10.26434/chemrxiv-2023-8qvwg 10.26434/chemrxiv-2023-8qvwg. [DOI] [PMC free article] [PubMed]
- 15.Dauter Z (2017). Collection of X-Ray Diffraction Data from Macromolecular Crystals. In New Comprehensive Biochemistry, pp. 165–184. 10.1007/978-1-4939-7000-1_7. [DOI] [PMC free article] [PubMed] [Google Scholar]
- 16.Clabbers MTB, Martynowycz MW, Hattne J, Nannenga BL, and Gonen T (2022). Electron-counting MicroED data with the K2 and K3 direct electron detectors. J. Struct. Biol 214, 107886. 10.1016/j.jsb.2022.107886. [DOI] [PMC free article] [PubMed] [Google Scholar]
- 17.Pflugrath JW (1999). The finer things in X-ray diffraction data collection. Acta Crystallogr. D Biol. Crystallogr 55, 1718–1725. 10.1107/S090744499900935X. [DOI] [PubMed] [Google Scholar]
- 18.Guo H, Franken E, Deng Y, Benlekbir S, Singla Lezcano G, Janssen B, Yu L, Ripstein ZA, Tan YZ, and Rubinstein JL (2020). Electron-event representation data enable efficient cryoEM file storage with full preservation of spatial and temporal resolution. IUCrJ 7, 860–869. 10.1107/S205225252000929X. [DOI] [PMC free article] [PubMed] [Google Scholar]
- 19.Szebenyi DME, Arvai a, Ealick SE, Laiuppa JM, and Nielsen C (1997). A system for integrated collection and analysis of crystallographic diffraction data. J. Synchrotron Radiat 4, 128–135. 10.1107/S0909049597000204. [DOI] [PubMed] [Google Scholar]
- 20.Kabsch W (2010). XDS. Acta Crystallogr. D Biol. Crystallogr 66, 125–132. 10.1107/S0907444909047337. [DOI] [PMC free article] [PubMed] [Google Scholar]
- 21.Broennimann C, Eikenberry EF, Henrich B, Horisberger R, Huelsen G, Pohl E, Schmitt B, Schulze-Briese C, Suzuki M, Tomizaki T, et al. (2006). The PILATUS 1M detector. J. Synchrotron Radiat 13, 120–130. 10.1107/S0909049505038665. [DOI] [PubMed] [Google Scholar]
- 22.Powell HR (2017). X-ray data processing. Biosci. Rep 37, BSR20170227. 10.1042/BSR20170227. [DOI] [PMC free article] [PubMed] [Google Scholar]
- 23.Stumpf M, Bobolas K, Daberkow I, Fanderl U, Heike T, Huber T, Kofler C, Maniette Y, and Tietz H (2010). Design and Characterization of 16 MegaPixel Fiber Optic Coupled CMOS Detector for Transmission Electron Microscopy. Microsc. Microanal 16, 856–857. 10.1017/S1431927610054516. [DOI] [Google Scholar]
- 24.Hattne J, Shi D, de la Cruz MJ, Reyes FE, and Gonen T (2016). Modeling truncated pixel values of faint reflections in MicroED images. J. Appl. Crystallogr 49, 1029–1034. 10.1107/S1600576716007196. [DOI] [PMC free article] [PubMed] [Google Scholar]
- 25.Danelius E, Porter NJ, Unge J, Arnold FH, and Gonen T (2023). MicroED Structure of a Protoglobin Reactive Carbene Intermediate. J. Am. Chem. Soc 145, 7159–7165. 10.1021/jacs.2c12004. [DOI] [PMC free article] [PubMed] [Google Scholar]
- 26.Hattne J, Martynowycz MW, Penczek PA, and Gonen T (2019). MicroED with the Falcon III direct electron detector. IUCrJ 6, 921–926. 10.1107/S2052252519010583. [DOI] [PMC free article] [PubMed] [Google Scholar]
- 27.Martynowycz MW, Clabbers MTB, Unge J, Hattne J, and Gonen T (2021). Benchmarking the ideal sample thickness in cryo-EM. Proc. Natl. Acad. Sci 118, e2108884118. 10.1073/pnas.2108884118. [DOI] [PMC free article] [PubMed] [Google Scholar]
- 28.Martynowycz MW, and Gonen T (2021). Ligand Incorporation into Protein Microcrystals for MicroED by On-Grid Soaking. Structure 29, 88–95.e2. 10.1016/j.str.2020.09.003. [DOI] [PMC free article] [PubMed] [Google Scholar]
- 29.Martynowycz MW, Shiriaeva A, Clabbers MTB, Nicolas WJ, Weaver SJ, Hattne J, and Gonen T (2023). A robust approach for MicroED sample preparation of lipidic cubic phase embedded membrane protein crystals. Nat. Commun 14, 1086. 10.1038/s41467-023-36733-4. [DOI] [PMC free article] [PubMed] [Google Scholar]
- 30.Evans PR, and Murshudov GN (2013). How good are my data and what is the resolution? Acta Crystallogr. D Biol. Crystallogr 69, 1204–1214. 10.1107/S0907444913000061. [DOI] [PMC free article] [PubMed] [Google Scholar]
- 31.Hattne J, Reyes FE, Nannenga BL, Shi D, de la Cruz MJ, Leslie AGWW, and Gonen T (2015). MicroED data collection and processing. Acta Crystallogr. Sect. Found. Adv 71, 353–360. 10.1107/S2053273315010669. [DOI] [PMC free article] [PubMed] [Google Scholar]
- 32.Afonine PV, Grosse-Kunstleve RW, Echols N, Headd JJ, Moriarty NW, Mustyakimov M, Terwilliger TC, Urzhumtsev A, Zwart PH, and Adams PD (2012). Towards automated crystallographic structure refinement with phenix.refine. Acta Crystallogr. D Biol. Crystallogr 68, 352–367. 10.1107/S0907444912001308. [DOI] [PMC free article] [PubMed] [Google Scholar]
- 33.Kovalevskiy O, Nicholls RA, Long F, Carlon A, and Murshudov GN (2018). Overview of refinement procedures within REFMAC 5: utilizing data from different sources. Acta Crystallogr. Sect. Struct. Biol 74, 215–227. 10.1107/S2059798318000979. [DOI] [PMC free article] [PubMed] [Google Scholar]
Associated Data
This section collects any data citations, data availability statements, or supplementary materials included in this article.
Data Availability Statement
Atomic coordinates and density maps are available from the Protein Data Bank and the Electron Microscopy Data Bank, respectively, under ID codes given in the Key resources table.
The source code for the MicroED tools (RRID:SCR_021179) with multithreaded summation, compression, and gain-correction support is available from https://cryoem.ucla.edu/downloads. The next upcoming snapshot can convert all versions of Gatan’s Digital Micrograph format to either SMV or TIFF.
Any additional information required to reanalyze the data reported in this paper is available from the lead contact upon request.
Key resources table
| Reagent or resource | Source | Identifier |
|---|---|---|
| Deposited data | ||
| Proteinase K on TemCam-F416 | 5 | PDB: 6cl7; EMDB: EMD-7490 |
| Proteinase K on Falcon 3 | 26 | PDB: 6pu4; EMDB: EMD-20475 |
| Proteinase K on CetaD | 28 | PDB: 7jsy; EMDB: EMD-22463 |
| Proteinase K on Falcon 4 | 4 | PDB: 7skx; EMDB: EMD-25185 |
| Proteinase K on K2 Summit | 16 | PDB: 8e52; EMDB: EMD-27900 |
| Proteinase K on K3 | 16 | PDB: 8e53; EMD: EMD-27901 |
| Proteinase K on Falcon 4 | 29 | PDB: 8fyq; EMDB: EMD-29590 |
| Software and algorithms | ||
| Adxv | 19 | |
| AIMLESS | 30 | RRID:SCR_015747 |
| MicroED tools | 31 | RRID:SCR_021179 |
| phenix.refine | 32 | RRID:SCR_016736 |
| REFMAC | 33 | RRID:SCR_014225 |
| XDS | 20 | RRID:SCR_015652 |