

Abstract
Nitric acid is one of the most important products in the chemical industry, ranking third globally in terms of acid production. Although nitric acid has many industrial applications, its primary function is the production of ammonium nitrate, which is used in the fertilizer industry. In this report, we propose a plan for an Ostwald process plant that will produce 1000 metric tons of nitric acid per day. Based on an effective energy analysis, we have concluded that using a single pressure method provides optimal results. First, ammonia is vaporized using process heat at 1000 kPa and 35 °C before being superheated using steam to a temperature of 80 °C. Filtered air is compressed by an axial compressor to a discharge pressure of approximately 740 kPa and a temperature of 155 °C. After conducting a site evaluation, three existing manufacturing sites are being considered for the acid production plant: Ogun State (Nigeria), Gwadar Seaport (Pakistan), and Ras-Alkhair Seaport (Saudi Arabia). Based on the results of the site assessment, Ras-Alkhair has been selected as the most suitable location for the nitric acid plant. About 65 % of all nitric acid produced worldwide is used in the production of ammonium nitrate, which is in turn used in the fertilizer and explosives industries. The synthetic nitric acid that will be produced from this plant will be used in the production of fertilizers.
1. Introduction
The Ostwald process is the basis for synthesizing nitric acid. In this method, ammonia is fed to platinum gauze, oxidized, and then absorbed by water to produce nitric acid. Weak nitric acid is considered to be nitric acid with a concentration of 69.20 % or less. The main use of nitric acid is for the production of mineral fertilizers (NPK fertilizers and calcium ammonium nitrate). Weak nitric acid is also used to make ammonium nitrate and adipic acid, which are the raw materials used to produce nylon and polyester.
There are a variety of process methods used to manufacture weak nitric acid, and the main differences are in the operating pressures. The pressure scale is as follows:
-
•
N: Atmospheric pressure or below, used only for catalytic ammonia oxidation
-
•
M: Medium pressure (3–6 bar)
-
•
H: High pressure (greater than 8 bar)
The creation of weak nitric acid is shown in a simple schematic form in Fig. 1. There are two main types of plants used to produce nitric acid: those that use a single pressure and those that use two separate pressures.
Fig. 1.

Schematic diagram of the production of weak nitric acid [1].
1.1. Nitrogen oxide emissions and emission reduction
During the production of nitric acid, the pressure applied in the absorption phase has a significant impact on the amount of nitrogen oxide (NOx) that is released. Low NOx emissions in nitric acid production can be achieved using end-of-pipe technologies and/or high absorption efficiencies, including high absorption pressures. Most nitric acid plants have installed end-of-pipe technologies to reduce NOx emissions [2]. Selective catalytic reduction (SCR) is the most cutting-edge end-of-pipe technology for reducing NOx emissions. Due to its high levels of secondary pollutants and fuel consumption, the nonselective catalytic reduction (NSCR) is not considered a cutting-edge technology. Similarly, alkaline final absorption is considered an outdated technology. Selective noncatalytic reduction techniques are not used to reduce NOx emissions in nitric acid production. The most effective way to reduce NOx emissions in nitric acid production is to use end-of-pipe technologies, such as SCR. Other technologies, such as NSCR and alkaline final absorption, are less effective and/or outdated.
1.2. Selective catalytic reduction
Ammonia is commonly used as a reducing agent to selectively react with nitrogen oxides in waste gas. SCR can reduce emissions up to 95 %, making it the optimal technology for nitric acid facilities [3]. A combination of SCR and high-pressure absorption (8 bar) is considered the state-of-the-art technology for new nitric acid-producing plants. At high-pressure absorption facilities, SCR methods achieve NOx emissions of 100–200 mg NOx/Nm3 (as NO2).
1.3. Non-selective catalytic reduction
Through a catalytic process, the oxygen in NOx and N2O reacts with fuel (natural gas or hydrogen). Reaction of gasoline with nitrogen dioxide (NO2) forms nitrogen monoxide (NO), which darkens the exhaust stream after passing through the catalyst [4]. To completely eliminate NO and N2O, the fuel must completely react with the free oxygen in the exhaust gas (1–4 volume percent). This reaction also has other consequences, such as increased fuel consumption and secondary emissions of carbon monoxide, hydrogen chloride, carbon dioxide, and volatile organic compounds. Therefore, NSCR is not cutting-edge technology for reducing NOx emissions in nitric acid facilities.
1.4. Ostwald process
The Ostwald process is a chemical process that is used to produce nitric acid from ammonia. It is one of the most important industrial processes in the world, as nitric acid is used in a wide range of products, including fertilizers, explosives, and dyes.
Nitric acid is produced using the Ostwald process. In this process, ammonia is oxidized with air to produce nitric oxide (NO). Nitric oxide is further oxidized to produce nitrogen dioxide (NO2), which is then absorbed by water to form nitric acid (HNO3). Weak nitric acid, which has a concentration of up to 69.20 %, is the most common form of nitric acid and is widely used in fertilizer production.
Process technologies vary in their working pressures due to different thermodynamic conditions during ammonia absorption and combustion. There are three pressure classifications: low pressure (N), medium pressure (M), and high pressure (H).
Temperature, flow rate, and other parameters can be modified at each step of the process to meet individual needs and conditions. Temperature, pressure, and gas flow rate are all important factors during ammonia oxidation and subsequent plant operations.
Ammonia oxidation plants are typically classified by the pressure of the ammonia oxidation converter: low (atmospheric), medium (3–5 atm), or high (4–9 atm or 5–9 atm). Ammonia oxidation at low pressure is more efficient and results in lower platinum metal losses than oxidation at high or medium pressures. However, low-pressure converters are larger and more expensive than high-pressure converters, and they require expensive hot-gas compressors to raise the gas pressure after oxidation to the levels required for the subsequent stages [5]. All American high-pressure nitric acid plants use the Du Pont process, which has a converter pressure of around 8 atm and a gauze pad temperature of 900–950 °C. These units also have higher gas flow rates per unit area of gauze, resulting in significant platinum loss rates of 250–400 mg/ton HNO3 at 100 % [6]. Platinum losses in medium-pressure converters with gauze temperatures of 845–880 °C range from 85 to 125 mg/ton, while metal losses in atmospheric pressure converters with gauze temperatures of about 80 °C are approximately 50 mg/ton [6].
There are two main approaches to nitric acid production: mixed-pressure plants and constant-pressure plants. With low ammonia prices, the benefits of higher conversion efficiencies from atmospheric pressure converters may not be enough to offset the relatively high capital and operating costs of mixed-pressure plants. As a result, constant-pressure approaches, where the converter and subsequent sections of the plant operate at the same pressure (typically in the range 3–9 atm), are becoming more popular in Europe. The optimal operating pressure for financial efficiency depends on a number of factors, including ammonia costs, steam credit value, and tax conditions.
The Ostwald process is a versatile and efficient method for producing nitric acid. It can be adapted to produce nitric acid of different concentrations and purities, making it suitable for a wide range of applications.
1.5. Raw materials
Nitric acid (HNO3) is produced by the oxidation of ammonia in air to form nitric oxide (NO). The nitric oxide is then absorbed by water to form nitric acid. Nitric acid is produced by reacting ammonia, water, and air, with a typical ammonia-to-nitric acid ratio of 280–290 kg NH3/ton of HNO3 [7]. The oxidation of ammonia at moderate or high pressures can lead to the loss of valuable metals in plants [8]. Recovery techniques can be implemented at the catalytic reactor to recover these metals [9].
2. Literature review
2.1. Ammonia
Approximately one ton of 100 % nitric acid can be obtained from 280 to 290 kg of ammonia, with slight variations in how the production method is carried out. The primary function of the plant is to produce ammonia for nitric acid production. Natural gas is the most common fuel used for steam reforming hydrocarbons to produce ammonia. Steam reforming uses steam in a heated primary converter, then air in a secondary converter, to produce synthesis gas (nitrogen [N2], hydrogen [H2], water [H2O], and carbon monoxide [CO]). Condensation, methanation, and chemical or physical absorption are used to remove water (H2O), carbon monoxide (CO), and carbon dioxide (CO2) from the synthesis gas before compressing it to produce ammonia on an iron catalyst [10].
Important environmental factors in ammonia production include the quantity of feedstock required, the energy used to heat the main reformer, and the availability of a suitable heat recovery system. Emissions of waste gases from the main reformer, including carbon dioxide, nitrogen oxides, ammonia, sulfur dioxide, and dust, are also important environmental considerations. During the synthetic loop, CO2, CH4, and purge gases are also removed, resulting in ammonia and methane emissions. Condensation removes processed water from the synthesis gas, which is then discharged to the environment. Efficient wastewater treatment (including ammonia recovery via stripping techniques) is a state-of-the-art technique. In addition, used catalysts and hydraulic fluids produce waste [11].
2.2. Air
The total amount of air required to produce one ton of nitric acid (at 100 % efficiency) is between 3600 and 3800 cubic meters (Nm³). In medium- and high-pressure ammonia oxidation processes, secondary air accounts for approximately 10–20 % of the total air provided. As the pressure rises, the amount of secondary air that mixes with the main air decreases [12]. During N/M operations, about 30 % of the air is supplied as secondary air. The conversion of nitrogen dioxide (N2O4) into nitric acid requires liquid air, which is produced during the manufacturing of concentrated nitric acid.
2.3. Water
Water is a byproduct of ammonia oxidation and needs to be removed from the process before the nitric acid can be concentrated. Ammonia oxidation produces about 1.93 tons of water per ton of nitrogen. The concentration of nitric acid in the condensed product typically ranges from 2 % to 45 %, depending on the oxidation pressure. Water is removed from the combustion gases by cooling the downstream ammonia oxidation process [13]. The cooled oxidized ammonia condenses the water, which can then be removed from the gases during combustion. During the production of weak nitric acid, the condensation process that follows the ammonia combustion process is completely transferred to the absorption column. The absorption process also uses demineralized water that is produced by condensing the steam. About 0.20 cubic meters of water per ton of nitric acid is required in the condensate process for the production of weak nitric acid, starting from a concentration of 59.6 %.
2.4. Catalysts
Platinum-rhodium catalysts are widely used for ammonia combustion catalysis due to their high activity and selectivity. The catalyst is typically made by weaving a gauze with a very fine mesh, which provides a large surface area for the reaction to occur. A platinum-rhodium ratio of 95 % platinum to 5–10 % rhodium is commonly used for ammonia combustion catalysis. The catalyst is made by weaving gauze with a very fine mesh. Multiple layers of catalyst are present in ammonia combustion reactors. The number of catalyst layers changes when the ammonia combustion pressure changes. The synthesis of nitric acid causes catalyst exhaustion due to the consumption of precious metal [14]. Vaporization and mechanical losses are the main causes of precious metal loss, with mechanical failures accounting for about 20–25 % of the total loss. Evidence suggests that the formation of platinum dioxide, which has a short half-life, is responsible for platinum loss due to vaporization [15]. Precious metal loss increases with increasing gas velocity and temperature.
2.5. Products
Nitric acid is a versatile chemical produced in two main ways: by oxidizing ammonia and by absorbing nitrogen dioxide [16]. Weak nitric acid (30–70 %) is used to produce ammonium nitrate, calcium ammonium nitrate, NPK fertilizers, urea ammonium nitrate fertilizers, and other fertilizers [17]. It is also used to produce adipic acid, a key component of polyester and nylon, among other chemicals [17]. Concentrated nitric acid (greater than 70 %) is used to produce nitric acid esters and nitro-aromatic chemicals [18]. Nitric acid esters are used as solvents, fuels, and explosives. Nitro-aromatic chemicals are used to produce dyes, plastics, and explosives [18].
2.6. Physical properties
Nitric acid (molar mass: 63.01) is miscible with water in any amount. It has the highest azeotrope with water at a concentration of 69.20 % by weight, which boils at 121.80 °C. Pure anhydrous nitric acid boils between 83 and 87 °C. When nitric acid is heated, it decomposes into its component parts, producing nitrogen dioxide, which turns the acid yellow or red at high enough concentrations. This is known as “red fuming nitric acid” because the fumes absorb moisture. In a pure anhydrous state, nitric acid liquid has no color.
Nitric acid releases combustible vapors with an overwhelming and stifling smell when it is exposed to water. It has a melting point of −41.60 °C and a boiling point of 82.60 °C. Its density at 25 °C is 1.51 g/cm³, and it dissolves easily in water. The highest consistent boiling point of water and dissolved nitric acid is 120.50 °C, and the mixture contains 68.5 % nitric acid with a density of 1.41 g/cm³ at 20 °C. Fumed nitric acid is a highly concentrated liquid form of nitric acid that includes NO2. The color of fumed nitric acid ranges from yellow to red, depending on the concentration of NO2 [19]. The physical properties of nitric acid are crucial for understanding its behavior. Table 1 provides a comprehensive summary of these properties.
Table 1.
Pure nitric acid's physical properties [20].
| Dynamic Viscosity | Surface Tension | Density | |||
|---|---|---|---|---|---|
| At 0 °C | 1.09 mPa s | At 0 °C | 0.044 N/m | At 0 °C | 1549.20 kg/m3 |
| At 25 °C | 0.75 mPa s | At 20 °C | 0.041 N/m | At 20 °C | 1512.80 kg/m3 |
| At 40 °C | 0.62 mPa s | At 40 °C | 0.040 N/m | At 40 °C | 1476.40 kg/m3 |
| Standard Enthalpy of Formation | Specific Heat | Thermal conductivity at 20 °C | 0.34 W/m K | ||
| Gas | 2.13 J/g | At 0 °C | 1.76 J/g K | Refractive index (n) | 1.40 |
| Liquid | 2.75 J/g | At 20 °C | 1.75 J/g K | Heat of vaporization at 20 °C | 626.30 J/g |
2.7. Chemical properties
Nitric acid is reasonably stable at normal temperatures, but above 68 °C, heat causes it to decompose. Nitric acid is a powerful monoprotic acid because it is highly ionized in water solutions (93 % in 0.10 M). Metallic ions used as reducing agents combine with metallic oxides, bases, and carbonates to form water and salts. Nitric acid solutions contain strong oxidizers, which damage nearly all metals, with exceptions including tantalum, platinum, rhodium, iridium, and gold. However, metals such as aluminum, iron, and chromium dissolve rapidly in nitric acid but become passive when exposed to concentrated nitric acid, which forms an oxide coating on the surface of the metal [15,20].
2.8. Occupational health and safety data sheet
For occupational health and safety purposes, ammonia, nitric oxide, NO2, and nitric acid are substances that must be carefully handled in a nitric acid factory [21]. Nitric acid is highly corrosive to all areas of the body, and can irritate the skin, cause blisters, and lead to necrosis when contacted. NO2 is the most damaging form of nitrogen oxide. Table 2 and Table 3 lists the permissible exposure limits for the components related to nitric acid manufacturing and storage [22].
Table 2.
Occupational hazard restrictions for components used in the production of nitric acid [23].
| TLV-STEL for 15min | TLV-TWA for 8hr | Components |
|---|---|---|
| 35 | 25 | Ammonia |
| 35 | 25 | Nitrogen Monoxide |
| 5 | 3 | Nitrogen Dioxide |
| 4 | 2 | Nitric Acid |
Table 3.
Safety data sheet for nitric acid [24].
| Exposure Limits | |
| OSHA PEL: 2 ppm | |
| ACGIH TLV: 2 ppm | |
| STEL: 4 ppm | |
| Hazardous Characteristics | |
| Overall Toxicity | High |
| Flammability | None/very low |
| Destructive to skin and eyes | Severe |
| Absorbed by skin | None/very low |
| Sensitizer | No |
| Self-reactive | No |
| Incompatible with |
Flammables, combustibles, other reducing agents; bases; most metals; many organic compounds; rubber; wood |
|
Typical Symptoms of Acute Exposure | |
| If inhaled | Coughing, sore throat, lung edema. |
| When ingested | Sore throat, abdominal pain |
| On the skin | Pain, yellow necrotic patches, severe burns |
| In the eyes | Pain, blurred vision, blindness |
| Principal target system(s) |
Respiratory system, skin, eyes |
|
Storage Requirements | |
| Store separately, in a cold, dry, well-ventilated environment away from other oxidizing agents, flammables, combustibles, and other reducing agents such as acetic acids and other organic acids. | |
| Caution: Even 1 M acid is destructive | |
2.9. Detection techniques
Several biosensors have been developed for rapid detection of inducible nitric oxide synthase (iNOS). The first was a metal-enhanced electrochemical detection (MED) tool that exploits the redox properties of a silver monolayer. The sensor exhibited a linear detection range of 8.64 × 10⁻² ng/ml to 5.40 × 101 ng/ml and a detection limit of 1.69 × 10⁻⁴ ng/ml. This approach compares with surface plasmon resonance (SPR) biosensor techniques, where an iNOS antigen is covalently immobilized to a gold surface using polyclonal mouse anti-iNOS. This SPR approach has a linear detection range of 37 × 101 ng/ml to 5.40 × 10⁻² ng/ml and a detection limit of 2 × 10⁻³ ng/ml. A portable capillary fluorescence immunosensor (UPAC) was also designed. The secondary antibody in this system was a rabbit anti-iNOS antibody. This method produced signals that correlated to an iNOS concentration of 1.52 × 10⁻¹ ng/ml to 1.52 × 10⁻² ng/ml with a detection limit of 1.05 × 10⁻³ ng/ml. The developed immunosensors exhibited a low cross-reactivity to interferents such as ovalbumin and albumin. Simulated blood containing recombinant iNOS was used to test the detection efficacy, which revealed recovery rates of 88.50 % for the UPAC biosensor and 85 % for the SPR-like biosensor [25].
2.10. Repolymerization of neutralized extract
The neutralized extract (NE) was subjected to solvent removal and preheated at 80 °C for about 1 h. The NE was then blended with weighted BPF epoxy resin at 115 °C. PA was added to the mixture as the curing agent. The obtained mixture was degassed, and the solvent was removed using a vacuum oven. The temperature was maintained at 115 °C during these processes. The final mixture was cast onto a 2 mm-thick plate and cured for 8 h at 115 °C. The post-curing step was then performed at 130 °C for 10 h, producing recycled resin. A virgin resin was also created using PA and BPF as curing agents and subjected to similar curing conditions for an accurate comparative analysis [26].
3. Materials and methods
3.1. Material balance
In nitric acid reactions, water reacts with dissolved dinitrogen tetroxide to produce nitric and nitrous acids [27]:
| (1) |
Nitrous acid then dissociates into nitric acid, water, and nitrogen monoxide, which is transported to the bulk gas through the interface:
| (2) |
Scientists have been studying the mobility of nitrogen oxides in water and in diluted and concentrated nitric acid for over 50 years [28]. Several procedures have been proposed that depend on gas composition and acid content, but the findings are only partially consistent with the absorption model shown in Ref. [29].
The rate-limiting step in the NOx absorption zone, which is essential for acid formation, is assumed to involve the transport of dinitrogen tetroxide. The NO2/N2O4 equilibrium controls the amount of dinitrogen tetroxide transported from the main gas to the interface, where it can be calculated using Equation (3) below:
| (3) |
where J is the absorption rate (kmol/M2s), Kg is the gas-side mass-transfer coefficient (m/s), po is the bulk gas differential pressure (atm), and pi is the interface differential pressure.
In a rapid first-order reaction, dinitrogen tetroxide crosses the barrier and mixes with nitric and nitrous acids at higher NO2/N2O4 levels in the reaction gas (Equation (1)). Nitrogen monoxide released by nitrous acid dissociation (Equation (2)) is taken back into the gas space. The absorption rate of dinitrogen tetroxide can be calculated using Equation (4) below:
| (4) |
where H is the Henry coefficient (m³·atm/kmol), k is the rate constant (1/s), and D is the diffusion constant (m2/s). This mechanism is supported by numerous laboratory absorber measurements. A first-order reaction means that the rate of the reaction is proportional to the concentration of the reactant. This is a reasonable assumption for the absorption of dinitrogen tetroxide in nitric acid because the rate of absorption is likely to depend on the concentration of dinitrogen tetroxide in the gas phase. Some experimental data support the assumption of a first-order reaction. For example, a study by Ref. [29] found that the absorption rate of dinitrogen tetroxide in nitric acid increased linearly with the concentration of dinitrogen tetroxide in the gas phase. The following mass-transfer coefficient correlations (using Equations (5), (6))) have been derived from measurements in absorption columns.
For bubble-cap trays:
| (5) |
Here, H is the Henry coefficient (m3 kPa/kmol), T is the temperature (K), and W is the mass fraction.
For sieve trays when :
| (6) |
For sieve trays when :
NO2/N2O4 absorption with concentrated nitric acid can be considered natural physical absorption. In addition, low gas-phase NO2/N2O4 concentrations cause deviations from the reported chemisorption.
3.1.1. The Birkeland-Eyde (B-E) process
The Birkeland-Eyde (B-E) process, the first commercialized nitrogen fixation method, was powered by hydropower from Niagara Falls in Canada. The supplied power increased from 2.24 kW in 1903 to 236.60 MW in 1928, supporting large-scale production of nitrogen. The plant could fix approximately 38 kilotons of nitrogen (kt-N) annually. The system required approximately 175 tons of air to fix one ton of nitrogen, with an energy consumption of 2.40–3.10 MJ per mole of nitrogen. Nitric oxide (NO) production was conversely 1–2 mol%. The fixation process was rudimentary, with NO produced by directing air over an electric arc between two water-cooled electrodes in a furnace. A powerful electromagnet was also installed between the two electrodes. Diluted NO was rapidly cooled at the reactor outlet to 800–1000 °C to prevent the reverse reaction (NO to oxygen and nitrogen) from occurring [30]. Heat generation and NO emissions were critical concerns in the early B-E process. Waste heat boilers were used to recover the heat generated by the reactions. As the temperature decreased, the absorption capacity increased, which led to performance concerns. Therefore, the NO and NO2 mixture left the economizer at about 200 °C and was directed to cooling towers, where the temperature was reduced to 50 °C before flowing to the absorption towers [31]. Ultimately, the NO2 gas produced dissolved in water to form nitric acid (HNO3). The steam from the B-E process contained about 30 % HNO3. Despite dedicated NO2 absorption, some NOx remained unabsorbed. These gas species were directed to alkaline absorption columns for further absorption, but this was ineffective. Therefore, approximately 3 % of the generated NOx was released into the atmosphere. Fig. 2 illustrates the conventional B-E process.
Fig. 2.

The conventional B-E process [32].
3.1.2. Process flow sheet diagram of the proposed case
Material balancing is one of the most important aspects of the chemical process design process. The type of raw materials used affects the quality of both the raw materials and the goods produced. The compositions and fluxes of the process streams, as well as the sizes of the various pieces of equipment used in the process, are determined by the balances of specific process units.
In a steady-state process, there is no accumulating phase. However, if a chemical reaction occurs, specific chemical species may be created or destroyed in the process. The material balance equation for a steady-state process with a chemical reaction is Generation + Input = Consumption = Output. If there is no chemical reaction, the steady-state balance is simply Output = Input. This concept is visually represented in Fig. 3, which illustrates the process flow diagram of the proposed case.
Fig. 3.

Process flow sheet diagram of the proposed case.
The split fraction method is based on the idea that the primary purpose of many chemical processing units is to separate the input flow of a component into two or more exit streams, as illustrated in Table 4. This method is suitable for balanced elements in inter-facilities with complex structures [23].
Table 4.
Process flow parameters diagram of the proposed case.
| Stream Points STREAM NO |
1 | 2 | 3 | 4 | 5 | 6 | 7 | 8 | 9 | 10 | 11 | 12 | 13 | 14 |
|---|---|---|---|---|---|---|---|---|---|---|---|---|---|---|
| Mole Flow Rate (kmol/hr) | 1514.09 | 137.40 | 1514.09 | 137.40 | 137.40 | 137.40 | 1651.50 | 1685.85 | 1685.85 | 1623.19 | 1623.19 | 1304.16 | 402.78 | 167.08 |
| Stream Temperature (°C) | 25 | −15 | 262 | −15 | 35 | 177 | 250 | 645 | 70 | 140 | 60 | 30 | 30 | 20 |
| Mass Flow Rate (kg/hr) | 43537.50 | 2335.89 | 43537.52 | 2335.50 | 2335.89 | 2335.89 | 45873.40 | 45873.40 | 45873.40 | 45873.40 | 4873.40 | 36380.89 | 12500 | 3007.51 |
| Stream Pressure (kPa) | 101.33 | 500 | 1090 | 1240 | 1240 | 1240 | 1060 | 1060 | 1060 | 1060 | 1200 | 1100 | 1200 | 101.33 |
| Mole Fraction | ||||||||||||||
| H2O | – | – | – | – | – | – | – | 0.12 | 0.12 | 0.13 | 0.13 | 0.03 | 0.70 | 1.00 |
| N2 | 0.81 | – | – | – | – | – | 0.74 | 0.73 | 0.73 | 0.76 | 0.76 | 0.94 | – | – |
| NO2 | – | – | – | – | – | – | – | – | – | 0.08 | 0.08 | 0.005 | – | – |
| O2 | 0.19 | – | 0.81 | – | – | – | 0.17 | 0.07 | 0.07 | 0.03 | 0.03 | 0.02 | – | – |
| NO | – | – | – | – | – | – | – | 0.08 | 0.08 | 0.003 | 0.003 | 0.004 | – | – |
| NH3 | – | 1.00 | 0.19 | 1.00 | 1.00 | 1.00 | 0.08 | – | – | – | – | – | – | – |
| HNO3 | – | – | – | – | – | – | – | – | – | – | – | – | 0.30 | – |
3.1.3. Assumptions for material balance
-
a)
The system is in a steady state, which means that there is no accumulation of any kind.
-
b)
The quantity of inert air in the process air is minimal.
-
c)
The reactors have a high conversion rate.
-
d)
Side effects have a minor impact.
3.2. Overall mass balance
In this section, the authors examine the overall mass balance of the proposed process. To complement this analysis, Table 5 and Table 6 provide detailed quantitative data that further elucidate the material flows at different stages of production. Fig. 4 provides a visual representation of the key principles that will be explored in this analysis. This figure illustrates the flow of materials throughout the process, aiding in the understanding of how mass is conserved at different stages of production. Additionally, Equation (7) serves as a fundamental component in this analysis, influencing the overall mass balance calculations.
| 2O2 + NH3 →H2O + HNO3 | (7) |
Table 5.
Overall material balance calculations.
| Nitric Acid | Ammonia | Nitrogen |
|---|---|---|
| Fout = 119.05 kmol/h | Fout = 18.35 kmol/h | Fout = 1228.38 kmol/h |
| Oxygen | Water | |
|
Fin = 238.10 kmol/h Excess 20 % leads to: Fin = 285.72 kmol/h, Fout = 47.62 kmol/h |
Fin = 167.08 kmol/h |
Table 6.
Overall material balance summary.
| Material | Input-S1 (kg/hr) | Input-S14 (kg/hr) | Input-S2 (kg/hr) | Output-S13 (kg/hr) | Output-S12 (kg/hr) |
|---|---|---|---|---|---|
| NO | – | – | – | – | 156.70 |
| NH3 | – | – | 2335.88 | – | – |
| O2 | 9142.88 | – | – | – | 799.19 |
| NO2 | – | – | – | – | 288.20 |
| H2O | – | 3007.51 | – | 5000.00 | 646.00 |
| HNO3 | – | – | – | 7500.00 | – |
| N2 | 34394.64 | – | – | – | 34490.82 |
| Overall | 48880.91 | 48880.91 | |||
Fig. 4.
Material balance across process flow diagram.
Conversion rate: 95 %
3.2.1. Mass balance across the reactor
In this section, the authors will delve into the specific details of material balance within the reactor. Fig. 5 serves as a visual aid to illustrate these key principles. This figure provides a clear representation of how mass is conserved within the reactor, a critical aspect of the analysis. Additionally, for more detailed quantitative insights, Table 7 and Table 8 provide comprehensive data related to the mass balance analysis, while Equation (8) (with a conversion rate of 95 %) and Equation (9) (with a conversion rate of 5 %) further contribute to understand the underlying processes.
| 5O2 + 4NH3 →6H2O + 4NO | (8) |
Fig. 5.

Material balance across reactor.
Table 7.
Mass balance calculations across the reactor.
| Ammonia | Nitrogen | Nitrogen Oxide |
|---|---|---|
| Fout ∼0 | Fout = 1231.83 kmol/h | Fout = 130.54 kmol/h |
| Oxygen | Water | |
| Fout = 117.39 kmol/h | Fout = 206.11 kmol/h |
Table 8.
Summary of mass balance calculations across the reactor.
| Material | Output-S8 (kg/hr) | Input-S7 (kg/hr) |
|---|---|---|
| Oxygen | 3756.58 | 9142.88 |
| Ammonia | – | 2335.88 |
| Nitrogen Oxide | 3916.05 | – |
| Water | 3709.93 | – |
| Nitrogen | 34490.82 | 34394.64 |
| Overall | 45873.40 | 45873.40 |
Conversion rate: 95 %
| E1 = 137.41 × 0.95 = 130.54 kmol/h |
| 3O2 + 4NH3 →6H2O +2N2 | (9) |
Conversion rate: 5 %
| E2 = 137.41 × 0.05 = 6.87 kmol/h |
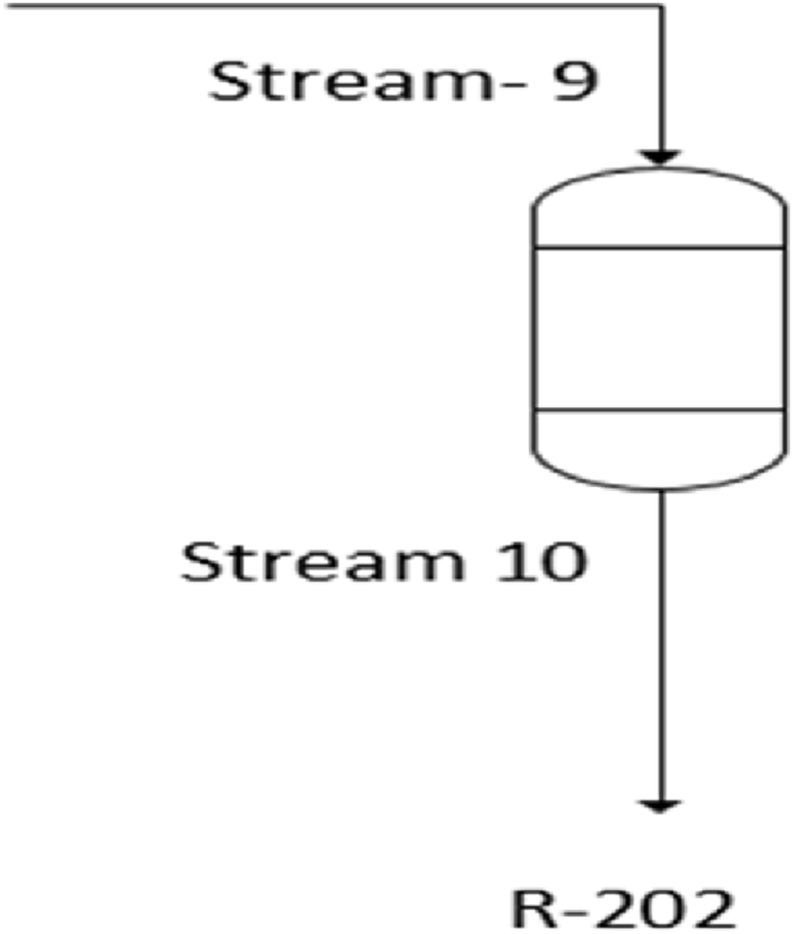
3.2.2. Mass balance during the oxidation process
In this section, the authors will explore the specific details of material balance during the oxidation process. Fig. 6 serves as a visual representation of these crucial principles. This figure aids the authors in understanding how mass is conserved throughout the oxidation process, which is a fundamental aspect of the analysis. Additionally, the relevant data and calculations for mass balance during the oxidation process can be found in Table 9 and Table 10. For the specific conversion rate of 96 %, Equation (10) provides valuable insights.
| O2 + 2NO →2NO2 | (10) |
Fig. 6.
Material balance across oxidation process.
Table 9.
Mass balance calculations during the oxidation process.
| Nitrogen Dioxide | Nitrogen |
|---|---|
|
Fout = 125.31 kmol/h |
Fout = 1231.82 kmol/h |
| Oxygen | Water |
| Fout = 54.74 kmol/h | Fout = 206.11 kmol/h |
| Nitrogen Oxide | |
| Fout = 5.22 kmol/h |
Table 10.
Summary of mass balance calculations during the oxidation process.
| Material | Output-S10 (kg/hr) | Input-S9 (kg/hr) |
|---|---|---|
| Water | 3709.93 | 3709.93 |
| Oxygen | 1751.55 | 3756.57 |
| Nitrogen Dioxide | 5764.39 | – |
| Nitrogen | 34490.82 | 34490.82 |
| Nitrogen Oxide | 156.70 | 3916.05 |
| Overall | 45873.40 | 45873.40 |
Conversion rate: 96 %
| E = 130.54 × 0.96 = 125.31 kmol/h |
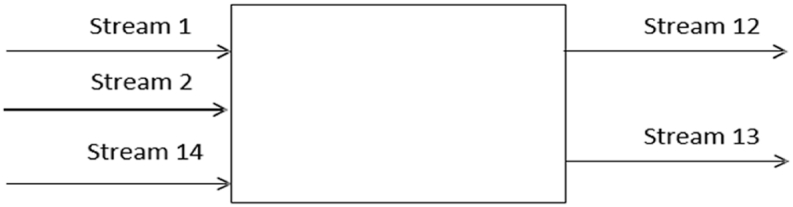
3.2.3. Mass balance across the absorber
In this section, the authors will focus on how mass is managed in the absorber, as detailed in Table 11. Additionally, Equation (11), which accounts for a Conversion rate of 95 %, plays a significant role in the mass balance analysis. Fig. 7 shows a visual representation of these important concepts. This figure helps the authors understand how mass is kept in check within the absorber, which is a crucial part of the analysis, as summarized in Table 12.
| H2O + 2NO2 + ½ O2→2HNO3 | (11) |
Table 11.
Mass balance calculations across the absorber.
| Nitrogen Dioxide | Nitrogen | Nitric Acid |
|---|---|---|
|
Fout = 6.27 kmol/h |
Fout = 1231.82 kmol/h |
Fout = 119.05 kmol/h |
| Oxygen | Water | Nitrogen Oxide |
| Fout = 24.97 kmol/h | Fout = 313.67 kmol/h | Fout = 5.22 kmol/h |
Fig. 7.

Material balance across the absorber.
Table 12.
Summary of mass balance calculations across the absorber.
| Material | Input-S14 (kg/hr) | Input-S11 (kg/hr) | Output-S13 (kg/hr) | Output-S12 (kg/hr) |
|---|---|---|---|---|
| Nitrogen | – | 34490.82 | – | 34490.82 |
| Water | 3007.51 | 3709.93 | 5000.00 | 646.00 |
| Nitrogen Dioxide | – | 5764.40 | – | 288.20 |
| Nitrogen Oxide | – | 156.70 | – | 156.70 |
| Oxygen | – | 1751.55 | – | 799.19 |
| Nitric Acid | – | – | 7500.00 | – |
| Overall | 48880.91 | 48880.91 | ||
Conversion rate = 95 %
| E = 125.31 × 0.95 = 119.05 kmol/h |
4. Heat transfer analysis
In this section, the authors embark on a comprehensive examination of heat transfer phenomena within the system. To facilitate this multifaceted analysis, several crucial factors must be determined for both the shell side and tube side. As a pivotal starting point, the authors first delve into the calculation of the Logarithmic Mean Temperature Difference (LMTD), recognizing its fundamental role in subsequent analyses. Subsequently, the authors proceed to ascertain the provisional area (diameter) for the tube and shell sides, a critical step in the design process. Following this, the authors focus on determining the Heat Transfer Coefficient for both the tube side and shell side, shedding light on the efficiency of the heat transfer process. Lastly, in this comprehensive analysis, attention turns to the calculation of pressure drop for both the shell and tube sides, offering invaluable insights into system dynamics. Through this systematic approach, the authors pave the way for a profound understanding of heat transfer within the examined system.
4.1. Logarithmic Mean Temperature Difference (LMTD)
In the pursuit of a thorough analysis of the Logarithmic Mean Temperature Difference (LMTD), the authors turn their attention to a series of critical equations. Equations (12)–(14) below serve as the primary tools in the examination of LMTD, providing the necessary framework for understanding the temperature difference across the heat exchanger.
| (12) |
The proposed design uses one shell pass with two tube passes. Therefore,
| R = (T1 – T2)/(t2 – t1) = 0.39 and S = (t2 – t1)/(T1 – t2) = 0.33 | (13) |
The temperature correction factor is Ft = 0.99,
| (14) |
4.1.1. Decomposition experiments
The decomposition process involved using MDA (BFF/MDA) in a 100:22 wt ratio to cure the epoxy resin. Curing occurred for 2 h at 80 °C, followed by a 3-h post-cure at 150 °C. The BFF/MDA resin was poured into a 2 mm-thick plate and cut into 25 mm × 60 mm pieces for this process. Each cut specimen was placed in a 30 mm glass tube and immersed in a 4 M nitric acid solution with a volume of 70 ml. A water bath was used to maintain a temperature of 80 °C during the immersion process [33].
4.1.2. Extract neutralization process
The extract neutralization process is a method used to remove nitric acid from an extract and produce a neutral product. The extract was dissolved in ethyl acetate to neutralize the HNO3. Sodium carbonate was added to the original solution while stirring. The ethyl acetate phase was separated at pH 7, and the remaining solvent evaporated. The final product was dried at room temperature for 24 h. However, some water remained dissolved in the ethyl acetate due to its physical and chemical properties. Thus, the product was neutral with some sodium nitrate traces [34]. The product was then dissolved in ethyl acetate for a second time to remove any inorganic compounds. The organic solution was filtered, dissolved, and the resultant product was dried in a vacuum at room temperature to create an NE.
4.2. Provisional area
Equations (15), (16), (17) below are instrumental in determining both the Tube bundle diameter and Shell inside diameter. These values are crucial as they will play a significant role in the forthcoming pressure drop calculations.
| (15) |
| (16) |
Clearance = 62 mm
| (17) |
4.3. Tube Side Heat Transfer Coefficient (Ammonia) [35]
Equation (18) below is a key component in the calculation of the Tube Side Heat Transfer Coefficient. This coefficient is a pivotal factor in the authors' quest to determine the Overall Heat Transfer Coefficient, considering contributions from both the shell side and tube side.
| (18) |
4.4. Shell Side Heat Transfer Coefficient (Steam) [29]
Equation (19) below is a key component in the calculation of the Shell Side Heat Transfer Coefficient. This coefficient is a pivotal factor in the authors' quest to determine the Overall Heat Transfer Coefficient, considering contributions from both the shell side and tube side.
| (19) |
4.5. Overall Heat Transfer Coefficient [29]
Equations (18), (19)) are instrumental in determining the Tube Side Heat Transfer Coefficient and Shell Side Heat Transfer Coefficient, respectively. These coefficients are key components in the calculation of the Overall Heat Transfer Coefficient, as facilitated by Equation (20) below:
| (20) |
4.6. Tube Side Pressure Drop
The calculation of Tube Side Pressure Drop is facilitated by Equation (21), as illustrated below:
| (21) |
4.7. Shell side pressure drop
The calculation of Tube Side Pressure Drop is facilitated by Equation (22), as illustrated below:
| (22) |
4.7.1. Heat exchanger
A heat exchanger is used to transfer heat between two or more fluids. It can be used to cool or heat the fluids as needed. The fluids are separated by a solid wall to prevent them from mixing. A common example of a heat exchanger is an internal combustion engine, in which circulating fluid (engine coolant) flows through the radiator coils and air flows over the coils. The coolant cools the air flowing over the coils.
4.7.2. Shell and tube heat exchanger
Shell and tube heat exchangers are types of heat exchanger that is widely used in industry. They are known for their high efficiency and low pressure drop. Pressure drop is the main reason for choosing a shell and tube heat exchanger. Pressure drop in a shell and tube heat exchanger is less than 10psia, and the device is relatively easy to clean compared to other heat exchangers. This makes it a popular choice around the world.
4.7.3. Ammonia mixture on the shell side and saturated steam on the tube side
In a heat exchanger, fluids are typically placed on either the shell side or the tube side. The shell side is typically used for fluids with lower temperatures and pressures, while the tube side is typically used for fluids with higher temperatures and pressures. High-temperature, high-pressure, and corrosive fluids should be placed in the tube side, because saturated steam is at higher temperatures and is more corrosive. If corrosive fluid is placed on the shell side, it can damage both the shell and tube side. Therefore, it is better to place corrosive fluids on the tube side. It is important to consider the temperature, pressure, and corrosiveness of the fluids when designing a heat exchanger.
5. Design calculations
This section presents the design calculations for a nitric acid plant with a production capacity of 1000 MTPD of concentrated nitric acid (98 %). The calculations are based on the experimental and numerical analysis presented in the previous sections. The design calculations are divided into the following subsections:
-
•
Selection of Operating Conditions: This subsection discusses the selection of operating conditions for the nitric acid plant, including the pressure, temperature, and flow rates of the various streams.
-
•
Model Design Results: This subsection presents the results of the numerical model used to design the nitric acid plant. The model includes the reactor, absorber, and distillation column.
-
•
Absorber Design: This subsection presents the design calculations for the absorber, which is used to absorb nitric oxide and nitrogen dioxide from the gas stream.
-
•
Calculation of Column Diameter: This subsection presents the calculation of the column diameter for the distillation column.
-
•
Calculation of ΔTW: This subsection presents the calculation of the temperature difference between the gas and liquid streams in the distillation column.
To validate the rationality of the design and the reliability of the calculation results, the design calculations have been added to Appendix A (Design Model Calculations) and Appendix B (Calculation of Column Diameter).
5.1. Selection of operating conditions
In this section, the authors delve into the critical aspect of determining the most suitable parameters for the operation of the system. This involves a comprehensive analysis of how nitric oxide production responds to variations in pressure and temperature. These insights are presented in Table 13 which sheds light on the intricate relationship between these factors. Furthermore, to ensure the efficient operation of the process, Equation (23) were introduced, which provides a method for calculating the ‘Number of Gauzes Needed’ to estimate the pressure drop across the bed, a crucial factor in optimizing our system's performance.
Table 13.
| (23) |
| Pressure (Bar) | NO Yield (%) | Temperature (°C) |
|---|---|---|
| Below 1.7 | 97 | 810–850 |
| 1.7–6.5 | 96 | 850–900 |
| Above 6.5 | 95 | 900–940 |
5.2. Model Design Results
In this section, the calculation and the results were proposed for the chosen model (Appendix A depicts the detailed calculation of the design results [36]). As part of the comprehensive analysis of the design, the authors considered all the necessary factors to determine the Pressure Drop Across Bed. In addition, to provide a concise overview of the critical findings, Table 14 offers a summary of the model results, which will aid in understanding the pressure drop characteristics and their implications within the absorber system.
Table 14.
Model results summary.
| No. | Model Design Parts | Values |
|---|---|---|
| 1 | Mesh Size | nw = 80 1/in |
| 2 | Wire Diameter | dw = 0.003 in |
| 3 | Amount of Surface Area to Total Volume Awr = π nw2[(1/nw)2 + dw2]0.5 |
Awr = 258.50 1/in |
| 4 | Gauze Cross-Sectional Area Divided by Wire Area fw = Awr × 2dw | fw = 1.55 |
| 5 | Porosity Ɛw = 1 – |
Ɛw = 0.81 |
| 6 | Cross-Sectional Area of Catalyst Needed | 27.55 ft2 ∼ 2.56 m2 |
| 7 | Diameter of Catalyst Bed Needed | 5.92 ft ∼ 1.81 m |
| 8 | Mass Velocity | G = 1.41 g/cm2 sec |
| 9 | Density of Feed ρmix = |
ρmix = 1.41 × 10⁻³ g/cm3 |
| 10 | Superficial Velocity Us = G/ρmix |
Us = 32.80 ft/s |
| 11 | Viscosity of Mixture | μf = 4.65 × 10⁻⁴ g/cm·sec |
| 12 | Number of Gauzes Needed ns= | ns = 14.75–15 |
| 13 | Height of Catalyst Bed hc = 2 dw ns | hc = 0.23 cm |
| 14 | Weight of Catalyst Needed | 84.20 kg |
| 15 | Volume of catalyst Vc = π D2hc |
Vc = 0.006 m3 |
| 16 | Dimensions of Reactor Vr = 1/4π Dr2Lr |
Vr = 10.77 m3 |
| 17 | Pressure Drop Across Bed = + |
ΔP = 170 Pa |
5.3. Absorber Design
5.3.1. Theoretical number of trays
The equilibrium relation is important for predicting the concentration of nitrogen oxide in water under different conditions. The solubility data for nitrogen oxide in water is used to derive the equilibrium relation for the dissolution of nitrogen oxide in water.
| (24) |
The equilibrium line and operating line are two important concepts in absorption. The equilibrium line represents the relationship between the concentrations of the solute in the gas and liquid phases at equilibrium. The operating line represents the relationship between the concentrations of the solute in the gas and liquid phases at a given operating condition. Using the data in Table 15, the equilibrium line can be calculated. After applying the material balance to the absorber, then the operating line can be obtained. Equation (25) shows the formula for the operating line, as indicating as follow:
| (25) |
Table 15.
Solubility data for nitrogen oxide in water.
| Ye = | 0.62 | 0.55 | 0.48 | 0.42 | 0.36 | 0.30 | 0.26 | 0.21 | 0.17 | 0.13 | 0.09 | 0.07 | 0.03 |
|---|---|---|---|---|---|---|---|---|---|---|---|---|---|
| X = | 0.35 | 0.32 | 0.28 | 0.25 | 0.22 | 0.19 | 0.16 | 0.13 | 0.11 | 0.09 | 0.07 | 0.05 | 0.02 |
where Y1, X1, L, and G are the components of the material balance equation, as shown in Equation (25). This is because X1 is not present in the solvent when the outset is zero. Thus, the operating line equation becomes:
| (26) |
Using Equations (24), (26), the equilibrium line and the operating line on the X- and Y-axes, respectively, can be sketched. This was established using the Thiele–McCabe method to calculate the number of phases. The operating line equation can be used to predict the concentration of the solute in the liquid phase at any point in the absorber. To facilitate this prediction, the authors rely on the solubility data for NOx in water, which is presented in Table 16. This information can be used to design and operate the absorber efficiently.
Table 16.
Solubility data for NOx in water.
| Y = | 0.75 | 0.67 | 0.60 | 0.53 | 0.47 | 0.41 | 0.35 | 0.29 | 0.24 | 0.19 | 0.14 | 0.09 | 0.04 | 0.001 |
|---|---|---|---|---|---|---|---|---|---|---|---|---|---|---|
| X = | 0.0003 | 0.02 | 0.04 | 0.06 | 0.09 | 0.11 | 0.14 | 0.16 | 0.19 | 0.22 | 0.25 | 0.28 | 0.32 | 0.35 |
5.3.2. Actual number of trays
To calculate the column's efficiency, Equation (27) is applied, which combines Drichmer and Bradform as shown below:
| (27) |
Number of theoretical trays = NT = 14 and E = 0.5.
Therefore, NA = 14/0.5 = 28.
5.4. Calculation of Column Diameter
In this section, the authors embark on the critical task of determining the appropriate column diameter, a vital factor in the design and operation of the absorber system. The approach encompasses a comprehensive evaluation of all the necessary criteria to establish an optimal column diameter. For a detailed insight into the calculations, the comprehensive breakdown in Appendix B offers an in-depth examination of the column diameter calculations [37]. To provide a concise overview of the key findings, Table 17 summarizes the results, facilitating a clear understanding of the considerations that drive the column diameter determination process.
Table 17.
Summary of column diameter results.
| No. | Column Diameter Results | Value |
|---|---|---|
| 1 | Extremely High Speeds During Floods UAF = |
UAF = |
| 2 | Net Area An = |
An = The area of the comer is calculated as 12 % of the overall cross-sectional area of the column |
| 3 | Cross-sectional Area |
|
| 4 | Column Diameter |
|
| 5 | Height of Column Ht = (NA − 1) s + ΔH |
Ht = 12.85 m |
| 6 | Tray Hydraulics Downcomer area = AN = 0.12 × Ac |
AN = 0.24 m2 |
| 7 | Tray Net Area Net area = An = Ac – Ad |
An = 1.76 m2 |
| 8 | Tray Active Area Active area = Aa = Ac – 2Ad |
Aa = 1.52 m2 |
| 9 | Total Hole Area Hole area = Ah = 0. 1 × Aa |
Aℎ = 0.15 m2 |
| 10 | Weir Height | ℎw = 0.50 m |
| 11 | Weir Length lw = 0.77 × Dc |
lw = 1.23 m |
| 12 | Weeping Check Fr = |
Fr = 0.51 > 0.50 Therefore, there will be no weeping. |
| 13 | Number of Holes per Tray Number of holes = |
277 |
| 14 | Tray Pressure Drop HT = Hd + (Hw + How) + Hr where, Hd = 51 Hr = 12.53 × 10³/ρl |
HT = 184.17 mm |
5.5. Calculation of ΔTW
In this section, the authors delve into the critical calculations involved in determining ΔTW, a fundamental parameter in the analysis of heat transfer processes. The section is divided into three subsections, each addressing a distinct aspect of this calculation.
5.5.1. Calculation of Logarithmic Mean Temperature Difference [38]
In this subsection, the authors focus on the Calculation of Logarithmic Mean Temperature Difference, a vital component in the analysis of heat transfer. To facilitate this calculation, the authors rely on Equation (28), specifically designed for determining the Logarithmic Mean Temperature Difference for preheating. Table 18 provides essential LMTD values for preheat processes.
Table 18.
| (28) |
| Tin | Tout | tin | tout | LMTD |
|---|---|---|---|---|
| 212 °F | 212 °F | 14 °F | 39.20 °F | 185.11 °F |
LMTD for preheat = 185.11 °F.
5.5.2. Logarithmic Mean Temperature Difference for Vaporization
This subsection explores the intricacies of Logarithmic Mean Temperature Difference for Vaporization, an essential parameter for understanding heat transfer in this context. To assist in this calculation, Table 19 offers valuable LMTD values for vaporization processes.
Table 19.
LMTD values for vaporization.
| T(in) | T(out) | t(in) | t(out) | LMTD |
|---|---|---|---|---|
| 212 °F | 212 °F | 39.20 °F | 39.20 °F | 172.80 °F |
LMTD for vaporization = 172.80 °F.
Heat released by water: Q = 14932462 Btu/hr.
Heat absorbed by ammonia: Q = 14932462 Btu/hr.
5.5.3. Average temperature or caloric temperature (Cp)
In this subsection, the authors delve into the determination of Average Temperature or Caloric Temperature (Cp), which plays a crucial role in this analysis. For a comprehensive understanding of this parameter, Table 20 provides data on the average temperature of various fluids. Therefore, the caloric temperature calculations were conducted as follows:
Table 20.
Average temperature of different fluids.
| Hot Fluid Range (°F) | 0 | less than 100 °F |
|---|---|---|
| Cold Fluid Range (°F) | 25.50 | less than 100 °F |
| Hot Terminal Approach (°F) | 172.50 | greater than 50 °F |
| Cold Terminal Approach (°F) | 198 | greater than 50 °F |
| Viscosity of Hot Fluid | 0.27 Cp | less than 1 Cp |
| Viscosity of Cold Fluid | 0.15 Cp | less than 1 Cp |
As the four properties are satisfied, thus the average temperature can be used.
Viscosities at cold terminal >1 Cp;
Range >100;
Approaches >100.
To evaluate the fluids’ properties, the caloric temperatures must be established for both fluids:
Kc = 0.6, Fc = 0.45.
6. Cost analysis
This section presents a cost analysis of the proposed nitric acid production plant, which was designed in Section 5. The cost analysis is divided into three subsections:
-
•
Sub-Section 6.1: Fixed capital investment (FCI): This subsection estimates the initial capital cost of the plant, which includes the cost of equipment, buildings, and infrastructure.
-
•
Sub-Section 6.2: Total capital cost (TCC): This subsection estimates the total cost of the plant, which includes the FCI as well as the cost of working capital and contingency.
-
•
Sub-Section 6.3: Estimation of total capital costs (for plant): This subsection provides a detailed breakdown of the TCI for the plant.
The cost analysis is based on a number of assumptions, including the following:
-
•
The plant will be in Ras-Alkhair, Saudi Arabia.
-
•
The plant will have a production capacity of 1000 MTPD of concentrated nitric acid (98 %).
-
•
The plant will use a single-pressure process.
The cost analysis is intended to provide a preliminary estimate of the cost of the proposed nitric acid production plant. The actual cost of the plant may vary depending on a number of factors, such as the specific equipment used, the cost of labor and materials, and the exchange rate. The cost analysis is an important part of the overall project evaluation. It can be used to assess the economic feasibility of the project and to make informed decisions about the design and construction of the plant.
6.1. Total Capital Investment [39]
In this section, the authors undertake the calculation of the total capital investment (TCI). To derive the TCI, the authors first determine the fixed capital investment (FCI) utilizing Equation (29). Subsequently, they compute the working capital (WC) as per the guidelines provided in Equation (30). The final step in this process involves employing Equation (31) to ascertain the TCI.
| (29) |
FCI = $1867705
| (30) |
| (31) |
Therefore, from Equations (30), (31)), the working capital and total capital investment can be calculated as below:
WC = $36989338.02 and TCI = $5548400.70.
6.2. Total capital costs
To calculate the total capital costs (TCC), Equation (32) is obtained as follows, with a contingency of 7 %:
| (32) |
6.3. Estimation of fixed capital costs
In this section, the authors delve into the detailed calculations of the plant's fixed costs. Table 21 provides a comprehensive breakdown of these costs.
Table 21.
Fixed costs of plant.
| Fixed Costs | ||
|---|---|---|
| Item | Cost | Charges |
| Maintenance Cost | $336976.15 | 5 % of fixed capital cost |
| Operating Labor | $423225 | – |
| Supervision | $84645.00 | 20 % of labor cost |
| Plant Overheads | $211612.50 | 50 % of labor cost |
| Laboratory | $84645.00 | 20 % of labor cost |
| Capital Charges | $336976.14 | 10 % of fixed capital cost |
| Insurance | $33697.61 | 1 % of fixed capital cost |
| Local Taxes | $67395.23 | 2 % of fixed capital cost |
| Royalties | $33697.62 | 1 % of fixed capital cost |
| Total Fixed Costs | $1612870.25 | |
Notably, the table above concludes with a significant finding: the total fixed operating costs amount to $1,612,870.25 per year.
7. Discussion
Energy and heat transport studies of nitric acid were used in this research. Multiple factors, including effective energy analysis, led to the conclusion that using a single pressure is the best way to produce nitric acid. First, ammonia was vaporized at 1000 kPa and 35 °C using process heat [40,41]. The ammonia was then superheated to 80 °C using steam. An axial compressor pushed the filtered air to a discharge pressure of about 740 kPa and a temperature of 155 °C. Three established manufacturing locations were analyzed to determine the most acceptable location for the nitric acid production plant: Ogun State (Nigeria), Gwadar Seaport (Pakistan), and Ras-Alkhair Seaport (Saudi Arabia). The site assessment showed that Ras-Alkhair is the optimal site for construction of the nitric acid plant. The most important use of nitric acid is the production of ammonium nitrate, which is used in the fertilizer and explosive industries. Global nitric acid output is consumed by these industries at a rate of about 65 %. All manufactured nitric acid will be used for the production of fertilizers [35].
The design calculations presented in Section 5 show that it is possible to produce 1000 MTPD of concentrated nitric acid (98 %) using a single pressure process. The cost analysis presented in Section 6 shows that this process is economically feasible. The proposed process is also environmentally friendly, as it produces less waste than traditional nitric acid production processes.
Overall, the results of this research show that it is possible to produce nitric acid in a sustainable and efficient manner. The proposed process can be used to meet the growing demand for nitric acid for fertilizer production, while also reducing environmental impact.
8. Conclusion
This paper presents a comprehensive plant design for the production of 1000 MTPD of concentrated nitric acid (98 %) using the Ostwald process. Several factors, including effective energy analysis, show that using a single pressure is the most efficient way to produce nitric acid.
To produce ammonia vapor, ammonia is first vaporized with process heat at 1000 kPa and 35 °C, and then it is superheated with steam to 80 °C. Compressed air is then heated to a discharge pressure of roughly 740 kPa and a temperature of 155 °C.
Three established manufacturing locations, Ogun State (Nigeria), Gwadar Seaport (Pakistan), and Ras-Alkhair Seaport (Saudi Arabia), were evaluated to determine the most acceptable location for the acid production plant. Ras-Alkhair was selected as the optimal location for installation.
Ammonium nitrate, which is used in fertilizers and explosives, accounts for about 65 % of global nitric acid production. It was determined that the nitric acid produced at the Ras-Alkhair plant would be used for fertilizers.
The process uses ammonia and air as raw materials. The air is passed over a Pt-Rd catalyst to produce azeotropic nitric acid. Azeotrope breakage is achieved by treating it with NO2, producing 80 % nitric acid. Further distillation is used to increase the concentration to 98 %.
The proposed plant design is economically feasible and environmentally friendly. It can meet the growing demand for nitric acid for fertilizer production, while also reducing environmental impact.
Data availability
No data was used for the research described in the article.
CRediT authorship contribution statement
Meshal F. Alhasan: Writing - original draft, Resources, Project administration, Formal analysis, Data curation, Conceptualization. Khaled M. Alanezi: Writing - original draft, Methodology, Data curation, Conceptualization. Sabah A.S. Alali: Writing - original draft, Supervision, Resources, Formal analysis. Meshari A. Al-Ebrahim: Writing - review & editing, Visualization, Validation, Investigation, Data curation, Conceptualization. Sara Bunian: Writing - review & editing, Visualization, Validation, Data curation. Amro A. Nour: Writing - review & editing, Visualization, Validation, Investigation.
Declaration of competing interest
The authors declare that they have no known competing financial interests or personal relationships that could have appeared to influence the work reported in this paper.
Appendix A. Design Model Calculations
Mesh size: nw = 80 in–1
Wire diameter: dw = 0.003 in.
A.1 Amount of Surface Area to Total Volume
| (A1) |
where
| (A2) |
therefore,
| (A3) |
Awr = π (80)2[(1/80)2 + 0.0032]0.5
Awr = 258.5 in−1.
A.2 Gauze Cross-Sectional Area Divided by Wire Area
fw = Awr × 2dw (A4)
fw = (258.50) × (2) × (0.003)
fw = 1.55.
A.3 Porosity
| (A5) |
A.4 Cross-Sectional Area of Catalyst Needed
Catalyst bed cross-sectional area requirements = 27.55 ft2 ∼ 2.56 m2
A.5 Diameter of Catalyst Bed Needed
Catalyst bed diameter, feet = 5.92 ft.
Catalyst bed diameter, meters = 1.81 m.
A.6 Mass Velocity
G = 1.41 g/cm2 sec.
A.7 Density of Feed
ρmix = PM/RT (A6)
M = 0.14(17) + 0.68(28) + 0.18(32)
M = 27.18.
T = 890 °C = 1163 K.
P = 5 bar
ρmix = = 1405.50 g/m3 = 1.41 × 10⁻³ g/cm.3
A.8 Superficial Velocity
Us = G/ρmix (A7)
| Us = 1.41/1.41 × 10−3 = 999.64 cm/s |
Us = 32.80 ft/s.
Thus, based on these numbers, Us = 32.80 ft/s represents a more comprehensive criterion.
A.9 Viscosity of Mixture
μf = (12.50 + (29.20 × 10⁻³ T)) × 10−5 g/cm·sec (A8)
μf = (12.50 + (29.20 × 10−3 × 1163)) × 10−5 g/cm·sec
μf = 4.65 × 10⁻⁴ g/cm·sec.
A.10 Number of Gauzes Needed
| (A9) |
ns = 14.75 ≈ 15.
A.11 Height of Catalyst Bed
hc = 2 dw ns (A10)
hc = 2 × 0.003 × 15
hc = 0.09 in
hc = 0.23 cm.
A.12 wt of Catalyst Needed
Gauze equivalent to a weight of 80 μm = 1.71 troy oz/ft2
Catalyst needed = 2 troy oz/daily ton HNO3
Mass of one gauze = 1.71 × 27.55.
Weight of one gauze = 47.11 troy oz.
Weight of 15 gauzes = 15 × 47.11.
Weight of 15 gauzes = 706.58 troy oz.
Weight of catalyst needed = 2 × 1000.
Calculated catalyst weight = 2000 troy oz.
Ratio of catalyst to gauze mass = 706.58 + 2000.
Total weight of catalyst and gauze = 2706.58 troy oz.
1 troy oz = 31.10 g.
Total weight of catalyst and gauzes = 84184.14 g.
Combined mass of catalyst and gauzes = 84.20 kg.
A.13 Volume of catalyst
| (A11) |
Vc = 0.006 m3
A.14 Dimensions of Reactor
Dc = 1.81 m.
Dr = 1.81/0.95 = 1.90 m (5 % allowance)
For shallow bed reactors, L/D = 2.
Lr = 2 × 1.90.
Lr = 3.80 m
| (A12) |
Vr = 1/4π (1.90)2(3.80)
Vr = 10.77 m3
A.15 Pressure Drop Across Bed
Ergun's equation:
| (A13) |
∅ = 1, ρmix = 1.41 kg/m3, μf = 4.65 × 10⁻⁵ kg/m·sec.
ΔP/L = 0.007 bar/cm.
ΔP = 0.007 × 0.23.
ΔP = 0.002 bar.
ΔP = 170 Pa.
Appendix B. Calculation of Column Diameter
B.1 Extremely High Speeds During Floods
Assuming that tray spacing = 600 mm,
From the graph, CSB = 0.08 m/s.
Surface tension = σ = 36.56 dyne/cm.
UNF = 1.05 m/s.
Planning for a maximum of 85 % inundation at peak flow rates,
B.2 Net Area
The area of the comer is calculated as 12 % of the overall cross-sectional area of the column.
B.3 Cross-sectional Area
B.4 Column Diameter
B.5 Height of Column
| (B1) |
Ht = (28 − 1)0.45 + 0.70.
Ht = 12.85 m.
B.6 Tray Hydraulics
The downcomer area is 12 % of the tray's cross-sectional area.
| (B2) |
AN = 0.12 × 2.
AN = 0.24 m2
B.7 Tray Net Area
| (B3) |
An = 2 − 0.24.
An = 1.76m2
B.8 Tray Active Area
| (B4) |
Aa = 2 − (2 × 0.24)
Aa = 1.52 m2
B.9 Total Hole Area
Ten percent of the useable area is missing.
| (B5) |
Aℎ = 0.1 × 1.52.
Aℎ = 0.15 m2
B.10 Weir Height
Weir height = ℎw = 0.50 m.
B.11 Weir Length
It is possible to calculate the length of a weir by plotting a graph showing (Ad/Ac) × 100 and lw/Dc.
() × 100 = 12 %
Fig. B1.

Area of the downcomer in relation to the weir length.
| (B6) |
lw = 0.77 × Dc
lw = 0.77 × 1.60
lw = 1.23 m.
B.12 Weeping Check
A Froude number connection may be performed for a weeping check; no tears will be shed if the result is larger than 0.5:
| (B7) |
Therefore, there will be no weeping.
B.13 Number of Holes
| (B8) |
The hole diameter is 5 mm.
| (B9) |
Area of hole = 0.00002 m2
Number of holes = 0.15/0.00002.
Number of holes = 7756.
Number of holes per tray = 7756/28 = 277.
B.14 Tray Pressure Drop
| (B10) |
Hr = 12.53 × 10³/ρl.
Hr = 12.53 × 10³/994.43.
Hr = 12.57 mm
| (B11) |
HT = 79.84 + (50 + 41.76) + 12.57.
HT = 184.17 mm.
References
- 1.Adalder A., Paul S., Ghorai U.K. Progress of electrochemical synthesis of nitric acid: catalyst design, mechanistic insights, protocol and challenges. J. Mater. Chem. A. 2023;11(19):10125–10148. doi: 10.1039/d2ta08928a. [DOI] [Google Scholar]
- 2.Wang Y., et al. Electrochemical synthesis of nitric acid from nitrogen oxidation. Angew. Chem. Int. Ed. 2022;61(12) doi: 10.1002/anie.202115409. [DOI] [PubMed] [Google Scholar]
- 3.Pal P., Singh K.T.S.S. Selective catalytic reduction of nitrogen oxides: a review of recent advances. Catal. Rev. Sci. Eng. 2022;84(3–4):372–448. [Google Scholar]
- 4.Zhang X., et al. Photothermal‐assisted photocatalytic nitrogen oxidation to nitric acid on palladium‐decorated titanium oxide. Adv. Energy Mater. 2022;12(13) doi: 10.1002/aenm.202103740. [DOI] [Google Scholar]
- 5.Al-Sakkaf A.-G.A.A. A review on the Ostwald process for nitric acid production: recent advances and challenges. Catal. Rev. Sci. Eng. 2022;64(6):841–914. [Google Scholar]
- 6.S S B., Das K. Nitric acid production by Ostwald process: a review. ACS Publication. 2019;31(11):27457–27480. [Google Scholar]
- 7.A S N.M., Noah S.O.A. 2019. "Detection of Inducible Nitric Oxide Synthase Using a Suite of Electrochemical, Fluorescence, and Surface Plasmon Resonance Biosensors," Analytical Biochemistry. ISBN: 27548652. [DOI] [PubMed] [Google Scholar]
- 8.Singh V.K. Loss of valuable metals in plants due to oxidation of ammonia at moderate or high pressures. J. Environ. Chem. Eng. 2022 [Google Scholar]
- 9.Dang T.K. A novel approach to the chemical recycling of epoxy resin cured with amine using nitric acid. J. Clean. Prod. 2021;308:127212. [Google Scholar]
- 10.Adalder A., et al. Selective electrocatalytic oxidation of nitrogen to nitric acid using manganese phthalocyanine. ACS Applied Materials & Interfaces. 2023;15(29) doi: 10.1021/acsami.3c01847. 34642–34650. [DOI] [PubMed] [Google Scholar]
- 11.J F., Pérez-Ramírez M.J.A. Catalysis Today; 2019. Control of Nitrous Oxide Emissions from Nitric Acid Production: A Review. ISBN: 27076575. [Google Scholar]
- 12.Wang Y., Yu Y., Jia R., Zhang C., Zhang B. Electrochemical synthesis of nitric acid from air and ammonia through waste utilization, National science review. https://pubmed.ncbi.nlm.nih.gov/34691928/ Available at: [DOI] [PMC free article] [PubMed]
- 13.Gbadegesin A.O. Effect of oxidation pressure on the condensation of nitric acid from the combustion of ammonia. J. Environ. Chem. Eng. 2021;10(1):106090. [Google Scholar]
- 14.Al-Ghamdi M.A. Performance of a platinum-rhodium catalyst for ammonia oxidation at elevated pressures. Chem. Eng. J. 2022;431:135858. [Google Scholar]
- 15.dos Santos, Pérez-Ramírez P., Melo-Méndez J.A., Martínez-Máñez M., García-Hernández Á.M. A review of the control of nitrous oxide emissions from nitric acid production. J. Clean. Prod. 2022;360:127904. [Google Scholar]
- 16.Awasthi S.R. Optimization of the Ostwald process for nitric acid production using response surface methodology. Chem. Eng. J. 2019;360:1067–1075. [Google Scholar]
- 17.A., M., G., A. The applications of weak nitric acid in etching and cleaning. J. Clean. Prod. (2021).
- 18.V.K. V., T.a.S.K. J.S., & V., V. Recent advances in the concentration of nitric acid using nanotechnology. J. Nanomater. (2023).
- 19.Smith C.J. 142 ACGIH Threshold Limit Values® (TLV®s) established from 2008 to 2018 lack consistency and transparency. Toxicol. Res. Appl. 2019;3(1):1–9. [Google Scholar]
- 20.Wright A.W., Powell P., Hartmann M.J. Physical and chemical properties of tributyl phosphate/diluent/nitric acid systems: a review of recent advances. Solvent Extr. Ion Exch. 2020;38(6):521–555. [Google Scholar]
- 21.Hariprasath B.R.a.R.S. Thermal characterisation of Triple Concentric Tube Heat Exchangers by applying parameter estimation: direct problem implementation. J. Eng. Thermophys. 2022 [Google Scholar]
- 22.F., A., M., S., L., & J. Life cycle assessment of nitric acid production: a review of recent advances. J. Clean. Prod.. (2021).
- 23.Agency E.P. ACS Publication; 2022. Nitric Acid; Exemption from the Requirement of a Tolerance. [Google Scholar]
- 24.Green D., Southard M.Z. Perry’s Chemical Engineers’ Handbook. Ninth ed. McGraw-Hill Education; 2019. [Google Scholar]
- 25.S., A., R., S., & Kumar, A. Electrochemical Detection of Inducible Nitric Oxide Synthase Using a Novel Molecularly Imprinted Polymer Sensor. Biosensors and Bioelectronics.. (2020).
- 26.Al-Ghamdi M.A. Base-catalyzed depolymerization of polystyrene using a new heterogeneous catalyst. J. Polym. Sci. Part A Polym. Chem. 2021;59(2):225–238. [Google Scholar]
- 27.Ankit Jain A.K.a.A.M. Chemical Engineering Research and Design; 2022. Process Design and Optimization of Nitric Acid Plant for Sustainable Production. [Google Scholar]
- 28.El-Shahed B.M.A.A. Microwave-assisted digestion of plant materials for multi-element analysis by inductively coupled plasma mass spectrometry. Microchem. J. 2022;170:106777. [Google Scholar]
- 29.Mohebbi A.F.a.M.A. Experimental investigation of heat transfer and pressure drop characteristics of shell and coiled tube heat exchangers with different coil pitches. Heat Transfer Eng. 2019;40(16–18):1653–1665. [Google Scholar]
- 30.Pérez-Peña M.D., et al. Efficient and sustainable production of nitric acid by the Birkeland–Eyde process using a water-cooled plasma reactor. Angewandte Chemie Int. Ed. 2022;61(51):25111–25119. [Google Scholar]
- 31.Liu H.X. Design and optimization of a dielectric barrier discharge plasma reactor for the Birkeland–Eyde process. J. Mater. Chem. A. 2023 [Google Scholar]
- 32.F B A K.H.J., Rouwenhorst L.L. From the Birkeland–Eyde process towards energy-efficient plasma-based NOx synthesis: a techno-economic analysis. Energy Environ. Sci. 2021;14(5):2520–2534. doi: 10.1039/d0ee03763j. [DOI] [PMC free article] [PubMed] [Google Scholar]
- 33.Lam C.W. Chemical recycling of epoxy resin cured with amine using nitric acid and microwave irradiation. J. Clean. Prod. 2020;266 [Google Scholar]
- 34.Sultana M., Mahmood K., Ahmad W., Hussain W., Mahmood Z.S. Extract neutralization process for production of HNO3: a review. J. Environ. Chem. Eng. 2022;10(11) [Google Scholar]
- 35.Angeli T.T.a.T. Separation and Purification Technology; 2021. Solvent Extraction of uranium(VI) from Nitric Acid Solutions Using Tributyl Phosphate in a Micro-channel System. [Google Scholar]
- 36.Xie L.L.a.S. Effect of wire gauze on turbulent flow. Phys. Fluids. 2020;32(1) [Google Scholar]
- 37.V N a H.C., Smith M.M.A.J.M. McGraw-Hill Education; 2019. Chemical Engineering Design: Principles, Practice, and Economics. [Google Scholar]
- 38.S L M., Kazi T.B. Heat exchanger network synthesis with detailed exchanger designs: Part 1. A discretized differential algebraic equation model for shell and tube heat exchanger design. ACS Publication. 2020;22(1):14–28. [Google Scholar]
- 39.Buelvas Hernández D.B.A. Conventional and advanced exergoeconomic indicators of a nitric acid production plant concerning the cooling temperature in compression Train's intermediate stages. ACS Publication. 2021;23(10):12330–12331. [Google Scholar]
- 40.Nomiya M.M.a.Y.S.K. Selective oxidation of cyclohexanol to adipic acid over heteropolyacid catalysts. Appl. Catal. A Gen. 2021;622:107–116. [Google Scholar]
- 41.Wang J.L., Feng C.X., Liu H.Q., Yi D.Q., Jiang L., Feng Y.R. Revealing the role of Ru in improving corrosion resistance of titanium alloys in HCl solution. Corros. Sci. 2020;174 [Google Scholar]
Associated Data
This section collects any data citations, data availability statements, or supplementary materials included in this article.
Data Availability Statement
No data was used for the research described in the article.