

Abstract
Purpose
The Japan Society of Obstetrics and Gynecology (JSOG) registry gathers comprehensive data from registered assisted reproductive technology (ART) facilities in Japan. Herein, we report 2021 ART cycle characteristics and outcomes.
Methods
Descriptive statistics were used to summarize and analyze 2021 data.
Results
In 2021, 625 ART facilities participated in the registry; 27 facilities did not conduct ART cycles and 598 registered treatment cycles. In total, 498 140 cycles were registered, and there were 69 797 neonates (increases of 10.7% and 15.5%, respectively, from the previous year). The number of freeze‐all in vitro fertilization (IVF) and intracytoplasmic sperm injection (ICSI) cycles decreased in 2021; the number of neonates born was 2268 for IVF‐embryo transfer (ET) cycles and 2850 for ICSI cycles. Frozen–thawed ET (FET) cycles increased markedly from 2020 (11.2% increase). In 2021, 239 428 FET cycles were conducted, resulting in 87 174 pregnancies and 64 679 neonates. For fresh transfers, the total single ET, singleton pregnancy rate, and singleton live birth rates were 82.7%, 97.0%, and 97.3%; for FET, these rates were 84.9%, 96.9%, and 97.1%.
Conclusions
The 2021 Japanese ART registry analysis showed marked increases in both total treatment cycles and live births from the previous year.
Keywords: assisted reproductive technologies, fertility rate, in vitro fertilization, intracytoplasmic sperm injections, Japan
The 2021 Japanese ART registry analysis showed marked increases in both total treatment cycles and live births from the previous year.
1. INTRODUCTION
The well‐known issues of rapid aging in Japan, the increasing trend in later childbearing, 1 the declining marriage trend, 2 , 3 and their impact on fertility rates continue to be considerable challenges. 4 , 5 According to the Ministry of Health, Labour and Welfare, the fertility rate in Japan decreased to 1.33 in 2020, which is lower than the previous record low of 1.36 reported in 2019. This is a significant drop from the 1.44 fertility rate reported in 2016. 6 The World Bank reported a global fertility rate of 2.4 in 2019, which decreased by 0.10 in 2020, at 2.3, indicating not only a marked difference from Japan's current rate, 7 but also depicting a similar global trend in declining fertility rates. 7
To address the effects of aging and the potential shortage of human capital caused by Japan's aging population and decreased fertility rates, policy interventions have been created to boost fertility rates. 4 The most relevant interventions have been increases in the national childcare capacity and gradual expansion of parental leave rights, 4 increases in the financial accessibility to fertility treatments for patients, 8 and expansion of government subsidies for assisted reproductive technology (ART) since January 2021 before the insurance coverage for ART came into effect in April 2022, 9 among others.
Japan remains among the top countries globally in providing women with fertility treatments. 10 , 11 In 2020, 12 the number of treatment cycles (449 900 treatment cycles) and 60 381 live births resulting from ART reflected a 1.79% and 0.36% decrease, respectively, from that reported in 2019. 13 The Japan Society of Obstetrics and Gynecology (JSOG) has been using the ART registry system since 1986 to collect data on national trends of ART use and outcomes, as well as the online registration system implemented in 2007, both of which were established with the intent of aiding the understanding of the current effectiveness of ART, ensuring its safety, and making informed decisions related to ART in Japan. 12 This report aims to provide updated data on the characteristics and outcomes of registered ART cycles during 2021 and to compare the present results with results from previous years.
2. MATERIALS AND METHODS
2.1. Data source and data collection
The JSOG registry collects comprehensive data from registered ART facilities across Japan on demographic and background characteristics of patients, clinical information including infertility diagnosis, complications caused by treatment, obstetric history and outcomes, and ART cycle‐specific data. 14 Registered facilities adhered to the same standard definitions of parameters and outcomes and submitted their data to JSOG annually using standard formats and channels. In case of missing data, JSOG made the necessary inquiries to obtain the data. The present retrospective descriptive analysis investigated registered cycle characteristics and treatment outcomes using data from the Japanese ART registry in 2021 with a cutoff date of November 30, 2022. The JSOG Ethics Committee approved this analysis and reporting of these data.
2.2. Variables of interest
Data were collected for the number of registered cycles, oocyte retrievals, embryo transfer (ET) cycles, freeze‐all‐embryo/oocyte cycle, pregnancies, and number of neonates by fertilization method (in vitro fertilization [IVF], intracytoplasmic sperm injection [ICSI], and frozen–thawed embryo transfer [FET]) and were analyzed and compared with data from previous years. Characteristics of registered cycles and pregnancy outcomes were described for fresh and FET cycles. Fresh cycle data were stratified by fertilization method (i.e., IVF, ICSI, gamete intrafallopian transfer [GIFT], oocyte freezing, and others).
2.3. Outcomes
The treatment outcomes analyzed and compared were defined as follows. Pregnancy was defined as the confirmation of a gestational sac in utero. Miscarriage was the spontaneous or unplanned loss of a fetus from the uterus before 22 weeks of gestation. Live birth was defined as the delivery of at least one live neonate after 22 weeks of gestation. Multiple pregnancy rates were also calculated.
The pregnancy outcomes analyzed and compared included ectopic pregnancy, heterotopic pregnancy, artificially induced abortion, stillbirth, and fetal reduction. Pregnancy, live birth, miscarriage, and multiple pregnancy rates were also analyzed by patient age. Treatment outcomes for FET cycles using frozen–thawed oocytes were also analyzed.
2.4. Statistical analysis
All analyses were conducted using the STATA MP statistical package, version 17.0 (Stata, College Station). As this study focuses on descriptive analysis, statistical testing was not conducted.
3. RESULTS
In 2021, 625 ART facilities, of 625 registered with JSOG, participated in this year's registry, of which 27 facilities did not implement ART activities, and the remaining 598 facilities registered treatment cycles.
Table 1 summarizes the main trends in the numbers of registered cycles, egg retrievals, pregnancy, and neonate births categorized by IVF, ICSI, and FET cycles in Japan between 2007 and 2021. In 2021, 498 140 cycles were registered, and 69 797 neonates were recorded (10.7% and 15.5% increases, respectively, compared with the previous year). Notably, the number of registered IVF and ICSI cycles increased by 8.7% and 12.3%, respectively, from the previous year. The number of freeze‐all IVF decreased by 1.2% and ICSI by 0.80% in 2021, and the number of neonates born was 2268 for IVF‐ET cycles and 2850 for ICSI cycles, the first decreased slightly from the previous year (0.6%) and the latter increased by 9.8%. The number of FET cycles has increased continuously since 2007, and this trend was maintained in 2021; however, the increase from 2020 was 11.2%, a large increase compared with the 0.04% increase in 2019 and 5.8% from 2018 to 2019. In 2021, the number of FET cycles was 239 428, resulting in 87 174 pregnancies and 64 679 neonates (14.4% and 16.5% increases, respectively).
TABLE 1.
Trends in numbers of registered cycles, oocyte retrieval, pregnancy, and neonates based on IVF, ICSI, and frozen–thawed embryo transfer cycles in Japan, 2007–2021.
| Year | IVF a | ICSI b | FET cycle c | |||||||||||||
|---|---|---|---|---|---|---|---|---|---|---|---|---|---|---|---|---|
| No. of registered cycles | No. of egg retrievals | No. of freeze‐all cycles | No. of ET cycles | No. of cycles with pregnancy | No. of neonates | No. of registered cycles | No. of egg retrievals | No. of freeze‐all cycles | No. of ET cycles | No. of cycles with pregnancy | No. of neonates | No. of registered cycles | No. of ET cycles | No. of cycles with pregnancy | No. of neonates | |
| 2007 | 53 873 | 52 165 | 7626 | 28 228 | 7416 | 5144 | 61 813 | 60 294 | 11 541 | 34 032 | 7784 | 5194 | 45 478 | 43 589 | 13 965 | 9257 |
| 2008 | 59 148 | 57 217 | 10 139 | 29 124 | 6897 | 4664 | 71 350 | 69 864 | 15 390 | 34 425 | 7017 | 4615 | 60 115 | 57 846 | 18 597 | 12 425 |
| 2009 | 63 083 | 60 754 | 11 800 | 28 559 | 6891 | 5046 | 76 790 | 75 340 | 19 046 | 35 167 | 7330 | 5180 | 73 927 | 71 367 | 23 216 | 16 454 |
| 2010 | 67 714 | 64 966 | 13 843 | 27 905 | 6556 | 4657 | 90 677 | 88 822 | 24 379 | 37 172 | 7699 | 5277 | 83 770 | 81 300 | 27 382 | 19 011 |
| 2011 | 71 422 | 68 651 | 16 202 | 27 284 | 6341 | 4546 | 102 473 | 100 518 | 30 773 | 38 098 | 7601 | 5415 | 95 764 | 92 782 | 31 721 | 22 465 |
| 2012 | 82 108 | 79 434 | 20 627 | 29 693 | 6703 | 4740 | 125 229 | 122 962 | 41 943 | 40 829 | 7947 | 5498 | 119 089 | 116 176 | 39 106 | 27 715 |
| 2013 | 89 950 | 87 104 | 25 085 | 30 164 | 6817 | 4776 | 134 871 | 134 871 | 49 316 | 41 150 | 8027 | 5630 | 141 335 | 138 249 | 45 392 | 32 148 |
| 2014 | 92 269 | 89 397 | 27 624 | 30 414 | 6970 | 5025 | 144 247 | 141 888 | 55 851 | 41 437 | 8122 | 5702 | 157 229 | 153 977 | 51 458 | 36 595 |
| 2015 | 93 614 | 91 079 | 30 498 | 28 858 | 6478 | 4629 | 155 797 | 153 639 | 63 660 | 41 396 | 8169 | 5761 | 174 740 | 171 495 | 56 888 | 40 611 |
| 2016 | 94 566 | 92 185 | 34 188 | 26 182 | 5903 | 4266 | 161 262 | 159 214 | 70 387 | 38 315 | 7324 | 5166 | 191 962 | 188 338 | 62 749 | 44 678 |
| 2017 | 91 516 | 89 447 | 36 441 | 22 423 | 5182 | 3731 | 157 709 | 155 758 | 74 200 | 33 297 | 6757 | 4826 | 198 985 | 195 559 | 67 255 | 48 060 |
| 2018 | 92 552 | 90 376 | 38 882 | 20 894 | 4755 | 3402 | 158 859 | 157 026 | 79 496 | 29 569 | 5886 | 4194 | 203 482 | 200 050 | 69 395 | 49 383 |
| 2019 | 88 074 | 86 334 | 40 561 | 17 345 | 4002 | 2974 | 154 824 | 153 014 | 83 129 | 24 490 | 4789 | 3433 | 215 203 | 211 758 | 74 911 | 54 188 |
| 2020 | 82 883 | 81 286 | 42 530 | 13 362 | 3094 | 2282 | 151 732 | 150 082 | 87 697 | 19 061 | 3626 | 2596 | 215 285 | 211 914 | 76 196 | 55 503 |
| 2021 | 88 362 | 86 901 | 42 016 | 13 219 | 3115 | 2268 | 170 350 | 168 659 | 86 992 | 19 740 | 3875 | 2850 | 239 428 | 236 211 | 87 174 | 64 679 |
Abbreviations: ET, embryo transfer; FET, frozen–thawed embryo transfer; GIFT, gamete intrafallopian transfer; ICSI, intracytoplasmic sperm injection; IVF, in vitro fertilization.
Including GIFT and other.
Including split‐ICSI cycles.
Including cycles using frozen–thawed oocyte.
Figure 1 shows the age distributions for all registered cycles and different subgroups of cycles for ET, pregnancy, and live births in 2021. The mean patient age for registered cycles was 37.8 years (standard deviation [SD] ± 4.8); the mean age for pregnancy and live birth cycles was 35.8 years (SD ± 4.2) and 35.3 years (SD ± 4.1), respectively. In 2021, 39.9% of ART cycles registered were undertaken for women aged 40 years or over.
FIGURE 1.
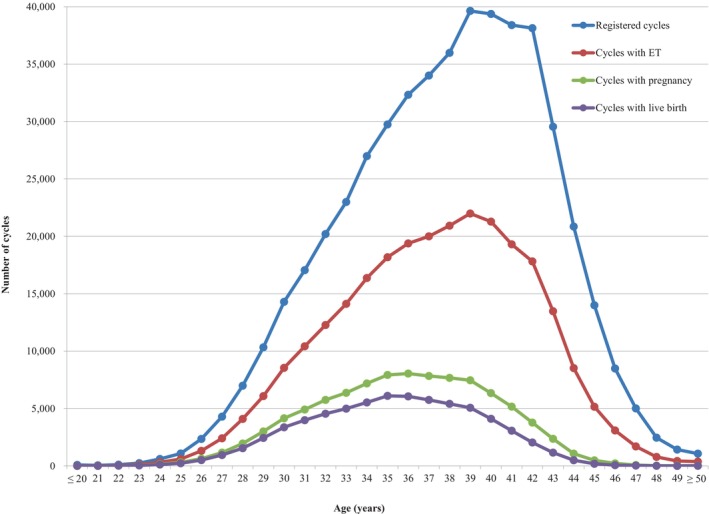
Distribution of maternal age from all registered cycles, cycles for ET, cycles leading to pregnancy, and cycles leading to live births in 2021. Adapted from the Japan Society of Obstetrics and Gynecology ART Databook 2021 (https://www.jsog.or.jp/activity/art/2021_JSOG‐ART.pdf). ET, embryo transfer.
3.1. Treatment and pregnancy outcomes
The detailed characteristics and treatment outcomes of registered fresh cycles are shown in Table 2. In 2021, 81 116 IVF cycles, 31 661 split‐ICSI cycles, 136 661 ICSI cycles using ejaculated spermatozoa, 2028 ICSI cycles using testicular sperm extraction (TESE), 10 GIFT cycles, 1103 cycles for oocyte freezing, and 6133 other cycles were registered. In total, 255 560 cycles resulted in oocyte retrieval, of which 129 008 (50.4%) were freeze‐all cycles. The pregnancy rate per ET cycle of IVF was 23.6%, and for ICSI using ejaculated spermatozoa was 18.8%. The total single ET rate was 82.7%, and the pregnancy rate following a single ET cycle was 21.7%. Live birth rates per ET were 16.7% for IVF, 18.6% for split‐ICSI, 13.3% for ICSI using ejaculated spermatozoa, 6.3% for ICSI with TESE, and 20.0% for GIFT. There were 6634 singleton pregnancies and 4845 singleton live births. The rate of singleton pregnancies was 97.0%, and the rate of singleton live births was 97.3%. In total, 1103 cycles for oocyte freezing were registered, and 1084 oocyte retrievals were conducted. Of these, 830 cycles led to successfully frozen oocytes.
TABLE 2.
Characteristics and treatment outcomes of registered fresh cycles in assisted reproductive technology in Japan, 2021.
| Variables | IVF | Split‐ICSI | ICSI | GIFT | Frozen oocyte | Other a | Total | |
|---|---|---|---|---|---|---|---|---|
| Ejaculated sperm | TESE | |||||||
| No. of registered cycles | 81 116 | 31 661 | 136 661 | 2028 | 10 | 1103 | 6133 | 258 712 |
| No. of egg retrievals (zero or more) | 79 795 | 31 441 | 135 194 | 2024 | 10 | 1084 | 6012 | 255 560 |
| No. of fresh ET cycles (one or more) | 12 763 | 3203 | 16 217 | 320 | 10 | 0 | 446 | 32 959 |
| No. of freeze‐all cycles | 38 323 | 21 866 | 64 003 | 1123 | 0 | 830 | 2863 | 129 008 |
| No. of cycles with pregnancy | 3011 | 790 | 3040 | 45 | 4 | 0 | 100 | 6990 |
| Pregnancy rate per ET | 23.6% | 24.7% | 18.8% | 14.1% | 40.0% | 22.4% | 21.2% | |
| Pregnancy rate per egg retrieval | 3.8% | 2.5% | 2.3% | 2.2% | 40.0% | 1.7% | 2.7% | |
| Pregnancy rate per egg retrieval excluding freeze‐all cycles | 7.3% | 8.3% | 4.3% | 5.0% | 40.0% | 3.2% | 5.5% | |
| SET cycles | 11 067 | 2764 | 12 804 | 199 | 1 | 417 | 27 252 | |
| Pregnancy following SET cycles | 2630 | 707 | 2436 | 34 | 0 | 96 | 5903 | |
| Rate of SET cycles | 86.7% | 86.3% | 79.0% | 62.2% | 10.0% | 93.5% | 82.7% | |
| Pregnancy rate following SET cycles | 23.8% | 25.6% | 19.0% | 17.1% | 0.0% | 23.0% | 21.7% | |
| Miscarriages | 742 | 154 | 760 | 21 | 2 | 20 | 1699 | |
| Miscarriage rate per pregnancy | 24.6% | 19.5% | 25.0% | 46.7% | 50.0% | 20.2% | 24.3% | |
| Singleton pregnancies b | 2870 | 756 | 2869 | 39 | 2 | 98 | 6634 | |
| Multiple pregnancies b | 82 | 20 | 97 | 1 | 2 | 1 | 203 | |
| Twin pregnancies | 80 | 19 | 94 | 1 | 2 | 1 | 197 | |
| Triplet pregnancies | 2 | 1 | 3 | 0 | 0 | 0 | 6 | |
| Quadruplet pregnancies | 0 | 0 | 0 | 0 | 0 | 0 | 0 | |
| Multiple pregnancy rate | 2.8% | 2.6% | 3.3% | 2.5% | 50.0% | 1.0% | 3.0% | |
| Live births | 2133 | 595 | 2152 | 20 | 2 | 78 | 4980 | |
| Live birth rate per ET | 16.7% | 18.6% | 13.3% | 6.3% | 20.0% | 17.5% | 15.1% | |
| Total no. of neonates | 2188 | 610 | 2220 | 20 | 2 | 78 | 5118 | |
| Singleton live births | 2078 | 581 | 2086 | 20 | 2 | 78 | 4845 | |
| Twin live births | 55 | 13 | 64 | 0 | 0 | 0 | 132 | |
| Triplet live births | 0 | 1 | 2 | 0 | 0 | 0 | 3 | |
| Quadruplet live births | 0 | 0 | 0 | 0 | 0 | 0 | 0 | |
| Ectopic pregnancies | 38 | 12 | 52 | 2 | 0 | 0 | 104 | |
| Heterotopic pregnancies | 0 | 0 | 0 | 0 | 0 | 0 | 0 | |
| Artificial abortions | 19 | 6 | 14 | 1 | 0 | 0 | 40 | |
| Still births | 14 | 1 | 8 | 0 | 0 | 0 | 23 | |
| Fetal reductions | 1 | 0 | 2 | 0 | 0 | 0 | 3 | |
| Cycles with unknown pregnancy outcomes | 45 | 19 | 35 | 1 | 0 | 1 | 101 | |
Abbreviations: ET, embryo transfer; GIFT, gamete intrafallopian transfer; ICSI, intracytoplasmic sperm injection; IVF, in vitro fertilization; SET, single embryo transfer; TESE, testicular sperm extraction; ZIFT, zygote intrafallopian transfer.
Others include ZIFT.
Singleton, twin, triplet, and quadruplet pregnancies were defined on the basis of the number of gestational sacs in utero.
Table 3 summarizes the characteristics and treatment outcomes of FET cycles. In 2021, a total of 239 048 cycles were registered. Of these, 238 049 were registered as FET cycles. Of the latter, 235 156 FETs were actually conducted. With a pregnancy rate of 36.9%, FET cycles resulted in 86 841 pregnancies. FET cycles resulted in 21 548 miscarriages. The miscarriage rate per pregnancy was 24.8%, the same as in the previous year, and the live birth rate per FET increased to 26.6% from 25.5% observed in 2020. The single ET rate was 84.9%, slightly lower than in 2020 (85.1%), resulting in a slightly increased pregnancy rate of 38.1% from 37.1%. The singleton pregnancy rate was 96.9%, and the live birth rate was 97.1%.
TABLE 3.
Characteristics and treatment outcomes of frozen cycles in assisted reproductive technology in Japan, 2021.
| Variables | FET | Other a | Total |
|---|---|---|---|
| No. of registered cycles | 238 049 | 999 | 239 048 |
| No. of FET | 235 156 | 849 | 236 005 |
| No. of cycles of pregnancy | 86 841 | 290 | 87 131 |
| Pregnancy rate per FET | 36.9% | 34.2% | 36.9% |
| SET cycles | 199 698 | 701 | 200 399 |
| Pregnancy following SET cycles | 76 054 | 252 | 76 306 |
| Rate of SET cycles | 84.9% | 82.6% | 84.9% |
| Pregnancy rate following SET cycles | 38.1% | 36.0% | 38.1% |
| Miscarriages | 21 548 | 75 | 21 623 |
| Miscarriage rate per pregnancy | 24.8% | 25.9% | 24.8% |
| Singleton pregnancies b | 82 932 | 272 | 83 204 |
| Multiple pregnancies b | 2619 | 8 | 2627 |
| Twin pregnancies | 2567 | 7 | 2574 |
| Triplet pregnancies | 48 | 1 | 49 |
| Quadruplet pregnancies | 4 | 0 | 4 |
| Multiple pregnancy rate | 3.1% | 2.9% | 3.1% |
| Live births | 62 619 | 206 | 62 825 |
| Live birth rate per FET | 26.6% | 24.3% | 26.6% |
| Total no. of neonates | 64 436 | 212 | 64 648 |
| Singleton live births | 60 818 | 200 | 61 018 |
| Twin live births | 1785 | 6 | 1791 |
| Triplet live births | 16 | 0 | 16 |
| Quadruplet live births | 0 | 0 | 0 |
| Ectopic pregnancies | 467 | 1 | 468 |
| Heterotopic pregnancies | 22 | 0 | 22 |
| Artificial abortions | 405 | 2 | 407 |
| Stillbirths | 237 | 0 | 237 |
| Fetal reductions | 25 | 0 | 25 |
| Cycles with unknown pregnancy outcomes | 1327 | 3 | 1330 |
Abbreviations: FET, frozen–thawed embryo transfer; SET, single embryo transfer.
Including cycles using frozen–thawed oocytes.
Singleton, twin, triplet, and quadruplet pregnancies were defined on the basis of the number of gestational sacs in utero.
3.2. Outcomes by patient age
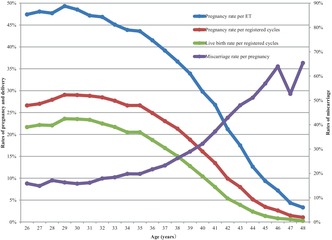
Figure 2 shows the pregnancy, live birth, and miscarriage rates by patient age in all registered cycles in 2021. Of note, the pregnancy rate per ET was above 45% until approximately 32 years of age, with a progressive decline from that point onward, becoming even more marked beyond the age of 40 years. Similar trends were observed for pregnancy and live birth rates. Conversely, miscarriage rates remained below 20% before 35 years of age, and increased subsequently and progressively until the late 40s.
FIGURE 2.
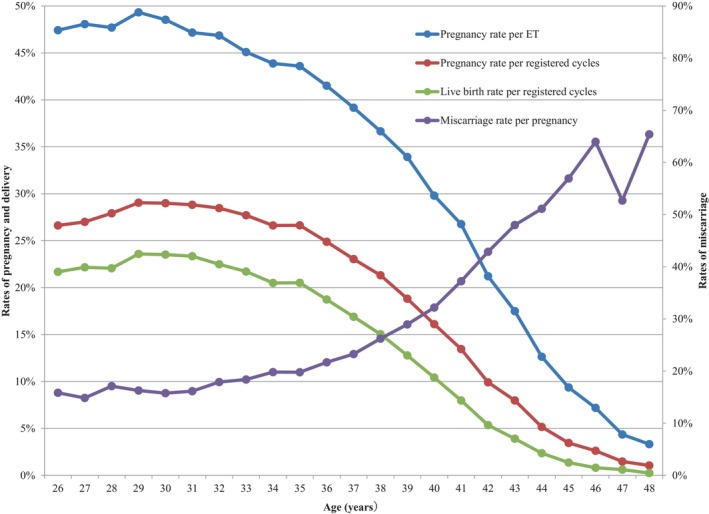
Pregnancy, live birth, and miscarriage rates according to patient age in all registered cycles in 2021. Adapted from the Japan Society of Obstetrics and Gynecology ART Databook 2021 (https://www.jsog.or.jp/activity/art/2021_JSOG‐ART.pdf). ET, embryo transfer.
Table 4 shows the treatment outcomes of registered cycles by patient age in Japan in 2021. The pregnancy rate per ET exceeded 40% for maternal ages between 21 and 36 years. Gradual decreases in pregnancy rates per ET were observed with increasing maternal age, starting at age 26 years. Rates fell below 30% for women aged >40 years, below 20% among women aged >43 years of age, below 10% for women aged >45 years, and <5% for women aged >47 years. The miscarriage rates were below 20% for all women between 22 and 35 years of age and increased gradually with increasing maternal age. Women in their early 40s had miscarriage rates of between 32.2% and 51.1%, while women in their mid‐40s had miscarriage rates over 52%. Live birth rates per registered cycle were between 15.0% and 23.6% for women between 22 and 38 years of age, which declined sharply to below 15.0% at 39 years of age and below 10.0% among women >41 years of age.
TABLE 4.
Treatment outcomes of registered cycles based on patient age in Japan, 2021.
| Age (years) | No. of registered cycles | No. of ET cycles | No. of cycles with pregnancy | Multiple pregnancies | Miscarriage | Cycles with live birth | Pregnancy rate/registered ET (%) | Pregnancy rate/registered cycles (%) | Live birth rate/registered cycles (%) | Miscarriage rate /pregnancy (%) | Multiple pregnancy rate (%) a |
|---|---|---|---|---|---|---|---|---|---|---|---|
| ≤20 | 90 | 12 | 3 | 0 | 1 | 2 | 25.00 | 3.30 | 2.20 | 33.30 | 0.00 |
| 21 | 54 | 18 | 9 | 0 | 4 | 4 | 50.00 | 16.70 | 7.40 | 44.40 | 0.00 |
| 22 | 105 | 48 | 23 | 0 | 3 | 18 | 47.90 | 21.90 | 17.10 | 13.00 | 0.00 |
| 23 | 240 | 128 | 59 | 1 | 8 | 49 | 46.10 | 24.60 | 20.40 | 13.60 | 1.75 |
| 24 | 611 | 322 | 158 | 5 | 28 | 123 | 49.10 | 25.90 | 20.10 | 17.70 | 3.18 |
| 25 | 1083 | 598 | 312 | 16 | 63 | 231 | 52.20 | 28.80 | 21.30 | 20.20 | 5.26 |
| 26 | 2348 | 1318 | 625 | 27 | 99 | 509 | 47.40 | 26.60 | 21.70 | 15.80 | 4.38 |
| 27 | 4291 | 2411 | 1159 | 26 | 172 | 951 | 48.10 | 27.00 | 22.20 | 14.80 | 2.29 |
| 28 | 6986 | 4090 | 1951 | 57 | 334 | 1541 | 47.70 | 27.90 | 22.10 | 17.10 | 2.97 |
| 29 | 10 333 | 6084 | 3001 | 79 | 488 | 2437 | 49.30 | 29.00 | 23.60 | 16.30 | 2.66 |
| 30 | 14 294 | 8539 | 4145 | 119 | 653 | 3361 | 48.50 | 29.00 | 23.50 | 15.80 | 2.91 |
| 31 | 17 057 | 10 424 | 4917 | 159 | 794 | 3983 | 47.20 | 28.80 | 23.40 | 16.10 | 3.28 |
| 32 | 20 202 | 12 273 | 5751 | 182 | 1030 | 4543 | 46.90 | 28.50 | 22.50 | 17.90 | 3.21 |
| 33 | 22 986 | 14 121 | 6368 | 189 | 1171 | 4990 | 45.10 | 27.70 | 21.70 | 18.40 | 3.01 |
| 34 | 26 983 | 16 372 | 7184 | 191 | 1422 | 5530 | 43.90 | 26.60 | 20.50 | 19.80 | 2.70 |
| 35 | 29 751 | 18 178 | 7925 | 250 | 1568 | 6104 | 43.60 | 26.60 | 20.50 | 19.8% | 3.20 |
| 36 | 32 326 | 19 383 | 8046 | 274 | 1745 | 6055 | 41.50 | 24.90 | 18.70 | 21.70 | 3.45 |
| 37 | 34 011 | 20 004 | 7836 | 259 | 1822 | 5747 | 39.20 | 23.00 | 16.90 | 23.30 | 3.36 |
| 38 | 35 988 | 20 924 | 7670 | 223 | 2011 | 5412 | 36.70 | 21.30 | 15.00 | 26.20 | 2.95 |
| 39 | 39 631 | 21 988 | 7457 | 219 | 2158 | 5066 | 33.90 | 18.80 | 12.80 | 28.90 | 2.99 |
| 40 | 39 376 | 21 281 | 6341 | 202 | 2040 | 4106 | 29.80 | 16.10 | 10.40 | 32.20 | 3.24 |
| 41 | 38 403 | 19 302 | 5167 | 153 | 1924 | 3067 | 26.80 | 13.50 | 8.00 | 37.20 | 3.01 |
| 42 | 38 130 | 17 816 | 3780 | 86 | 1620 | 2045 | 21.20 | 9.90 | 5.40 | 42.90 | 2.32 |
| 43 | 29 547 | 13 482 | 2359 | 71 | 1132 | 1155 | 17.50 | 8.00 | 3.90 | 48.00 | 3.07 |
| 44 | 20 850 | 8517 | 1076 | 28 | 550 | 492 | 12.60 | 5.20 | 2.40 | 51.10 | 2.65 |
| 45 | 13 999 | 5160 | 483 | 13 | 275 | 192 | 9.40 | 3.50 | 1.40 | 56.90 | 2.74 |
| 46 | 8490 | 3086 | 222 | 4 | 142 | 69 | 7.20 | 2.60 | 0.80 | 64.00 | 1.86 |
| 47 | 5012 | 1697 | 74 | 0 | 39 | 31 | 4.40 | 1.50 | 0.60 | 52.70 | 0.00 |
| 48 | 2466 | 782 | 26 | 1 | 17 | 6 | 3.30 | 1.10 | 0.20 | 65.40 | 4.00 |
| 49 | 1428 | 432 | 20 | 0 | 16 | 4 | 4.60 | 1.40 | 0.30 | 80.00 | 0.00 |
| ≥50 | 1069 | 380 | 17 | 0 | 7 | 10 | 4.50 | 1.60 | 0.90 | 41.20 | 0.00 |
| Total | 498 140 | 269 170 | 94 164 | 2834 | 23 336 | 67 833 | 35.00 | 18.90 | 13.60 | 24.80 | 3.06 |
Abbreviation: ET, embryo transfer.
Multiple pregnancies were defined on the basis of the number of gestational sacs in utero.
3.3. Treatment outcomes for FET cycles using frozen–thawed oocytes
In 2021, 380 cycles using frozen–thawed oocytes were registered in Japan, of which 206 FETs were actually implemented. Forty‐three pregnancies were achieved, with a pregnancy rate per FET of 20.9% and a live birth rate of 13.6%. The miscarriage rate per pregnancy was 32.6% (Table 5).
TABLE 5.
Treatment outcomes of embryo transfers using frozen–thawed oocyte in assisted reproductive technology in Japan, 2021.
| Variables | Embryo transfers using frozen–thawed oocytes |
|---|---|
| No. of registered cycles | 380 |
| No. of ET | 206 |
| No. of cycles with pregnancy | 43 |
| Pregnancy rate per ET | 20.9% |
| SET cycles | 133 |
| Pregnancy following SET cycles | 26 |
| Rate of SET cycles | 64.6% |
| Pregnancy rate following SET cycles | 19.6% |
| Miscarriages | 14 |
| Miscarriage rate per pregnancy | 32.6% |
| Singleton pregnancies a | 38 |
| Multiple pregnancies a | 4 |
| Twin pregnancies | 4 |
| Triplet pregnancies | 0 |
| Quadruplet pregnancies | 0 |
| Multiple pregnancy rate | 9.5% |
| Live births | 28 |
| Live birth rate per ET | 13.6% |
| Total number of neonates | 31 |
| Singleton live births | 25 |
| Twin live births | 3 |
| Triplet live births | 0 |
| Quadruplet live births | 0 |
| Ectopic pregnancies | 1 |
| Intrauterine pregnancies coexisting with ectopic pregnancy | 0 |
| Artificial abortions | 0 |
| Still births | 0 |
| Fetal reductions | 0 |
| Cycles with unknown pregnancy outcomes | 0 |
Abbreviations: ET, embryo transfer; SET, single embryo transfer.
Singleton, twin, triplet, and quadruplet pregnancies were defined on the basis of the number of gestational sacs in utero.
4. DISCUSSION
This report provides an overview of the characteristics and outcomes of ART cycles registered in the Japanese ART registry system during 2021. We also compare the present results with those from 2020 12 and previous years. 13 , 15 , 16 , 17 The data were collected from 598 ART facilities registered with JSOG in Japan.
In 2021, a total of 498 140 cycles were registered with JSOG in Japan, resulting in 69 797 neonates. These figures represent an increase in both measures by 10.7% and 15.5%, respectively, compared with the previous year's data. The number of fresh cycles, including IVF and ICSI, also showed an increase from the data recorded in the previous year, with increases of 8.7% and 12.3%, respectively, contrasting with previously observed trends. However, the number of freeze‐all IVF cycles decreased by 1.2%, while ICSI cycles decreased by 0.8%. The number of neonates born from IVF‐ET cycles slightly reduced by 0.6%, while for ICSI cycles, it increased by 9.8%. FET cycles increased by 11.2% in 2021, resulting in 239 428 cycles, 87 174 pregnancies, and 64 679 neonates.
Conducting this annual analysis is crucial to comprehend the changing trends and patterns in ART in Japan. This information is essential, given the continuously declining fertility rate, the growing elderly population—especially in Japan—and the decreasing population growth worldwide. 2 , 18 , 19 , 20 ART data reporting is considered a vital part of the health care infrastructure as it helps us assess the extent to which data are collected. Furthermore, these data may serve as quality‐of‐care indicators and inform evidence‐based policies that promote positive health outcomes through clinical practices in infertility treatment. 21
In Japan, subsidies were previously available for ART, instead of being covered by health insurance. These subsidies varied across different municipalities; some municipalities provided additional subsidies for patients. 22 However, there were income restrictions, and only patients with an annual household income <7 300 000 JPY could receive the subsidies. In April 2020, it was decided that insurance would cover ART, and subsidies would be abolished. This new measure was scheduled to take effect by April 2022. Between January 2021 and April 2022, while ART insurance coverage had not yet been implemented, the government expanded the fertility treatment subsidy system. They removed income restrictions and increased the subsidized amount to reduce the financial burden of infertility treatment. 23 As ART insurance coverage has been recently implemented, its effects will likely be more apparent in subsequent reports. However, the present results for 2021 show an increase in the overall number of cases of infertility treatment. This may be a result of the expanded subsidies and removal of income limitations, as well as a greater participation of younger populations.
Other factors could have potentially affected ART use during the study period despite the measures taken. The elevated ART costs and income disparities 8 , 24 , 25 are relevant factors, as it has been recently reported that women from higher income households had a higher probability of seeking assistance for fertility problems despite the financial support and increased insurance coverage. For example, some treatment options may not be covered, but mixed medical care using both insurance coverage and private expenses is prohibited. Thus, patients with higher incomes may opt to pursue all the infertility treatment out of pocket to have more treatment options, if needed. 26 The social distancing measures applied during the coronavirus disease (COVID‐19) pandemic delayed important events such as weddings, as well as subsequent childbearing, particularly for young couples. 27 Furthermore, because of the COVID‐19 pandemic, the government extended the age limitation for receiving subsidies (age 43 to age 44 years, and age 40 to age 41 years, respectively). 28 The Japanese Society for Reproductive Medicine also recommended postponing all infertility treatments, including ART in April of 2020 and issued another statement recommending the resumption of treatments with measures to control infection. Altogether, these measures resulted in the shift to receiving ART treatment from 2020 to 2021, with particularly low treatment cycles in April and May of 2020. 29 It has also been reported that individuals were cautious regarding vaccination safety and its potential effects on pregnancy and infants. Currently, no evidence supports the idea that SARS‐CoV‐2 vaccination negatively affects semen parameters or spermatogenesis, ovarian function, ovarian reserve, or folliculogenesis. Most studies have not reported a significant impact of COVID‐19 vaccination on ART outcomes. 30 , 31 , 32 It has also been reported that administering intravenous immunoglobulin G (IVIG) for immune‐related infertility treatment does not affect the efficacy of COVID‐19 vaccines. Therefore, COVID‐19 vaccines can be given during ART cycles that involve the use of IVIG. 33
Although the rate of freeze‐all cycles continuously increased up to 2020, that rate first decreased in both IVF and ICSI cycles in 2021. This may reflect that patients tended to not avoid pregnancy compared in 2020; in 2020, because of the COVID‐19 pandemic, many patients and clinicians chose freeze‐all cycles and avoided pregnancy because of the lack of evidence regarding the safety of pregnancy during the pandemic, resulting in a relatively high freeze‐all rate (51.3% in IVF cycles and 57.8% in ICSI cycles).
There is a heavy mental health and physical burden associated with ART. 10 , 34 Cultural and social factors include the social stigma associated with infertility. 35 , 36 , 37 Unmarried couples in Japan usually do not have children. 38 Further measures that could help improve Japan's current ART and fertility trends can be summarized under the governmental movements to support infertility patients. This act facilitates continuous consultation support, infertility support networks, and peer support groups, especially for those who have experienced miscarriages.
The study's strengths and limitations have been previously reported. 12 The most relevant strengths were that the data from registered ART facilities nationwide must provide annual reports, resulting in high reporting compliance. Standardizing procedures and definitions for cycle‐specific information across registered ART facilities also reduced reporting bias. Regarding limitations, some data for which collection is not standardized, such as background information, and information on newer treatments, may be incomplete or missing. To address this, information on such variables is being updated in registries from January 2022 onward.
Based on the 2021 data analysis conducted by the Japanese ART registry under the JSOG, there has been a marked increase in the number of ART cycles and neonates born compared with 2020. The trend of increasing numbers of FETs continued throughout 2021, with more significant increases compared with the previous year. The total single ET rate for fresh transfers was 82.7%, with singleton pregnancy and live birth rates of 97.0% and 97.3%, respectively. For FET, the single ET rate was 84.9%, leading to a singleton pregnancy rate of 96.9% and live birth rates of 97.1%. In summary, the 2021 data analysis from the Japanese ART registry administered by the JSOG showed promising results, with a high success rate for ART cycles resulting in live births.
CONFLICT OF INTEREST STATEMENT
“Iwase, Akira” is an Editorial Board member of Reproductive Medicine and Biology and a coauthor of this article. To minimize bias, they were excluded from all editorial decision‐making related to the acceptance of this article for publication. The authors have no conflict of interest to disclose in relation to this work.
HUMAN RIGHTS STATEMENTS AND INFORMED CONSENT
All procedures were performed in accordance with the ethical standards of the relevant committees on human experimentation (institutional and national) and the Helsinki Declaration of 1964 and its later amendments.
ANIMAL RIGHTS
This report does not contain any studies performed by any authors that included animals.
ACKNOWLEDGMENTS
The authors thank all of the registered facilities for their cooperation in providing their responses and encourage these facilities to continue promoting the use of the online registry system and assisting us with our research. The authors also thank Keyra Martinez Dunn, MD of Edanz (www.edanz.com/), for providing medical writing support.
Katagiri Y, Jwa SC, Kuwahara A, Iwasa T, On M, Kato K, et al. Assisted reproductive technology in Japan: A summary report for 2021 by the Ethics Committee of the Japan Society of Obstetrics and Gynecology. Reprod Med Biol. 2024;23:e12552. 10.1002/rmb2.12552
REFERENCES
- 1. Frejka T, Jones GW, Sardon JP. East Asian childbearing patterns and policy developments. Popul Dev Rev. 2010;36(3):579–606. [DOI] [PubMed] [Google Scholar]
- 2. Ghaznavi C, Sakamoto H, Yamasaki L, Nomura S, Yoneoka D, Shibuya K, et al. Salaries, degrees, and babies: trends in fertility by income and education among Japanese men and women born 1943‐1975‐analysis of national surveys. PloS One. 2022;17(4):e0266835. [DOI] [PMC free article] [PubMed] [Google Scholar]
- 3. Okui T. Marriage and fertility rates of Japanese women according to employment status: an age‐period‐cohort analysis. Nihon Koshu Eisei Zasshi. 2020;67(12):892–903. [DOI] [PubMed] [Google Scholar]
- 4. Parsons AJQ, Gilmour S. An evaluation of fertility‐ and migration‐based policy responses to Japan's ageing population. PloS One. 2018;13(12):e0209285. [DOI] [PMC free article] [PubMed] [Google Scholar]
- 5. Baba S, Goto A, Reich MR. Looking for Japan's missing third baby boom. J Obstet Gynaecol Res. 2018;44(2):199–207. [DOI] [PubMed] [Google Scholar]
- 6. Ministry of Health, Labour and Welfare of Japan . Handbook of Health and Welfare Statistics 2022. Part 1 Population and households. Chapter 2 Vital statistics. Table 1‐20 Total fertility rates by year. Tokyo: Ministry of Health, Labour and Welfare of Japan [Cited 2023 Oct 26]. Available from: https://www.mhlw.go.jp/english/database/db‐hh/1‐2.html
- 7. The World Bank Data . Fertility rate, total (births per woman). [Cited 2023 Oct 26]. Available from: https://data.worldbank.org/indicator/SP.DYN.TFRT.IN
- 8. Chambers GM, Sullivan EA, Ishihara O, Chapman MG, Adamson GD. The economic impact of assisted reproductive technology: a review of selected developed countries. Fertil Steril. 2009;91(6):2281–2294. [DOI] [PubMed] [Google Scholar]
- 9. Ministry of Health, Labour and Welfare of Japan . Infertility treatment is covered by insurance from April 2022. Tokyo: Ministry of Health, Labour and Welfare of Japan [Cited 2023 Oct 26]. Available from: https://www.mhlw.go.jp/content/leaflet202212ver2.pdf
- 10. Kato T, Sampei M, Saito K, Morisaki N, Urayama KY. Depressive symptoms, anxiety, and quality of life of Japanese women at initiation of ART treatment [published correction appears in Sci Rep. 2021;11(1):22793]. Sci Rep. 2021;11(1):7538. [DOI] [PMC free article] [PubMed] [Google Scholar]
- 11. Audibert C, Glass D. A global perspective on assisted reproductive technology fertility treatment: an 8‐country fertility specialist survey. Reprod Biol Endocrinol. 2015;13:133. [DOI] [PMC free article] [PubMed] [Google Scholar]
- 12. Katagiri Y, Jwa SC, Kuwahara A, Iwasa T, Ono M, Kato K, et al. Assisted reproductive technology in Japan: a summary report for 2020 by the ethics Committee of the Japan Society of obstetrics and gynecology. Reprod Med Biol. 2023;22(1):e12494. [DOI] [PMC free article] [PubMed] [Google Scholar]
- 13. Ishihara O, Jwa SC, Kuwahara A, Katagiri Y, Kuwabara Y, Hamatani T, et al. Assisted reproductive technology in Japan: a summary report for 2018 by the ethics Committee of the Japan Society of obstetrics and gynecology. Reprod Med Biol. 2020;20(1):3–12. [DOI] [PMC free article] [PubMed] [Google Scholar]
- 14. Irahara M, Kuwahara A, Iwasa T, Ishikawa T, Ishihara O, Kugu K, et al. Assisted reproductive technology in Japan: a summary report of 1992‐2014 by the ethics committee, Japan Society of Obstetrics and Gynecology. Reprod Med Biol. 2017;16(2):126–132. [DOI] [PMC free article] [PubMed] [Google Scholar]
- 15. Ishihara O, Jwa SC, Kuwahara A, Katagiri Y, Kuwabara Y, Hamatani T, et al. Assisted reproductive technology in Japan: a summary report for 2017 by the ethics Committee of the Japan Society of obstetrics and gynecology. Reprod Med Biol. 2019;19(1):3–12. [DOI] [PMC free article] [PubMed] [Google Scholar]
- 16. Ishihara O, Jwa SC, Kuwahara A, Ishikawa T, Kugu K, Sawa R, et al. Assisted reproductive technology in Japan: a summary report for 2016 by the ethics Committee of the Japan Society of obstetrics and gynecology. Reprod Med Biol. 2018;18(1):7–16. [DOI] [PMC free article] [PubMed] [Google Scholar]
- 17. Saito H, Jwa SC, Kuwahara A, Saito K, Ishikawa T, Ishihara O, et al. Assisted reproductive technology in Japan: a summary report for 2015 by the ethics Committee of the Japan Society of Obstetrics and Gynecology. Reprod Med Biol. 2017;17(1):20–28. [DOI] [PMC free article] [PubMed] [Google Scholar]
- 18. National Institute of Population and Social Security Research . Population projections for Japan: 2016 to 2065. 2017. [Cited 2023 Oct 26]. Available from: http://www.ipss.go.jp/index‐e.asp
- 19. Matsuda S. Characteristics and problems of the countermeasures against low fertility in Japan: reasons that fertility is not increasing. In: Matsuda S, editor. Low fertility in Japan, South Korea, and Singapore: population policies and their effectiveness. Singapore: Springer Nature; 2020. p. 1–14. [Google Scholar]
- 20. Schoppa LJ. The policy response to declining fertility rates in Japan: relying on logic and hope over evidence. Soc Sci Japan J. 2020;23:3–21. [Google Scholar]
- 21. Wu C‐L, Ha J‐O, Tsuge A. Data reporting as care infrastructure: assembling ART registries in Japan, Taiwan, and South Korea. East Asian Science, Technology and Society: An International Journal. 2020;14:35–59. [Google Scholar]
- 22. Jwa SC, Ishihara O, Kuwahara A, Saito K, Saito H, Terada Y, et al. Cumulative live birth rate according to the number of receiving governmental subsidies for assisted reproductive technology in Saitama prefecture, Japan: a retrospective study using individual data for governmental subsidies. Reprod Med Biol. 2021;20(4):451–459. [DOI] [PMC free article] [PubMed] [Google Scholar]
- 23. Ministry of Health, Labour and Welfare of Japan . Support for infertility treatment. [Cited 2023 Oct 26]. Available from: https://www.mhlw.go.jp/content/230401zen.pdf
- 24. Iba A, Maeda E, Jwa SC, Yanagisawa‐Sugita A, Saito K, Kuwahara A, et al. Household income and medical help‐seeking for fertility problems among a representative population in Japan. Reprod Health. 2021;18(1):165. [DOI] [PMC free article] [PubMed] [Google Scholar]
- 25. Chambers GM, Hoang VP, Illingworth PJ. Socioeconomic disparities in access to ART treatment and the differential impact of a policy that increased consumer costs. Hum Reprod. 2013;28(11):3111–3117. [DOI] [PubMed] [Google Scholar]
- 26. Japan Society of Fertilization and Implantation . Assisted reproductive technology what is ART? > Q15. Please tell me the cost of ART. When Can I Use Health Insurance? July 7, 2017. [Cited 2023 Oct 26]. Available from: http://www.jsfi.jp/citizen/art‐qa15.html [Google Scholar]
- 27. Round table discussion featured by Igaku‐shoin. Naoaki Kuji, Yoshiharu Morimoto, Minoru Osuga, Yasushi Yumura. One year after insurance coverage, the current status of infertility treatment. [Cited 2023 Oct 26]. Available from: https://www.igaku‐shoin.co.jp/paper/archive/y2023/3514_01.
- 28. Ministry of Health, Labour and Welfare of Japan . Response to the spread of the new coronavirus in subsidized infertility treatment. [Cited 2023 Oct 26]. Available from: https://www.mhlw.go.jp/content/11925000/000620365.pdf
- 29. Jwa SC, Kuwahara A, Ishihara O, Fujiwara H. Impact of COVID‐19 pandemic on assisted reproductive technology treatment under voluntary lockdown in Japan. Reprod Med Biol. 2023;22(1):e12541. [DOI] [PMC free article] [PubMed] [Google Scholar]
- 30. Huang J, Fang Z, Liu Y, Xing C, Huang L, Mao J, et al. Effect of female coronavirus disease 2019 vaccination on assisted reproductive outcomes: a systematic review and meta‐analysis. Fertil Steril. 2023;119(5):772–783. [DOI] [PMC free article] [PubMed] [Google Scholar]
- 31. Zaçe D, La Gatta E, Petrella L, Di Pietro ML. The impact of COVID‐19 vaccines on fertility‐A systematic review and meta‐analysis. Vaccine. 2022;40(42):6023–6034. [DOI] [PMC free article] [PubMed] [Google Scholar]
- 32. Takahashi K, Samura O, Hasegawa A, Okubo H, Morimoto K, Horiya M, et al. COVID‐19 mRNA vaccination status and concerns among pregnant women in Japan: a multicenter questionnaire survey. BMC Pregnancy Childbirth. 2023;23(1):332. [DOI] [PMC free article] [PubMed] [Google Scholar]
- 33. Han AR, Lee D, Kim SK, Choo CW, Park JC, Lee JR, et al. Effects and safety of COVID‐19 vaccination on assisted reproductive technology and pregnancy: a comprehensive review and joint statements of the KSRM, the KSRI, and the KOSAR. Clin Exp Reprod Med. 2022;49(1):2–8. [DOI] [PMC free article] [PubMed] [Google Scholar]
- 34. Schaller MA, Griesinger G, Banz‐Jansen C. Women show a higher level of anxiety during IVF treatment than men and hold different concerns: a cohort study. Arch Gynecol Obstet. 2016;293(5):1137–1145. [DOI] [PubMed] [Google Scholar]
- 35. Yokota R, Okuhara T, Okada H, Goto E, Sakakibara K, Kiuchi T. Association between stigma and anxiety, depression, and psychological distress among Japanese women undergoing infertility treatment. Healthcare (Basel). 2022;10(7):1300. [DOI] [PMC free article] [PubMed] [Google Scholar]
- 36. Yokota R, Okuhara T, Okada H, Goto E, Sakakibara K, Kiuchi T. Associations between stigma, cognitive appraisals, coping strategies and stress responses among Japanese women undergoing infertility treatment. Healthcare (Basel). 2022;10(10):1907. [DOI] [PMC free article] [PubMed] [Google Scholar]
- 37. Imai Y, Endo M, Kuroda K, Tomooka K, Ikemoto Y, Sato S, et al. Risk factors for resignation from work after starting infertility treatment among Japanese women: Japan‐female employment and mental health in assisted reproductive technology (J‐FEMA) study. Occup Environ Med. 2020;78(6):426–432. [DOI] [PMC free article] [PubMed] [Google Scholar]
- 38. Atoh M. Why are cohabitation and extra‐marital births so few in Japan? Paper presented at the EURESCO conference “The second Demographic Transition in Europe. Bad Herrenalb, Germany, 23‐28 June 2001.