

Abstract
Background
Although cardiovascular mortality (CVM) rates in the United States have been declining overall, our study evaluated whether this holds true for areas with increased social deprivation.
Methods and Results
We used county‐level cross‐sectional age‐adjusted CVM rates (aa‐CVM) (2000–2019) linked to the Centers for Disease Control and Prevention Social Vulnerability Index (SVI–2010). We grouped counties as per SVI (Groups I 0–0.2, II 0.21–0.4, III 0.41–0.6, IV 0.61–0.8, and V 0.81–1) and calculated the relative change in the aa‐CVM between 2000 to 2003 and 2016 to 2019. We used adjusted linear regression analyses to explore the association between a higher SVI and temporal aa‐CVM improvement; we studied this temporal change in aa‐CVM across subgroups of race, sex, and location. The median aa‐CVM rate (per 100 000) was 272.6 (interquartile range [IQR]: 237.5–311.7). The aa‐CVM was higher in men (315.6 [IQR: 273.4–363.9]) than women (221.3 [IQR: 189.6–256.7]), and in Black residents (347.2 [IQR: 301.1–391.1]; P<0.001) than White residents (258.9 [IQR: 226–299.1]; P<0.001). The aa‐CVM for SVI I (233.6 [IQR: 214.8–257.0]) was significantly lower than that of group V (323.6 [IQR: 277.2–359.2]; P<0.001). The relative reduction in CVM was significantly higher for SVI group I (32.2% [IQR: 24.2–38.4]) than group V (27.2% [IQR: 19–34.1]) counties. After multivariable adjustment, a higher SVI index was associated with lower relative improvement in the age‐adjusted CVM (model coefficient −3.11 [95% CI, −5.66 to −1.22]; P<0.001).
Conclusions
Socially deprived counties in the United States had higher aa‐CVM rates, and the improvement in aa‐CVM over the past 20 years was lower in these counties.
Keywords: cardiovascular mortality, social determinants of health, social vulnerability
Subject Categories: Cardiovascular Disease, Disparities, Health Equity, Social Determinants of Health
Nonstandard Abbreviations and Acronyms
- CDC
Centers for Disease Control and Prevention
- CVM
cardiovascular mortality
- SDOH
social determinants of health
- SVI
Social Vulnerability Index
Clinical Perspective.
What Is New?
Although cardiovascular mortality has improved in the United States over the past 20 years, the rate of improvement is substantially lower for counties with higher social vulnerability.
What Are the Clinical Implications?
To further improve cardiovascular mortality in the United States, correcting social vulnerability is a must.
Cardiovascular diseases (CVD) are the leading causes of death in the United States. 1 , 2 Although cardiovascular mortality (CVM) rates have markedly declined between 1980 and 2014, the drivers of these declines have been generally attributed to advances in therapeutics and access. 3 The introduction and expanded use of statins, intensive blood pressure management, and the adoption of risk prediction models like the pooled cohort equation are all measures that have likely contributed toward improved cardiovascular health over this time period. 4 However, a prior study using data from the Centers for Disease Control and Prevention Wide‐Ranging Online Data for Epidemiologic Research (CDC WONDER) reported that the rate of improvement in CVM has reduced since 2011. 5 Furthermore, despite these impressive national trends, there are large regional and subregional spatial and temporal differences that are poorly understood. Among factors that may explain such geographical variation are the social determinants of health (SDOH) that are known to be very different among counties in the United States. 5 Most studies to date have also not examined the relationship between social vulnerability and the changes in CVM rates fully. Furthermore, these studies, although contributing to our knowledge, have also themselves raised further questions. A recent study reported the US county‐level CVM trajectory over 3 decades using data from the Global Burden of Disease. 3 The authors linked this information with county‐level characteristics, namely, race or ethnic composition, median income, educational attainment, and violent crime rates. However, authors used a clustering algorithm and grouped counties according to the observed CVM trajectory and not according to their baseline characteristics. Therefore, the study does not allow readers to understand the interaction between SDOH and the change in CVM over the study period. 3 The Heart Disease and Stroke work group recently reported significant disparities in cardiovascular burden across races, ethnicities, and geographic areas but did not delve deeper into the relationship between baseline county‐level SDOH and temporal changes in CVD. 6 Therefore, given these knowledge gaps, we aimed to investigate the relationship between county‐level SDOH and the change in age‐adjusted CVM over a 20‐year period.
Methods
Data Availability Statement
All data and code for this study are available at https://github.com/svd09).
County‐Level CVM
County‐level CVM data were abstracted from the CDC WONDER. This online database uses death certificate information to report summary statistics regarding cause‐specific mortality at different geographical levels. 7 We used the information provided by the National Center for Health Statistics to identify the county‐level rate of mortality from major cardiovascular disease as the primary cause of death. The National Center for Health Statistics defines CVM as deaths due to the following International Classification of Diseases, Tenth Revision (ICD‐10) codes: all CVD (codes I00–I99), ischemic heart disease (codes I00–I09, I11, I13, and I20–I51), cerebrovascular disease (codes I60–I69). We extracted data from 2000 through 2019 in five 4‐year groups as follows: 2000 to 2003, 2004 to 2007, 2008 to 2011, 2012 to 2015, and 2016 to 2019. To obtain the CVM over the 20‐year period we pooled data from all time periods. By pooling data over multiple years, we were able to minimize the possibility of missing information from sparsely populated counties.
Social Vulnerability Index
We obtained the 2010 and 2018 county‐level Social Vulnerability Index (SVI) from the CDC Agency for Toxic Substances and Disease Registry, which uses US Census data to determine the social vulnerability for each census tract in the United States. 8 The Agency for Toxic Substances and Disease Registry assessed 16 social factors and grouped them into 4 related themes (Figure S1). 8 These themes (socioeconomic status, household characteristics, racial and ethnic minority group status, and housing type/transportation) were pooled in a weighted manner to obtain a single SVI score (Figure S2). This census‐tract level SVI integer score ranges between 0 and 1, with a higher score denoting increasing vulnerability. Using data from the US Census Bureau, we obtained the county‐level SVI score by averaging the SVI scores for all census tracts within each county. 9 In order to study the association between the SVI and age‐adjusted CVM more effectively we further categorized the SVI score into 5 groups (from least to most vulnerable) as follows: Group I, 0 to 0.2; Group II, 0.21 to 0.4; Group III, 0.41 to 0.6; Group IV, 0.61 to 0.8; and Group V, 0.81 to 1.
County Characteristics
We further collected county‐level demographic data (percentage of Black non‐Hispanic residents, percentage of Hispanic residents, percentage of non‐Hispanic White residents) and the proportion of residents with traditional cardiovascular risk factors (smoking, diabetes, obesity, coronary artery disease, stroke, and chronic kidney disease) from the CDC PLACES (2019) data sets (https://www.cdc.gov/places/help/data‐notes/index.html).
Statistical Analysis
We calculated the age‐adjusted CVM rate (per 100 000 residents) for each SVI group. As the distribution was not normal, we used the median (interquartile range) to present summary statistics. We compared and reported county‐level baseline characteristics for each SVI group and used the group‐level Χ2 test to evaluate the overall difference between groups. We compared CVM rates for men versus women, White versus Black residents, and metropolitan versus nonmetropolitan counties with the 2‐tailed Kruskal–Wallis test using the Bonferroni multiplicity correction factor to compare results between SVI groups.
The CDC WONDER algorithm defines cause‐specific mortality rates as unreliable with raw counts below 20 for any geographical unit; these values were therefore not reported by the CDC WONDER algorithm and hence, these counties were excluded from further analyses. 10 To evaluate temporal changes in CVM, we divided our 20‐year time‐period into 5 time groups by 4‐yearly intervals as follows: 2000 to 2003, 2004 to 2007, 2008 to 2011, 2012 to 2015, and 2016 to 2019. We then obtained the relative percentage decrease in the age‐adjusted CVM using the following equation:
We then compared the relative decrease in the age‐adjusted CVM for each SVI group in the overall cohort and repeated these analyses in each studied subgroup. To further understand the association between the SVI and temporal change in the age‐adjusted CVM, we fit a univariate linear regression model using the relative change in the age‐adjusted CVM as the outcome and the SVI group as the predictor variable. For the model that evaluated the association between the SVI group and the relative decrease in the CVM, we included the following covariates for adjustment: the county‐level prevalence of smoking, diabetes, hypertension, coronary artery disease, stroke, and chronic kidney disease. To test the association between the SVI group and the relative decrease in CVM in the specified subgroups (sex, race, and metropolitan/nonmetropolitan) we fit univariate regression models and tested for effect modification (according to race, sex, and metropolitan/nonmetropolitan county location) at the 95% confidence level. Finally, as we chose to model the SVI as a single baseline score over the 20‐year study period, a possible explanation for the observed change in CVM over the 20‐year study period could plausibly simply be due to county‐level change in the SVI. To test this hypothesis, we first mapped the SVI for each county in 2010 and 2018 and compared these maps visually. We then calculated the correlation coefficient between the difference in the SVI (between 2010 and 2018) for each county and the reported relative change in the age‐adjusted CVM for that county. We also fit a linear regression model using the SVI change as the explanatory variable and tested its coefficient for statistical significance at the 95% confidence level. We have limited our analyses to counties with data reported in all time periods (Consolidated Standards of Reporting Trials diagram Figure S2).
We used R 4.2.2 (The R Foundation for Statistical Computing) for all statistical analyses. 11 The study used publicly available data and therefore was exempt from institutional ethics approval. As this study used county‐level summary data, individual subject consent was not required. We used cartographic boundary shape files from the US Census (https://www.census.gov/geographies/mapping‐files/time‐series/geo/tiger‐line‐file.html) and the sf package R package for creating maps. 12 We conducted and reported the study according to Strengthening the Reporting of Observational Studies in Epidemiology guidelines.
Results
Overview of study data: From a total of 3143 counties in the United States, we analyzed data from 3052 US counties (97% of the total number) reported over the 20‐year study duration (2000–2019). In studied counties the overall proportion of White, Black, and Hispanic residents was 85.5%, 9.7%, and 7.8% respectively. Among adults, the prevalence of smoking, diabetes, obesity, coronary artery disease, stroke, and chronic kidney disease was 20.2%, 13.1%, 35.1%, 8.6%, 4.1%, and 3.4% respectively. Of 3052 counties, 581 (19%) and 622 (20.4%) belonged to the SVI groups I (least vulnerable) and V (most vulnerable) respectively (Figure 1). Compared with the SVI group I counties, those belonging to group V had a higher prevalence of all traditional cardiovascular risk factors. The proportion of Black and Hispanic residents was also significantly higher in the SVI group V counties (Table 1).
Figure 1. Distribution of the Social Vulnerability Index groups in the United States.
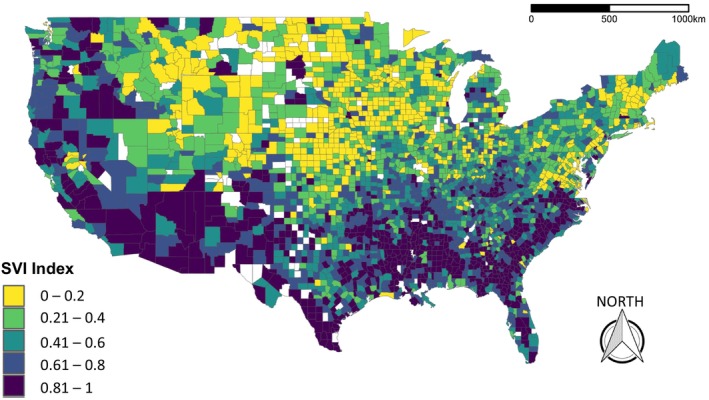
This figure depicts the US counties according to the Social Vulnerability Index (SVI).
Table 1.
Racial, Ethnic, and Cardiovascular Risk Factors at the County Level According to Their SVI Group
| County‐level summary characteristics | SVI Group I | Group II | Group III | Group IV | Group V | P value* |
|---|---|---|---|---|---|---|
| n=581 | n=618 | n=610 | n=621 | n=622 | ||
| Race and ethnicity | ||||||
| Black residents | 2.44 (4.53) | 4.19 (6.52) | 6.24 (8.20) | 10.67 (12.73) | 24.40 (21.99) | <0.001 |
| Hispanic residents | 3.10 (3.09) | 4.79 (5.47) | 7.10 (9.51) | 8.94 (12.09) | 14.47 (21.13) | <0.001 |
| White residents | 95.32 (5.84) | 92.25 (8.38) | 89.48 (10.49) | 84.18 (13.96) | 66.79 (20.48) | <0.001 |
| Clinical characteristics | ||||||
| Stroke | 3.49 (0.62) | 3.74 (0.67) | 4.00 (0.69) | 4.27 (0.71) | 4.91 (0.94) | <0.001 |
| Coronary artery disease | 7.59 (1.41) | 8.08 (1.66) | 8.68 (1.76) | 9.04 (1.73) | 9.50 (1.55) | <0.001 |
| Smoking | 17.09 (2.52) | 18.98 (3.10) | 20.31 (3.64) | 21.72 (3.70) | 22.60 (4.02) | <0.001 |
| Diabetes | 10.83 (1.67) | 11.74 (1.96) | 12.86 (2.00) | 13.80 (2.07) | 15.94 (2.56) | <0.001 |
| Chronic kidney disease | 3.06 (0.43) | 3.20 (0.46) | 3.38 (0.45) | 3.55 (0.45) | 3.98 (0.54) | <0.001 |
| Obesity | 32.70 (4.34) | 33.47 (3.99) | 34.54 (4.06) | 36.04 (3.74) | 38.37 (4.03) | <0.001 |
This table presents the racial and ethnic characteristics and the prevalence of traditional cardiovascular risk factors at the county level. All values are reported as percentage (SD). SVI indicates Social Vulnerability Index.
P values reported as for all groups together as a chunk test and are not to be interpreted as those between any 2 groups.
Cardiovascular Mortality During the Study Period
Over the 20‐year study period, the median county‐level age‐adjusted CVM rate (per 100 000 residents) was 272.6 (interquartile range [IQR]: 237.5–311.7) (Table 2). Men (315.6 [IQR: 273.4–363.9]) had higher age‐adjusted CVM rates than women (221.3 [IQR: 189.6–256.7]), and Black residents (347.2 [IQR: 301.1–391.1]; P<0.001) had higher age‐adjusted CVM rates than White residents (258.9 [IQR: 226–299.1]; P<0.001). The age‐adjusted CVM in 1892 nonmetropolitan counties (268.6 [IQR: 231.7–315.2]) was slightly higher than in the 1160 metropolitan counties (248.2 [IQR: 215.2–283.2]).
Table 2.
County‐Level Age‐Adjusted Cardiovascular Mortality in the United States (2000–2019)
| County‐level age‐adjusted cardiovascular mortality rate per 100 000 residents | ||||||
|---|---|---|---|---|---|---|
| Group studied | Whole 20‐year period: 2000–2019 | Years 2000–2003 | Years 2004–2007 | Years 2008–2011 | Years 2012–2015 | Years 2016–2019 |
| Overall | 272.6 (237.5–311.71) | 338.0 (297.6–384.1) | 289.9 (249.6–333.5) | 255.3 (219.8–296.7) | 241.6 (207.4–282.1) | 236.3 (203.7–276.2) |
| According to sex | ||||||
| Women | 221.3 (189.6–256.7) | 287.9 (251.2–328.5) | 246.2 (210.5–286.4) | 216.1 (182.8–252.6) | 202.0 (171.8–239.2) | 195.8 (166.8–230.2) |
| Men | 315.6 (273.4–363.9) | 408.8 (359.9–464.7) | 346.8 (301.1–397.4) | 308.1 (263.9–356.8) | 291.0 (250.1–337.7) | 288.2 (247.6–334.7) |
| According to race | ||||||
| Black residents | 347.2 (301.1–391.1) | 449.6 (398.7–503.0) | 388.6 (340.0–437.5) | 335.6 (291.9–384.2) | 313.8 (266.5–359.5) | 307.8 (264.1–357.6) |
| White residents | 258 (226–299.1) | 334.1 (296.4–378.0) | 286.5 (249.0–327.1) | 252.9 (219.2–292.5) | 240.2 (207.8–279.8) | 236.5 (204.1–275.5) |
| According to location | ||||||
| Metropolitan | 248.2 (215.2–283.2) | 334.8 (397.8–374.6) | 282.1 (247.3–318.5) | 245.2 (212.6–279.2) | 230.3 (199.3–261.9) | 225.6 (196.4–258.8) |
| Nonmetropolitan | 268.6 (231,7–315.2) | 341.0 (297.4–390.5) | 297.0 (251.9–344.2) | 263.0 (225.7–308.5) | 250.2 (213.5–293.9) | 244.8 (209.3–287.4) |
This table presents the median (interquartile range) values for the age‐adjusted cardiovascular mortality rates in the United States (2000–2019) observed in our study.
Overall, the age‐adjusted CVM was 233.6 (IQR: 214.8–257.0) for SVI group I (least vulnerable), whereas it was significantly higher for SVI group V (323.6 [IQR: 277.2–359.2]; P<0.001). The age‐adjusted CVM rates incrementally increased from SVI groups I to V in all studied subgroups (Table 3).
Table 3.
Age‐Adjusted Cardiovascular Mortality According to the Social Vulnerability Index
| SVI group | Entire study period (2000–2019) | Years 2000–2003 | Years 2016–2019 |
|---|---|---|---|
| All residents in all studied counties | |||
| I | 233.6 (214.8–257.0) | 293.1 (266.9–323.9) | 200.6 (180.1–224.0) |
| II | 257.4 (227.3–283.4) | 320.3 (287.1–353.4) | 221.7 (195.9–247.0) |
| III | 274.9 (248.0–303.5) | 341.4 (305.9–375.1) | 238.1 (208.1–268.7) |
| IV | 299.3 (268.0–330.7) | 365.2 (332.4–403.4) | 259.8 (229.6–293.6) |
| V | 323.6 (277.2–359.2) | 388.3 (336.3–432.8) | 283.4 (238.8–325.2) |
| Only women in all studied counties | |||
| I | 187.4 (167.9–209.4) | 248.3 (220.9–276.5) | 166.3 (145.9–188.7) |
| II | 205.3 (178.1–232.9) | 265.9 (241.8–301.2) | 183.1 (160.1–207.1) |
| III | 220.8 (192.8–247.8) | 288.2 (257.4–321.2) | 194.2 (166.8–223.2) |
| IV | 241.3 (211.4–272.2) | 309.1 (279.1–344.8) | 214.9 (188.3–244.2) |
| V | 263.4 (223.6–298.3) | 328.4 (289.7–372.5) | 232.7 (196.6–267.5) |
| Only men in all studied counties | |||
| I | 269.1 (244.7–299.9) | 358.2 (325.1–393.0) | 243.1 (216.9–270.0) |
| II | 291.9 (262.2–325.6) | 389.0 (349.9–428.9) | 268.9 (238.2–299.0) |
| III | 315.1 (278.2–349.8) | 409.1 (365.6–451.6) | 290.5 (254.2–326.9) |
| IV | 345.5 (308.4–383.4) | 436.0 (390.1–483.1) | 312.3 (275.6–359.9) |
| V | 375.4 (318.9–423.9) | 466.4 (406.0–521.1) | 341.3 (289.1–393.8) |
| Only Black residents in all studied counties | |||
| I | 274.9 (250.4–305.4) | 371.9 (319.5–411.5) | 248.2 (220.5–271.4) |
| II | 300.1 (259.9–345.9) | 415.6 (363.1–458.6) | 264.4 (231.1–317.2) |
| III | 325.0 (293.9–367.1) | 431.7 (394.0–484.9) | 285.9 (255.9–328.2) |
| IV | 351.8 (310.6–389.1) | 454.4 (415.3–500.6) | 309.6 (274.3–349.0) |
| V | 377.4 (388.8–420.4) | 473.4 (433.8–529.4) | 344.7 (300.9–389.0) |
| Only White residents in all studied counties | |||
| I | 223.8 (202.3–246.9) | 293.4 (265.0–322.4) | 201.9 (181.7–226.4) |
| II | 242.7 (216.7–273.5) | 320.2 (285.9–352.3) | 222.3 (196.8–249.0) |
| III | 261.1 (229.6–293.2) | 337.6 (304.9–372.7) | 240.2 (208.4–273.0) |
| IV | 285.4 (249.2–321.1) | 357.7 (326.8–396.9) | 260.2 (229.8–296.9) |
| V | 301.9 (263.8–339.5) | 375.5 (331.2–414.5) | 275.2 (238.3–313.1) |
| Only metropolitan counties | |||
| I | 226.2 (196.0–268.5) | 302.6 (274.7–330.3) | 197.4 (176.4–218.8) |
| II | 246.9 (213.7–291.8) | 323.1 (289.8–361.5) | 217.8 (195.2–243.6) |
| III | 260.3 (223.3–304.8) | 337.9 (299.7–375.9) | 225.8 (197.4–261.2) |
| IV | 278.6 (242.3–329.6) | 356.3 (328.9–385.6) | 245.2 (221.9–277.2) |
| V | 300.6 (251.8–348.9) | 386.4 (332.0–418.0) | 259.5 (224.1–300.4) |
| Only nonmetropolitan counties | |||
| I | 229.8 (198.8–266.9) | 288.6 (262.8–316.7) | 204.3 (182.0–227.7) |
| II | 250.4 (216.6–293.2) | 318.0 (285.1–349.4) | 223.6 (197.4–251.4) |
| III | 276.6 (238.5–321.4) | 343.4 (310.7–374.8) | 245.6 (216.9–275.2) |
| IV | 302.8 (261.6–350.0) | 371.3 (335.0–412.1) | 270.3 (232.5–304.2) |
| V | 322.2 (270.2–375.6) | 392.2 (340.6–435.5) | 289.1 (246.4–330.1) |
In this table we present the age‐adjusted median (interquartile range) cardiovascular mortality for each SVI group, for the whole 20‐year study period and in the time periods 2000 to 2003 and 2016 to 2019. SVI indicates Social Vulnerability Index.
Change in Cardiovascular Mortality During the Study Period
When comparing the age‐adjusted CVM between 2000 to 2003 and 2016 to 2019, we observed an overall relative reduction of 29.93% (IQR: −22.47 to 36.38) (Figure 2). In fact, most US counties reported a relative decline in the age adjusted CVM (Figure 3), whereas only 1.8% US counties reported an increase in the age‐adjusted CVM over this time period. The relative reduction in CVM was highest for counties belonging to SVI group I (32.2% [IQR: 24.2–38.4]) and lowest for those in group V (27.2% [IQR: 19–34.1]). Compared with the SVI group I, counties belonging to SVI groups IV (P<0.001) and V (P<0.001) had a significantly less improvement in their CVM rates over the study period (Table 4). The relative improvement in CVM was higher in women (32.1% [IQR: 23.4–39.1]) than men (29.7% [IQR: 36.2–21.4]) and this effect was observed across the SVI groups. Although Black residents had a higher overall age‐adjusted CVM when compared with White residents, they also had a higher relative percent reduction (31.3% [IQR: 21.2–39.1]) than White residents (29% [IQR: 21.3–35.4]) (P<0.001); this slight advantage for Black residents was also observed across the SVI groups.
Figure 2. Age‐adjusted cardiovascular mortality (CVM) in the counties in the United States.
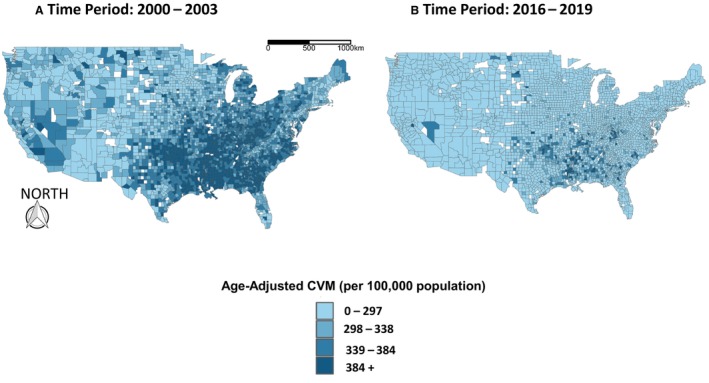
A, Age‐adjusted CMV (per 100 000) for the time period 2000 to 2003. B, Age‐adjusted cardiovascular mortality (per 100 000) for the time period 2016 to 2019. We observed that almost all counties (98.3%) reported a decline in their age‐adjusted CMV over this time.
Figure 3. The median percent relative change in age‐adjusted cardiovascular mortality (per 100 000) between 2000 to 2003 and 2016 to 2019 in counties in the United States.
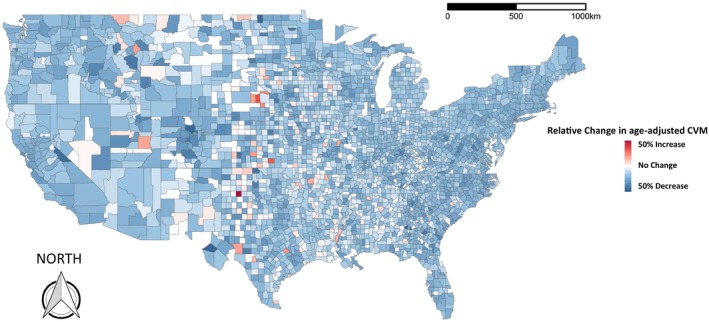
We observed a median percent relative decline of 29.93 (IQR: −22.47 to 36.38) overall in the United States. CVM indicates cardiovascular mortality; and IQR, interquartile range.
Table 4.
Relative Percentage Decline in the Age‐Adjusted Cardiovascular Mortality According to Social Vulnerability
| Social Vulnerability Index group | ||||
|---|---|---|---|---|
| Group I | Group II† | Group III† | Group IV† | Group V† |
| All residents in all studied counties | ||||
| 32.2 [24.2–38.4] | 31.2 [24.4–37.0] | 30.5 [23.7–37.1] | 28.5 [21.5–34.8]* | 27.2 [19.0–34.1]* |
| Only women in all studied counties | ||||
| 33.8 [23.5–40.9] | 32.5 [25.3–39.9] | 33.1 [25.2–39.2] | 30.4 [22.8–37.3]* | 30.2 [20.9–37.2]* |
| Only men in all studied counties | ||||
| 32.5 [24.7–39.0] | 31.2 [24.0–37.3] | 30.4 [22.7–36.5]* | 28.4 [19.9–34.3]* | 26.2 [17.3–33.8]* |
| Only Black residents in all studied counties | ||||
| 32.5 [23.0–42.8] | 34.1 [24.2–41.2] | 33.3 [24.3–41.2] | 32.6 [23.1–39.6] | 27.6 [18.8–36.3]* |
| Only White residents in all studied counties | ||||
| 31.4 [23.8–37.9] | 30.5 [23.8–36.3] | 29.4 [22.4–36.2] | 27.8 [20.3–33.8]* | 26.4 [18.0–32.5]* |
| Only metropolitan counties | ||||
| 34.7 [28.0–39.7] | 32.9 [28.62–37.72] | 33.51 [27.1–38.2] | 31.0 [24.0–35.8]* | 30.8 [24.0–36.0]* |
| Only nonmetropolitan counties | ||||
| 29.6 [20.6–37.6] | 28.8 [22.0–36.6] | 28.0 [22.0–35.2] | 26.7 [20.4–33.2]* | 25.7 [17.1–33.3]* |
This table presents the median [interquartile range] for the relative percentage decline in age‐adjusted cardiovascular mortality between 2000 to 2003 and 2016 to 2019 according to the county‐level Social Vulnerability Index (SVI).
P<0.001.
Each SVI group compared with group I using the Kruskal–Wallis test.
Social Vulnerability and the Differential Decline in Cardiovascular Mortality
A higher SVI index was associated with lower relative percent decline in the age‐adjusted CVM (model coefficient −3.11 [95% CI, −5.66 to −1.22]; P<0.001) (Table S1).
Compared with Black residents (model coefficient: −9.01 [95% CI, −5.61 to −12.40]), White residents (model coefficient −6.13 [95% CI, −7.52 to −4.73]) had a lower percent decline in age‐adjusted CVM (interaction P value <0.001). The association between the SVI and relative decline in the CVM was slightly higher for metropolitan counties (−5.44 [95% CI, −7.52 to −3.44]) than nonmetropolitan counties (−4.91 [95% CI, −6.85 to −2.97]), but this was not found to be statistically significant (P value for interaction 0.75). Compared with men (−3.59 [95% CI, −5.31 to −1.87]), women had a significantly higher association between the SVI and the percent relative decline in age‐adjusted CVM (−7.69 [95% CI, −8.31 to −5.07]) (interaction P value <0.001). However, the difference in the percent relative decline in the age‐adjusted CVM between men and women was higher with an increasing SVI (interaction P value <0.001) (Table S1). On visual inspection, we failed to observe substantial changes in the SVI for each US county (Figure S3), and the statistical correlation between the SVI difference (between 2010 and 2018) and the relative decrease in CVM mortality across counties was poor (correlation coefficient −0.009) (Figure S4).
Discussion
Overview of Findings
We examined 20 years (2000–2019) of county‐level data in the United States and showed that county‐level SDOH (as measured by the CDC's SVI) was associated with temporal changes in the age‐adjusted CVM. Counties that were more socially disadvantaged or economically marginalized had a higher overall age‐adjusted CVM and were observed to have less improvement in their CVM rates over the study period. This association between social vulnerability and CVM change was consistent irrespective of sex (men versus women), race (Black versus White), or location (metropolitan versus nonmetropolitan).
Results in Context
A prior study evaluated the longitudinal trajectory of county‐level CVM between 1980 and 2014. 3 They observed significant differences between counties, which they partly attributed to varying socioeconomic characteristics. A more recent study, using contemporary data (2009–2018), supported these observations and also reported an association between SDOH and temporal changes in CVM. 13 In our earlier study, we have demonstrated that social vulnerability is associated with premature CVM in the United States. 14 In the present analysis, we support our prior observations and expand it by evaluating results over a 20‐year timespan. These observations highlight the geographic, racial, and economic disparities in cardiovascular health across the United States and emphasize the need for the adoption of better preventive strategies, especially in socioeconomically deprived neighborhoods. Although other studies have used multiple individual SDoH metrics, we have used the SVI, a publicly available, rigorously developed SDOH composite score, to quantify the extent of county‐level social deprivation. Our observations mirror the results that prior studies have reported. It has been reported that different SDOH are often clustered with high correlation coefficients between values. 15 Therefore, both individual factors as well as a composite score such as the SVI have their own benefits. Hence, our study (that considers the SVI as a composite metric) and others (that model various components of the SVI individually) provide complementary information. We reported that the improvement in CVM was higher in Black than White residents. Prior research has demonstrated that, compared with White adults, the prevalence of traditional cardiovascular risk factors (hypertension, diabetes, obesity) and unhealthy behavior (smoking, a sedentary lifestyle) are higher among Black adults. Therefore, although our study is not designed to specifically investigate the reasons for these changes, we can surmise that improvement in the social vulnerability factors may have led to a larger absolute reduction in CVM among Black residents. This possibility further strengthens the message that interventions aimed at improving social and economic conditions in disadvantaged communities, such as increasing access to health care, reducing poverty, and improving education, will help reduce the attributable risk of social vulnerability on cardiovascular mortality. The recent COVID‐19 pandemic has further highlighted the substantial role that social vulnerability plays in determining health outcomes and the disproportionate impact of poor SDOH in Black individuals. 16 , 17 Although we did observe higher CVM improvement among Black compared with White residents, Black residents still had higher absolute CVM rates in the latter part of the study period than White residents. We similarly demonstrated that the percent decline in CVM rates was higher for women than men. Analysis from the Finnish nationwide Death Register mirrored these observations, with the risk of age‐adjusted CVM being 80% higher in men than women. 18 We also observed that nonmetropolitan counties had higher CVM rates and slightly lower improvement over time as compared with metropolitan ones, further underlining that social vulnerability is an important determinant of cardiovascular health in both rural and urban places. Both locations may, however, face different challenges and hence therefore location‐dependent targeted approaches are necessary to improve cardiovascular health across the entire spectrum of social vulnerability.
Strengths and Limitations
Our results should be understood on the background of certain limitations. The CDC WONDER obtains cause‐specific mortality using ICD codes obtained from information reported in death certificates; therefore, this may be subject to misclassification and coding errors. Although the SVI is available at the census tract level from the CDC, the smallest geographical unit data regarding CVM are available at the county level. Therefore, while the SVI may vary between census tracts in the same county, we were unable to report results at that smaller geographical unit. Thus, future work may attempt to identify mechanisms to report CVM at the census tract level. Although the SVI was selected as a single baseline value over the entire study period, we were able to demonstrate that a change in the SVI over time did not have any meaningful correlation with the observed CVM during the study period. Lastly, as the CDC does not provide information for counties with event counts <20, we were unable to examine data from all 3242 county and county equivalent regions in the United States.
Conclusions
In conclusion, in a nationwide county‐level US study, we reported that social vulnerability is associated with increased age‐adjusted CVM. Encouragingly, age‐adjusted CVM rates continue to decline in the United States; however, geographic, racial, and sex‐related disparities exist. As CVM rate reduction in the socially and economically marginalized counties is lagging, targeted policies are needed to address these gaps.
Sources of Funding
This work was partly funded by the National Institute on Minority Health and Health Disparities Award # P50MD017351
Disclosures
None.
Supporting information
Table S1
Figures S1–S4
Acknowledgments
The views expressed in this article are those of the authors. They do not represent the position or policy of the Department of Veteran Affairs or the United States Government.
This article was sent to Tiffany M. Powell‐Wiley, MD MPH, Associate Editor, for review by expert referees, editorial decision, and final disposition.
Supplemental Material is available at https://www.ahajournals.org/doi/suppl/10.1161/JAHA.123.030290
For Sources of Funding and Disclosures, see page 9.
References
- 1. Heart disease facts . Accessed February 24, 2023. https://www.cdc.gov/heartdisease/facts.htm
- 2. Mensah GA, Brown DW. An overview of cardiovascular disease burden In the United States. Health Aff (Millwood). 2007;26:38–48. doi: 10.1377/hlthaff.26.1.38 [DOI] [PubMed] [Google Scholar]
- 3. Rao S, Hughes A, Segar MW, Wilson B, Ayers C, Das S, Halm EA, Pandey A. Longitudinal trajectories and factors associated with US county‐level cardiovascular mortality, 1980 to 2014. JAMA Netw Open. 2021;4:e2136022. doi: 10.1001/jamanetworkopen.2021.36022 [DOI] [PMC free article] [PubMed] [Google Scholar]
- 4. 2013 ACC/AHA guideline on the assessment of cardiovascular risk: a report of the American College of Cardiology/American Heart Association Task Force on Practice Guidelines. Accessed September 1, 2022. https://pubmed.ncbi.nlm.nih.gov/24222018/
- 5. Sidney S, Quesenberry CP Jr, Jaffe MG, Sorel M, Nguyen‐Huynh MN, Kushi LH, Go AS, Rana JS. Recent trends in cardiovascular mortality in the United States and public health goals. JAMA Cardiol. 2016;1:594–599. doi: 10.1001/jamacardio.2016.1326 [DOI] [PubMed] [Google Scholar]
- 6. Pahigiannis K, Thompson‐Paul AM, Barfield W, Ochiai E, Loustalot F, Shero S, Hong Y. Progress toward improved cardiovascular health in the United States. Circulation. 2019;139:1957–1973. doi: 10.1161/CIRCULATIONAHA.118.035408 [DOI] [PMC free article] [PubMed] [Google Scholar]
- 7. CDC Wonder. Centers for Disease Control and Prevention. Accessed February 24, 2023. https://wonder.cdc.gov/
- 8. CDC/ATSDR SVI data and documentation download. Centers for Disease Control and Prevention/Agency for Toxic Substances and Disease Registry. Accessed February 24, 2023. https://www.atsdr.cdc.gov/placeandhealth/svi/data_documentation_download.html
- 9. Federal Information Processing System (FIPS) codes for states and counties. Federal Communications Commission. Accessed February 24, 2023. https://transition.fcc.gov/oet/info/maps/census/fips/fips.txt
- 10. Multiple cause of death 1999–2020. Centers for Disease Control and Prevention. Accessed February 24, 2023. https://wonder.cdc.gov/wonder/help/mcd.html
- 11. R Core Team . 2022. R: A language and environment for statistical computing, Vienna, Austria: R Foundation for Statistical Computing. Accessed September 1, 2022. https://www.R‐project.org/ [Google Scholar]
- 12. Pebesma E. Simple features for R: standardized support for spatial vector data. R J. 2018;10:439–446. doi: 10.32614/RJ-2018-009 [DOI] [Google Scholar]
- 13. Son H, Zhang D, Shen Y, Jaysing A, Zhang J, Chen Z, Mu L, Liu J, Rajbhandari‐Thapa J, Li Y, et al. Social determinants of cardiovascular health: a longitudinal analysis of cardiovascular disease mortality in US counties from 2009 to 2018. J Am Heart Assoc. 2023;12:e026940. doi: 10.1161/JAHA.122.026940 [DOI] [PMC free article] [PubMed] [Google Scholar]
- 14. Khan SU, Javed Z, Lone AN, Dani SS, Amin Z, Al‐Kindi SG, Virani SS, Sharma G, Blankstein R, Blaha MJ. Social vulnerability and premature cardiovascular mortality among US counties, 2014 to 2018. Circulation. 2021;144:1272–1279. doi: 10.1161/CIRCULATIONAHA.121.054516 [DOI] [PubMed] [Google Scholar]
- 15. Schiltz NK, Chagin K, Sehgal AR. Clustering of social determinants of health among patients. J Prim Care Community Health. 2022;13:21501319221113544. doi: 10.1177/21501319221113543 [DOI] [PMC free article] [PubMed] [Google Scholar]
- 16. Motairek I, Janus SE, Hajjari J, Nasir K, Khan SU, Rajagopalan S, Al‐Kindi S. Social vulnerability and excess mortality in the COVID‐19 era. Am J Cardiol. 2022;172:172–174. doi: 10.1016/j.amjcard.2022.03.011 [DOI] [PMC free article] [PubMed] [Google Scholar]
- 17. Janus SE, Makhlouf M, Chahine N, Motairek I, Al‐Kindi SG. Examining disparities and excess cardiovascular mortality before and during the COVID‐19 pandemic. Mayo Clin Proc. 2022;97:2206–2214. doi: 10.1016/j.mayocp.2022.07.008 [DOI] [PMC free article] [PubMed] [Google Scholar]
- 18. Mikkola TS, Gissler M, Merikukka M, Tuomikoski P, Ylikorkala O. Sex differences in age‐related cardiovascular mortality. PLoS One. 2013;8:e63347. doi: 10.1371/journal.pone.0063347 [DOI] [PMC free article] [PubMed] [Google Scholar]
Associated Data
This section collects any data citations, data availability statements, or supplementary materials included in this article.
Supplementary Materials
Table S1
Figures S1–S4
Data Availability Statement
All data and code for this study are available at https://github.com/svd09).