

Abstract
Objectives
The objectives of this study were to investigate the pathophysiology of Kawasaki disease (KD) from immunological and oxidative stress perspectives, and to identify real‐time biomarkers linked to innate immunity and oxidative stress in KD.
Methods
We prospectively enrolled 85 patients with KD and 135 patients with diverse conditions including immune, infectious and non‐infectious diseases for this investigation. Flow cytometry was used to analyse the surface expression of CD14, CD38 and CD62L on monocytes, along with a quantitative assessment of CD14 down‐modulation. Additionally, oxidative stress levels were evaluated using derivatives of reactive oxygen metabolites (d‐ROMs) and antioxidant capacity measured by a free radical elective evaluator system.
Results
During the acute phase of KD, we observed a prominent CD14 down‐modulation on monocytes, reflecting the indirect detection of circulating innate immune molecular patterns. Moreover, patients with KD showed a significantly higher CD14 down‐modulation compared with infectious and non‐infectious disease controls. Notably, the surface expression of CD14 on monocytes was restored concurrently with responses to intravenous immunoglobulin and infliximab treatment in KD. Furthermore, d‐ROM levels in patients with KD were significantly elevated compared with patients with infectious and non‐infectious diseases. Following intravenous immunoglobulin treatment, oxidative stress levels decreased in patients with KD.
Conclusion
Monitoring CD14 down‐modulation on monocytes in real‐time is a valuable strategy for assessing treatment response, distinguishing KD relapse from concomitant infections and selecting second‐line therapy after IVIG treatment in KD patients. The interplay between inflammation and oxidative stress likely plays a crucial role in the development of KD.
Keywords: CD14, innate immunity, Kawasaki disease, oxidative stress
CD14 interacts with a diverse array of pathogen‐associated molecular patterns (PAMPs) and damage‐associated molecular patterns (DAMPs). Subsequently, the CD14‐toll‐like receptors (TLRs)‐ligand complex undergoes internalisation, resulting in reduced CD14 expression on the monocyte surface. The present results provide support that Kawasaki disease (KD) is one of the PAMPs/DAMPs‐associated diseases, and suggest that inflammation and oxidative stress work together complementarily to the development of systemic vasculitis in KD. Real‐time monitoring of CD14 expression on monocytes would be beneficial for managing KD.

Introduction
Kawasaki disease (KD) is an acute systemic vasculitis predominantly affecting the coronary arteries in early childhood. Since its first description of KD in 1967, the pathogenesis has been unclear. 1 The diagnosis of KD relies on clinical criteria and the exclusion of other similar diseases, and no pathognomonic symptoms or specific laboratory tests are available for diagnosis. 1 , 2
In light of the pathophysiology of acute KD, 2 we have focused on biomarkers linked to innate immunity. No universal pathogen‐associated molecular patterns (PAMPs) have been detected in KD. 3 Damage‐associated molecular patterns (DAMPs), such as high mobility group box protein 1 (HMGB1), oxidised phospholipids and S100A protein, and soluble pattern recognition molecules, in blood 4 hold potential as ubiquitous biomarkers. However, these biomarkers are primarily experimental and difficult to detect in real time. Among the five common cellular pattern recognition receptors (PRRs), toll‐like receptors (TLRs) and TLR coreceptor CD14 mRNAs were found to be up‐regulated in KD, while surface expression of TLR2, but not TLR4, was augmented on monocytes in KD. 5 TLR4 stimulation with PRR ligands such as lipopolysaccharides (LPS) up‐regulates TLR4 mRNA but down‐regulates surface TLR4 expression, probably by increasing its internalisation. In contrast, cytokine stimulation up‐regulates both mRNA and protein levels of TLR4. 6 Therefore, surface TLR4 levels on monocytes may depend on the balance between ligand and cytokine levels in the surrounding environment. This suggests that TLR levels may not be suitable as diagnostic biomarkers for KD.
CD14 serves as a coreceptor of PRRs and binds to a broad spectrum of PAMPs and DAMPs, in concert with TLR1/TLR2, TLR2/TLR6, TLR4 and TLR9. 7 The CD14‐TLR‐ligand complex is internalised, resulting in a decrease of CD14 expression on the monocyte surface and innate immune activation. Another important molecule, CD36, is a highly glycosylated class B scavenger receptor that contributes to the recognition of DAMPs such as oxidised low‐density lipoprotein (LDL) and PAMPs (lipoteichoic acid, lipoprotein, and many others). 7 CD36 expression levels have been associated with the development of coronary artery lesions (CALs) in KD. 8 Additionally, we have investigated the role of CD62L (L‐selectin), which is present on the inflammatory phenotype of monocytes as well as on expanded monocytes in KD and is involved in leukocyte–endothelial cell adhesion events. 9
Oxidative stress plays a critical role in the development of KD in conjunction with inflammation. 10 , 11 , 12 Environmental pollutants induce oxidative stress by upregulating reactive oxygen species (ROS) levels. Elevated ROS result in the oxidation of low‐density lipoprotein (LDL), generating DAMPs. Additionally, ROS trigger the particular inflammasome pathway‐mediated pyroptosis, 13 releasing considerable amounts of DAMPs. In our pursuit of understanding the association between oxidative stress and PAMPs/DAMPs‐interacting molecules, we further assessed blood levels of derivatives of reactive oxygen metabolites (d‐ROMs) and biological antioxidant potential (BAP) in KD patients. This study aims to provide insights into KD pathophysiology from immunological and oxidative stress perspectives and explore the feasibility of real‐time biomarkers.
Results
CD14 down‐modulation in KD
We conducted a prospective analysis of peripheral blood monocytes utilising flow cytometry, with a focus on CD62L+ CD14+ monocytes, which are recognised as representing an inflammatory phenotype. 9 In this study, we quantitatively assessed CD14 down‐modulation (CD14+ region B/CD14++ region A ratio), as shown in Supplementary figures 1 and 2. Prominent CD14 down‐modulation (high B/A ratio) was evident in immune disorders A, which serves positive controls 1 (PC1) such as juvenile idiopathic arthritis (JIA) and multisystem inflammatory syndrome in children (MIS‐C). Conversely, immune disorders B, encompassing JIA in remission and autoimmune diseases like immune thrombocytopenic purpura (ITP), did not display such CD14 down‐modulation. Furthermore, positive controls 2 (PC2), including febrile seizure (FS), exhibited conspicuous CD14 down‐modulation in non‐coronavirus disease 2019 (COVID‐19)‐associated FS but not in COVID‐19‐associated FS. Patients with KD showed prominent CD14 down‐modulation, just like PC1 and PC2 (Figure 1). The CD14 B/A ratio (CD14 down‐modulation) and the median fluorescence intensity of CD36 in patients with KD were significantly higher (P < 0.001 and P = 0.013, respectively) than those in disease controls (DC) (Figure 1, Supplementary table 2a). Hence, CD14 down‐modulation potentially provides a means to distinguish KD from infectious diseases, but not from innate immune disorders such as JIA.
Figure 1.
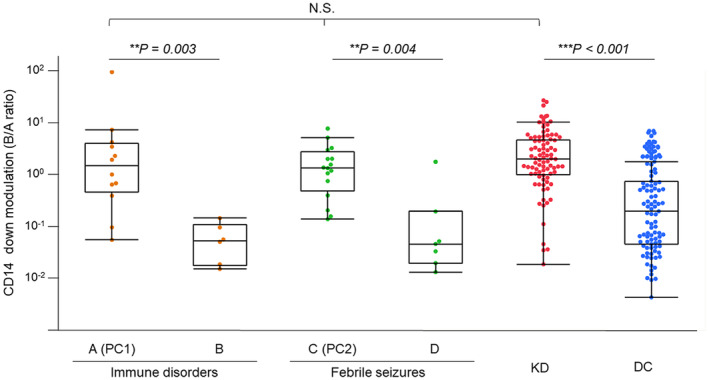
CD14 down‐modulation in Kawasaki disease and various controls. CD14 down‐modulation of monocytes (CD14 B/A ratio) was compared among KD and various controls. Immune disorders A included active phase of innate immune disorders as positive controls 1 (PC1: n = 12), and immune disorders B: autoimmune diseases and inactive phase of innate immune disorders (n = 6). C: non‐COVID‐19‐associated FS as positive controls 2 (PC2: n = 16) and D: COVID‐19‐associated FS (n = 7). KD: n = 85, DC included infectious and other diseases: n = 94. Significant differences were determined by the Wilcoxon signed‐rank test. **P < 0.01, ***P < 0.001. COVID‐19, coronavirus disease 2019; DC, disease control; FS, febrile seizure; KD, Kawasaki disease; N.S., not significant; PC, positive controls.
In KD patients undergoing initial treatment with intravenous immunoglobulin (IVIG), we investigated the temporal dynamics of CD14 modulation. Three response patterns were observed in patients with KD: (1) favourable response to initial IVIG (n = 30); (2) IVIG resistance initially (transient recrudescent fever) with subsequent positive response to a second IVIG (n = 4); and (3) IVIG resistance with ongoing fever (n = 4) (Figure 2). In responders to initial IVIG, the CD14B/A ratio (median: 1.89, interquartile range: IQR: 0.63–3.04) at the acute phase before IVIG rapidly declined to 0.10 (median, IQR: 0.04–0.68) after IVIG (P < 0.001, Wilcoxon's signed‐rank test; Figure 2a, Supplementary figure 3a). IVIG‐resistant KD patients with recrudescent fever exhibited patterns similar to those of IVIG‐responsive KD patients, both pre‐first IVIG and post‐first/pre‐second IVIG (Figure 2b). This observation suggests that KD patients with transient recrudescent fever did not maintain elevated PAMPs/DAMPs levels following the first IVIG administration. Conversely, four IVIG‐resistant patients with persistent fever showed high CD14B/A ratios (median: 5.45, IQR: 2.56–10.89) after the initial IVIG and before the second IVIG, and three of the four patients responded to the second IVIG (Figure 2c). In a patient who responded to the second IVIG (Supplementary figure 3b), the CD14B/A ratio decreased from 12.25 to 0.05, while the CD14B/A ratio remained high in a non‐responder to the second IVIG (Supplementary figure 3c). For non‐responders to a second IVIG, we used infliximab (IFX) as a third‐line therapy. In such a patient, the CD14B/A ratios remained as high as 1.15 after the second IVIG; however, the ratio decreased to 0.04 following IFX treatment (Supplementary figure 3c). Notably, steroid administration did not exert discernible influence on the CD14 B/A ratio. Consequently, CD14 down‐modulation emerged as a reflective indicator of KD activity and the responsiveness to both IVIG and IFX treatments.
Figure 2.
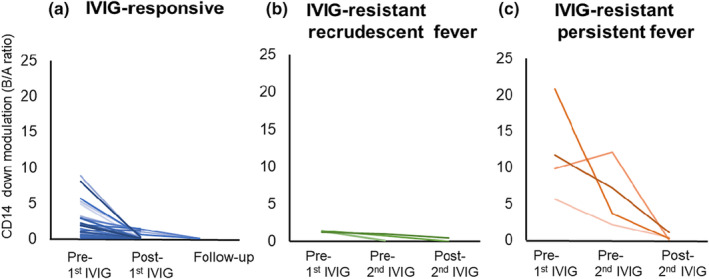
Temporal dynamics of CD14 modulation in IVIG‐responsive and ‐resistant patients with Kawasaki disease. KD patients were divided into three groups: (a) initial IVIG‐responsive KD (n = 30), (b) IVIG‐resistant KD patients with recrudescent fever after the initial IVIG, who responded to the second IVIG (n = 4) and (c) IVIG‐resistant patients with persistent fever (n = 4). Three of the four responded to the second IVIG. In initial IVIG responders (n = 30), high CD14 down‐modulation (high B/A ratios) rapidly decreased after the first treatment with IVIG (P < 0.001). IVIG, intravenous immunoglobulin; KD, Kawasaki disease.
Among 85 patients with KD, 12 (14%) showed CD14B/A ratios ≤ 0.607 (Supplementary table 3). These 12 patients with KD demonstrated significantly younger ages and lower serum levels of C‐reactive protein (CRP), procalcitonin (PCT) and ferritin than the 73 KD patients with CD14B/A ratios > 0.607 (Supplementary table 4). Notably, 10 out of these 12 KD patients demonstrated clinical features such as age at onset of KD < 6 months, low CRP or PCT levels, and atypical presentation of KD symptoms and signs. While three of the 12 displayed transient CALs, no CALs were found after 1 month (Supplementary table 3).
Oxidative stress in KD
Patients with KD exhibited significantly higher d‐ROM levels and oxidative stress index (OSI: dROMs/BAP) compared with DC, while BAP levels were significantly lower in patients with KD (Figure 3a, Supplementary table 2b). After IVIG treatment, OSI and d‐ROM levels significantly decreased, accompanied by a substantial increase in BAP levels (Figure 3b, d‐ROMs: 458 U. CARR [354–570] vs. 403 U. CARR [248–457], P = 0.021, BAP: 2379 μmol L−1 [2213–2517] vs. 2598 μmol L−1 [2378–2720], P = 0.002), indicating the presence of oxidative stress in acute KD before IVIG therapy.
Figure 3.
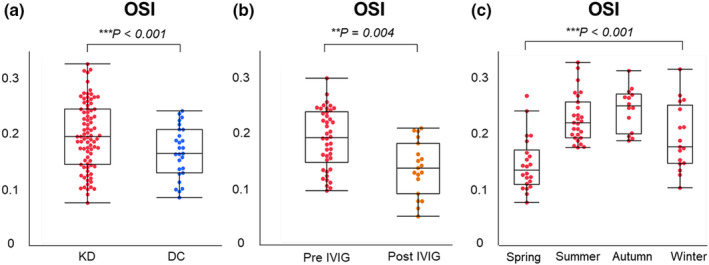
Oxidative stress index in patients with Kawasaki disease and disease controls. (a) OSI (d‐ROM/BAP) in patients with KD (n = 80) vs. DC (n = 38), as shown in Supplementary table 2b. (b) OSI in the acute phase of KD patients (pre‐IVIG: n = 80) and after treatment with IVIG (post‐IVIG: n = 20). OSI: 0.191 [0.147–0.240] vs. 0.147 [0.101–0.189], P = 0.004. (c) Comparison among the 4‐season groups. Significant differences were determined by the analysis of variance. **P < 0.01, ***P < 0.001. BAP, biological antioxidant potential; DC, disease control; d‐ROM, derivatives of reactive oxygen metabolites; IVIG, intravenous immunoglobulin; KD, Kawasaki disease; OSI, oxidative stress index.
Based on the d‐ROM levels at the acute phase of KD, we categorised 80 patients, of whom sera before IVIG were available for oxidative stress studies, into the following four subgroups: Quartile 1 (Q1, ≤ 354 Carr U), Q2 (> 354 to ≤ 458), Q3 (> 458 to ≤ 570) and Q4 (> 570) (Table 1). Among the clinical data herein analysed, initial and maximal CRP concentrations and the presence of CAL at 1 month showed inverse correlations with higher quartiles of initial d‐ROMs (one‐way ANOVA, Table 1). Similarly, the initial d‐ROM levels in KD patients were inversely correlated with initial and maximal CRP and initial and maximal N‐terminal pro‐B‐type natriuretic peptide (NT‐pro‐BNP) concentrations (Supplementary table 5).
Table 1.
Characteristics of patients with KD based on the quartile of initial d‐ROMs
| Quartile 1 | Quartile 2 | Quartile 3 | Quartile 4 | P‐value | |
|---|---|---|---|---|---|
| ≤ 354 Carr U (n = 20) | > 354 to ≤ 458 Carr U (n = 20) | > 458 to ≤ 570 Carr U (n = 20) | > 570 Carr U (n = 20) | ||
| Age, months | 23 (7–37) | 30 (7–49) | 24 (6–33) | 22 (10–33) | 0.882 |
| Male sex | 9 (45%) | 10 (50%) | 7 (35%) | 7 (35%) | 0.707 |
| Seasons | |||||
| Winter/Spring | 20 (100%) | 9 (45%) | 4 (20%) | 6 (30%) | < 0.001 |
| Summer/Autumn | 0 (0%) | 11 (55%) | 16 (80%) | 14 (70%) | |
| Symptoms | |||||
| Fever | 20 (100%) | 20 (100%) | 20 (100%) | 20 (100%) | 1.000 |
| Fever duration, days | 5 (4–6) | 5 (4–6) | 5 (4–8) | 5 (4–6) | 0.683 |
| Conjunctivitis | 18 (90%) | 17 (85%) | 19 (95%) | 19 (95%) | 0.641 |
| Erythematous lips | 19 (95%) | 18 (90%) | 20 (100%) | 20 (100%) | 0.200 |
| Polymorphous rush | 20 (100%) | 18 (90%) | 19 (95%) | 19 (95%) | 0.411 |
| Changes in the extremities | 19 (95%) | 20 (100%) | 17 (85%) | 16 (80%) | 0.135 |
| Cervical lymphadenopathy | 16 (80%) | 16 (80%) | 15 (75%) | 16 (80%) | 0.975 |
| Erythema of the BCG scar | 7 (35%) | 6 (30%) | 8 (40%) | 15 (75%) | 0.018 |
| Atypical clinical course | 1 (5%) | 1 (5%) | 2 (10%) | 1 (5%) | 0.901 |
| IVIG resistant | 4 (20%) | 5 (25%) | 5 (25%) | 3 (15%) | 0.838 |
| WBC, 109 L−1 | 13.4 (8.9–19.7) | 13.7 (10.3–16.0) | 13.5 (10.9–15.7) | 13.2 (11.6–15.1) | 0.982 |
| Haemoglobin, g L−1 | 112 (106–118) | 115 (109–124) | 123 (115–128) | 118 (110–120) | 0.004 |
| Platelet count, 109 L−1 | 362 (275–415) | 338 (258–400) | 306 (243–380) | 409 (341–440) | 0.029 |
| TB, μmol L−1 | 12.0 (6.9–17.1) | 8.6 (6.8–13.7) | 10.3 (8.6–18.8) | 8.6 (6.9–10.3) | 0.038 |
| CRP, mg L−1 | 85.8 (70.2–121.6) | 49.8 (25.1–82.9) | 46.8 (29.7–90.1) | 62.4 (42.4–92.7) | 0.037 |
| Maximal CRP, mg L−1 | 101.9 (75.5–132.1) | 49.8 (25.1–82.9) | 47.7 (35.7–104.5) | 62.4 (42.4–92.7) | 0.016 |
| PCT, μg L−1 | 1.05 (0.19–2.73) | 0.25 (0.12–1.05) | 0.39 (0.21–1.96) | 0.37 (0.11–1.13) | 0.164 |
| NT‐pro‐BNP, pmol L−1 | 57 (14–572) | 20 (12–51) | 52 (24–96) | 59 (19–107) | 0.166 |
| Maximal NT‐pro‐BNP, pmol L−1 | 90 (41–1059) | 82 (23–121) | 76 (52–146) | 63 (41–98) | 0.313 |
| CALs during acute phase | 4 (20%) | 3 (15%) | 3 (15%) | 1 (5%) | 0.459 |
| CALs at 1 month | 4 (20%) | 0 (0%) | 0 (0%) | 1 (5%) | 0.034 |
| CD14 modulation (B/A ratio) | 3.4 (0.9–5.2) | 1.6 (0.8–5.0) | 1.8 (1.0–2.9) | 1.8 (1.0–4.3) | 0.777 |
| CD36 intensity | 138 369 (109628–166 263) | 120 981 (104097–154 042) | 147 820 (111479–194 327) | 132 764 (96170–163 078) | 0.593 |
| CD62L intensity | 99 320 (16240–239 436) | 52 129 (43312–94 813) | 62 861 (36506–165 014) | 63 833 (42953–94 881) | 0.845 |
| d‐ROMs, Carr U | 281 (245–315) | 419 (401–438) | 499 (484–535) | 628 (582–679) | < 0.001 |
| BAP, μmol L−1 | 2220 (2038–2490) | 2393 (2243–2516) | 2355 (2231–2566) | 2412 (2261–2503) | 0.365 |
| OSI (d‐ROMs/BAP ratio) | 0.12 (0.10–0.14) | 0.17 (0.16–0.19) | 0.21 (0.20–0.23) | 0.26 (0.24–0.31) | < 0.001 |
BAP, biological antioxidant potential; BCG, Bacillus Calmette‐Guérin; CALs, coronary artery lesions; CRP, C‐reactive protein; d‐ROMs, derivatives of reactive oxygen metabolites; IQR, interquartile range; KD, Kawasaki disease; NT‐pro‐BNP, N‐terminal pro‐brain natriuretic peptide; OSI, oxidative stress index; PCT, procalcitonin; TB, total bilirubin; WBC, white blood cell.
Data are expressed as median (interquartile range, IQR) or number (%).
Receiver operating characteristic analysis for evaluating immunological and oxidative stress markers
The observed down‐modulation of CD14 signifies the presence of active PAMPs/DAMPs in the circulatory milieu. In line with this notion, we obtained the highest area under the curve (AUC) value of 82% in distinguishing KD from DC when we set a cut‐off level of CD14B/A at 0.607 (Supplementary table 2). These findings validate that CD14B/A is the most useful parameter for accurately diagnosing KD among the parameters in this study. We confirmed that a combined receiver operating characteristic (ROC) analysis using two parameters, CD14 down‐modulation and OSI, did not yield an augmented AUC value in KD patients (Supplementary table 2b).
As oxidative stress (d‐ROMs and OSI) levels were significantly different across seasons (P < 0.001) (Figure 3c, Supplementary figure 4), and the admission seasons for KD, winter/spring or summer/autumn, were significantly associated with the quartiles of d‐ROMs (P < 0.001) (Table 1), optimal cut‐off values for KD diagnosis were compared using CD14B/A ratio among KD patients admitted during all seasons, winter/spring and summer/autumn. KD patients admitted during winter/spring exhibited a superior AUC (0.86) compared with those admitted during all seasons (0.82) or summer/autumn (0.74) (Supplementary figure 5), suggesting potential variation in KD triggers contingent upon seasonal influences.
Discussion
During the acute phase of KD, we found a prominent down‐regulation of CD14 surface expression on monocytes, similar to the findings observed in JIA and FS. The pathogenesis of both JIA and FS is linked to augmented circulating DAMPs and ensuing activation of the innate immune system. 14 , 15 A less pronounced CD14 down‐modulation in COVID‐19‐associated FS may be as a result of the neurotropic nature of the causative virus. 16 Additionally, CD14 surface expression was more markedly downregulated in patients with KD compared to those with infectious diseases. A decrease in the surface expression of CD14 was previously reported to coincide with the abundant expression of CD14 mRNA in monocytes of patients with KD. 17 However, no further information was therein provided. We have recently reported elevated levels of HMGB1 and oxidised phospholipids in serum samples from patients with KD during the acute phase. 18 , 19 These findings support the notion that KD represents one of the innate immune disorders associated with PAMPs and DAMPs.
The decrease in CD14 surface expression on monocytes was restored in parallel with responses of KD patients to the treatment with IVIG and IFX. Notably, corticosteroids exhibited minimal impact on CD14 down‐modulation, indicating their potentially limited role in clearing PAMPs and DAMPs from the bloodstream during the acute KD. Thus, the downward modulation of CD14 expression provides a reliable index for real‐time monitoring of circulating PAMPs/DAMPs during the acute KD. This index should be particularly useful when physicians need to determine whether patients are under an IVIG‐ or IFX‐resistant condition, whether patients experienced relapsing events or concomitant infections with KD, and whether patients need additional therapies. This study noted a relatively high IVIG‐resistance rate of 20.0%, albeit lower than the 24.4% documented in the 27th nationwide survey involving Japanese KD patients between 2021 and 2022. 20 Therefore, predicting treatment response based on this index could provide valuable information for managing IVIG‐resistant KD patients. Among a subset of KD patients (12 out of 85, 14.1%), only marginal CD14 down‐modulation on monocytes was evident. Within this subgroup, 10 patients exhibited KD onset at an age younger than 6 months, along with low CRP or PCT levels, and an atypical presentation of KD symptoms. These findings suggest the contribution of maternal (transplacental) or self‐generated antibodies to the milder clinical phenotypes within this age category.
Regarding oxidative stress, KD patients with the lowest quartile (Q1) of d‐ROM levels exhibited the highest initial and maximal CRP levels, the most pronounced median value of CD14 down‐modulation, and the most frequent occurrence of CALs at 1 month across all quartile groups. This observation aligns with prior research demonstrating an association between low d‐ROM levels and CAL development. 21 Since d‐ROMs and CRP/CD14 down‐modulation are fundamentally different in nature, we propose that inflammation and oxidative stress complementarily contribute to the development of KD. In addition, a significant seasonal variation in OSI was observed. This variation could be attributed to seasonal fluctuations in air pollution (particulate matter) and ultraviolet radiation, both of which are known inducers of oxidative stress. 22
Our study had several limitations. Firstly, this prospective study solely encompassed patients and controls within a single institute. Secondly, the participants were limited to individuals of Japanese ethnicity. Thirdly, we recruited only a small number of patients who poorly responded to IVIG. Reproducible data from other ethnicities will further validate our findings in future cohorts.
In conclusion, our data suggest that KD is one of the innate immune diseases associated with PAMPs/DAMPs. Real‐time monitoring of CD14 modulation on monocytes could be a useful strategy to assess treatment response, perform differential diagnosis and select second‐ or third‐line therapies after IVIG in patients with KD, especially in infants older than 6 months of age. We suggest that systemic inflammation and oxidative stress work together complementarily, leading to the development of KD in genetically susceptible children.
Methods
Subjects
This study enrolled a total of 220 Japanese patients admitted to Fukuoka Children's Hospital between December 2021 and December 2022 (Supplementary table 1) after obtaining institutional review board approval (#1322). Written informed consent was obtained from all guardians and/or patients. Supplementary figure 6 shows a flowchart that illustrates the participant selection protocol. The study subjects included 85 patients with KD (median age, 23 months; range 1–91 months; male/female, 51/34), 18 patients with immune disorders A and B (median age, 64 months; range 2–174 months; male/female, 14/4), 23 patients with FS including 16 with non‐ COVID‐19‐associated FS (median age, 13.5 months; range 9–85 months; male/female, 9/7), 7 with COVID‐19‐associated FS (median age, 28 months; range 15–79 months; male/female, 3/4) and 94 DC with infectious and other diseases (median age, 19.5 months; range 0–168 months; male/female, 62/32). Immune disorders A included JIA, MIS‐C, histiocytic necrotising lymphadenitis (Kikuchi‐Fujimoto disease), infection‐associated pancytopenia resembling secondary hemophagocytic lymphohistiocytosis/macrophage activation syndrome and tumour necrosis factor receptor‐associated periodic syndrome, which served as PC1. Immune disorders B included JIA in remission, ITP, immunoglobulin (Ig)A vasculitis and hypogammaglobulinemia. Immune disorders A and non‐COVID‐19‐associated FS served as PC1 and PC2, respectively. These PC1 and PC2 were previously associated with increased serum levels of DAMPs, 14 , 23 , 24 , 25 and/or innate immunity was believed to be mainly involved in the pathophysiology. 26 , 27 DC included a variety of infectious (n = 85) and non‐infectious (n = 9) diseases, as shown in Supplementary table 1.
The diagnosis of KD was made according to the Japanese Diagnostic Guidelines for KD. 28 CALs were defined as a maximum internal diameter Z score ≥ 2.5, as measured by echocardiography. Most KD patients received oral aspirin (30 mg kg−1 per day) and 2 g kg−1 of IVIG as the initial treatment. To study the seasonality of KD, we defined four seasons from the Japanese climate: spring (March, April and May), summer (June, July and August), autumn (September, October and November) and winter (December, January and February).
IVIG‐resistant KD was defined as any of the following: (1) Persistent fever of any magnitude 24–36 h after completion of initial IVIG therapy, (2) Return of fever of any magnitude after an afebrile period not explained by any cause other than KD (up to 2 weeks after the start of treatment) and (3) Other signs of failed initial therapy, such as progressive coronary artery dilation or other manifestations of inflammation associated with KD. 29
Flow cytometry
Flow cytometry was performed within 12 h after blood sampling using a DxFLEX B4‐R2‐V0 Flow Cytometer (Beckman Coulter, Inc., Tokyo, Japan). Forward scatter and side scatter gates were set to capture the cell populations, including monocytes. Debris fractions were excluded to eliminate aberrant binding events because of dead cells. 30 Data were analysed using Kaluza software (Beckman Coulter, Brea, CA, USA). The following antibodies were used: mouse anti‐CD14 (61D3) IgG1 isotype monoclonal antibody APC‐labelled and mouse control monoclonal antibody IgG1 isotype APC from Thermo Fisher Scientific, Tokyo, Japan. Mouse anti‐CD36 (FA6.152) IgG1 isotype monoclonal antibody FITC, anti‐CD16 (3G8) IgG1 isotype monoclonal antibody FITC, mouse control monoclonal antibody IgG1 isotype FITC, mouse anti‐CD62L (DREG56) IgG1 isotype monoclonal antibody PE and mouse control monoclonal antibody IgG1 isotype PE from Beckman Coulter.
Blood samples were collected in ethylenediaminetetraacetic acid from both patients and controls. Whole blood samples were stained with appropriate quantities of antibody cocktails in the dark at room temperature for 15 min. Erythrocytes were then lysed by VersaLyse (Beckman Coulter, Inc., Tokyo, Japan). After a 10‐min incubation, the cells were mixed well and washed by centrifugation (400 × g, 5 min). Cells were suspended in phosphate‐buffered saline and then analysed.
Monocytes in peripheral blood were analysed by flow cytometry. Monocytes were gated on the forward and side scatter plots of erythrocyte‐lysed whole blood (Supplementary figure 1a). Based on CD62L and CD14 expression, CD62L+ CD14+/++ monocytes (Q1; Supplementary figure 1b) were targeted for analysis. Such monocytes were divided into two subsets: CD62L+ CD14++ (region A) and CD62L+ CD14+ (region B), as shown in Supplementary figure 1c. CD14A was defined as the region that contained more than 95% of monocytes from afebrile controls based on CD14 intensity (CD62L+ CD14++), and CD14B as the region that contained CD62L+ CD14+ monocytes but not CD14dim+ monocytes (Supplementary figure 1c and d). CD14 down‐modulation was defined as a CD14B/CD14A ratio (B/A ratio). CD62L+ CD14++/+ monocytes included both classical (CD16− CD14++/+) and intermediate (CD16+ CD14++/+) monocytes (Supplementary figure 2), while CD62L+ CD14dim+ monocytes (Q2; Supplementary figure 1b) contained most non‐classical (CD16+ CD14dim+) monocytes (Supplementary figure 2). 31
Measurement of oxidative stress markers and antioxidant capacity
Derivatives of reactive oxygen metabolites (d‐ROMs) and biological antioxidant potential (BAP) were measured using a free radical elective evaluator system (FREE Carpe Duo; Wismerll Co. Ltd., Tokyo, Japan) with a kit for d‐ROM and BAP testing (Wismerll Co., Ltd.). Serum samples for the assay were separated by centrifugation and stored at −30°C until analysis. 32 Each serum sample (20 μL) was placed in a cuvette filled with buffer (pH 4.8). The cuvette was then turned upside down and agitated. Fe2+ and Fe3+ served as catalysts, resulting in the degradation of blood hydroperoxide into alkoxy and peroxy radicals. A colour‐developing chromogen was then added in a volume of 20 μL, resulting in oxidation of the chromogen substrate by the free radicals to yield a red‐coloured radical cation. The cuvette was once again turned upside down and agitated and then placed in a photometer for optical measurement of d‐ROMs. A chromogen for BAP (a reagent containing trivalent iron, 50 μL) was added to the cuvette to induce red coloration. The cuvette was turned upside down, and the colour intensity was measured using a photometer. Each serum sample (10 μL) was then placed into a cuvette and agitated. The cuvette was then placed in a thermostatically controlled chamber for 5 min. Finally, the cuvette was placed into the photometer for optical measurement of BAP. Oxidative stress index (OSI) was calculated from d‐ROMs and BAP.
Molecular diagnosis of COVID‐19
A multiplex polymerase chain reaction (PCR) assay (BIOFIRE® FILMARRAY® Torch system, Respiratory Panel 2.1; BioMerieux Japan, Tokyo, Japan) was applied to all patients with fever or respiratory symptoms upon admission. This panel covers 22 pathogens including severe acute respiratory syndrome coronavirus‐2 (SARS‐CoV‐2). A diagnosis of COVID‐19 was further confirmed by GeneXpert® System and Xpert® Xpress SARS‐CoV‐2 (Beckman Coulter, Inc., Tokyo, Japan).
Statistical analysis
The Wilcoxon test was used to analyse continuous variables, and the chi‐squared test was used for categorical variables. A Kruskal–Wallis test was used to compare parameters among three or more groups. A P‐value of < 0.05 was considered statistically significant. ROC analysis was employed to determine the optimum cut‐off value for KD diagnosis (sensitivity, specificity and AUC). All statistical analyses were conducted using JMP Pro software (Version 17; SAS Institute, Cary, NC, USA).
Author contributions
Yutaro Inada: Data curation; investigation; writing – original draft. Motoshi Sonoda: Formal analysis; investigation; writing – original draft. Yumi Mizuno: Data curation; investigation. Kenichiro Yamamura: Formal analysis; investigation; writing – original draft. Yoshitomo Motomura: Investigation; writing – original draft. Aoba Takuma: Data curation; validation. Kenji Murata: Data curation; validation. Kenji Furuno: Data curation; validation. Junichiro Tezuka: Data curation; validation. Yasunari Sakai: Supervision; writing – review and editing. Shouichi Ohga: Supervision; writing – review and editing. Junji Kishimoto: Formal analysis. Koki Hosaka: Investigation. Satomi Sakata: Investigation. Toshiro Hara: Conceptualization; project administration; writing – original draft; writing – review and editing.
Conflict of interest
The authors declare no conflict of interest.
Supporting information
Supplementary figures S1–S5
Supplementary tables S1–S3
Acknowledgments
We thank all the staff of Fukuoka Children's Hospital who cared for patients in this study. This study was supported by the Fukuoka Children's Hospital Research Fund to YMi and TH. This funding source had no roles in the study design; in the collection, analysis and interpretation of data; in the writing of the report; and in the decision to submit the paper for publication.
Data availability statement
The datasets generated during the current study are available from the corresponding author upon reasonable request.
References
- 1. Burgner D, Harnden A. Kawasaki disease: what is the epidemiology telling us about the etiology? Int J Infect Dis 2005; 9: 185–194. [DOI] [PMC free article] [PubMed] [Google Scholar]
- 2. Hara T, Nakashima Y, Sakai Y, Nishio H, Motomura Y, Yamasaki S. Kawasaki disease: a matter of innate immunity. Clin Exp Immunol 2016; 186: 134–143. [DOI] [PMC free article] [PubMed] [Google Scholar]
- 3. Chaudhary H, Nameirakpam J, Kumrah R et al. Biomarkers for Kawasaki disease: clinical utility and the challenges ahead. Front Pediatr 2019; 7: 242. [DOI] [PMC free article] [PubMed] [Google Scholar]
- 4. Hara T, Yamamura K, Sakai Y. The up‐to‐date pathophysiology of Kawasaki disease. Clin Transl Immunology 2021; 10: e1284. [DOI] [PMC free article] [PubMed] [Google Scholar]
- 5. Lin IC, Kuo HC, Lin YJ et al. Augmented TLR2 expression on monocytes in both human Kawasaki disease and a mouse model of coronary arteritis. PLoS One 2012; 7: e38635. [DOI] [PMC free article] [PubMed] [Google Scholar]
- 6. Armstrong L, Medford AR, Hunter KJ, Uppington KM, Millar AB. Differential expression of toll‐like receptor (TLR)‐2 and TLR‐4 on monocytes in human sepsis. Clin Exp Immunol 2004; 136: 312–319. [DOI] [PMC free article] [PubMed] [Google Scholar]
- 7. Di Gioia M, Zanoni I. Toll‐like receptor co‐receptors as master regulators of the immune response. Mol Immunol 2015; 63: 143–152. [DOI] [PubMed] [Google Scholar]
- 8. Guo MM, Huang YH, Wang FS, Chang LS, Chen KD, Kuo HC. CD36 is associated with the development of coronary artery lesions in patients with Kawasaki disease. Front Immunol 2022; 13: 790095. [DOI] [PMC free article] [PubMed] [Google Scholar]
- 9. Geng Z, Tao Y, Zheng F et al. Altered monocyte subsets in Kawasaki disease revealed by single‐cell RNA‐sequencing. J Inflamm Res 2021; 14: 885–896. [DOI] [PMC free article] [PubMed] [Google Scholar]
- 10. Tsuge M, Uda K, Eitoku T, Matsumoto N, Yorifuji T, Tsukahara H. Roles of oxidative injury and nitric oxide system derangements in Kawasaki disease pathogenesis: a systematic review. Int J Mol Sci 2023; 24: 15450. [DOI] [PMC free article] [PubMed] [Google Scholar]
- 11. Kuo NC, Lin CH, Lin MC. Prenatal and early life exposure to air pollution and the incidence of Kawasaki disease. Sci Rep 2022; 12: 3415. [DOI] [PMC free article] [PubMed] [Google Scholar]
- 12. Kwon D, Choe YJ, Kim SY, Chun BC, Choe SA. Ambient air pollution and Kawasaki disease in Korean children: a study of the National Health Insurance claim data. J Am Heart Assoc 2022; 11: e024092. [DOI] [PMC free article] [PubMed] [Google Scholar]
- 13. Mou Y, Liao W, Liang Y et al. Environmental pollutants induce NLRP3 inflammasome activation and pyroptosis: roles and mechanisms in various diseases. Sci Total Environ 2023; 900: 165851. [DOI] [PubMed] [Google Scholar]
- 14. Li S, Zhao Q, Sun J et al. Association between high‐mobility group box 1 levels and febrile seizures in children: a systematic review and meta‐analysis. Sci Rep 2023; 13: 3619. [DOI] [PMC free article] [PubMed] [Google Scholar]
- 15. Zaripova LN, Midgley A, Christmas SE, Beresford MW, Baildam EM, Oldershaw RA. Juvenile idiopathic arthritis: from aetiopathogenesis to therapeutic approaches. Pediatr Rheumatol 2021; 19: 135. [DOI] [PMC free article] [PubMed] [Google Scholar]
- 16. Asadi‐Pooya AA. Seizures associated with coronavirus infections. Seizure 2020; 79: 49–52. [DOI] [PMC free article] [PubMed] [Google Scholar]
- 17. Takeshita S, Nakatani K, Tsujimoto H, Kawamura Y, Kawase H, Sekine I. Increased levels of circulating soluble CD14 in Kawasaki disease. Clin Exp Immunol 2000; 119: 376–381. [DOI] [PMC free article] [PubMed] [Google Scholar]
- 18. Hoshina T, Kusuhara K, Ikeda K, Mizuno Y, Saito M, Hara T. High mobility group box 1 (HMGB1) and macrophage migration inhibitory factor (MIF) in Kawasaki disease. Scand J Rheumatol 2008; 37: 445–449. [DOI] [PubMed] [Google Scholar]
- 19. Nakashima Y, Sakai Y, Mizuno Y et al. Lipidomics links oxidized phosphatidylcholines and coronary arteritis in Kawasaki disease. Cardiovasc Res 2021; 117: 96–108. [DOI] [PubMed] [Google Scholar]
- 20. The 27th nationwide survey (2011–2022) of Kawasaki disease in Japan (in Japanese). https://www.jichi.ac.jp/dph/inprogress/kawasaki/
- 21. Yahata T, Suzuki C, Hamaoka A, Fujii M, Hamaoka K. Dynamics of reactive oxygen metabolites and biological antioxidant potential in the acute stage of Kawasaki disease. Circ J 2011; 75: 2453–2459. [DOI] [PubMed] [Google Scholar]
- 22. Kalabokas P, Stavraka T, Kapsomenakis J, Poupkou A, Zerefos C. The evolution of the seasonal variation and the summer diurnal variation of primary and secondary photochemical air pollution in Athens. Environ Sci Proc 2023; 26: 122. [Google Scholar]
- 23. Jung JY, Kim JW, Suh CH, Kim HA. Roles of interactions between toll‐like receptors and their endogenous ligands in the pathogenesis of systemic juvenile idiopathic arthritis and adult‐onset Still's disease. Front Immunol 2020; 11: 583513. [DOI] [PMC free article] [PubMed] [Google Scholar]
- 24. Petrarca L, Manganelli V, Nenna R et al. HMGB1 in pediatric COVID‐19 infection and MIS‐C: a pilot study. Front Pediatr 2022; 10: 868269. [DOI] [PMC free article] [PubMed] [Google Scholar]
- 25. Andersson U. Hyperinflammation: on the pathogenesis and treatment of macrophage activation syndrome. Acta Paediatr 2021; 110: 2717–2722. [DOI] [PubMed] [Google Scholar]
- 26. Pilichowska ME, Pinkus JL, Pinkus GS. Histiocytic necrotizing lymphadenitis (Kikuchi‐Fujimoto disease): lesional cells exhibit an immature dendritic cell phenotype. Am J Clin Pathol 2009; 131: 174–182. [DOI] [PubMed] [Google Scholar]
- 27. Cudrici C, Deuitch N, Aksentijevich I. Revisiting TNF receptor‐associated periodic syndrome (TRAPS): current perspectives. Int J Mol Sci 2020; 21: 3263. [DOI] [PMC free article] [PubMed] [Google Scholar]
- 28. Kobayashi T, Ayusawa M, Suzuki H et al. Revision of diagnostic guidelines for Kawasaki disease (6th revised edition). Pediatr Int 2020; 62: 1135–1138. [DOI] [PubMed] [Google Scholar]
- 29. Sundel R. Refractory KD. UpToDate; [updated 2022 Aug 9, cited 2022 Dec 15]. https://www.uptodate.com/contents/refractory‐kawasaki‐disease.
- 30. Cossarizza A, Chang HD, Radbruch A et al. Guidelines for the use of flow cytometry and cell sorting in immunological studies (third edition). Eur J Immunol 2021; 51: 2708–3145. [DOI] [PMC free article] [PubMed] [Google Scholar]
- 31. Ożańska A, Szymczak D, Rybka J. Pattern of human monocyte subpopulations in health and disease. Scand J Immunol 2020; 92: e12883. [DOI] [PubMed] [Google Scholar]
- 32. Jansen EHJM, Beekhof PK, Viezeliene D, Muzakova V, Skalicky J. Long‐term stability of oxidative stress biomarkers in human serum. Free Radic Res 2017; 51: 970–977. [DOI] [PubMed] [Google Scholar]
Associated Data
This section collects any data citations, data availability statements, or supplementary materials included in this article.
Supplementary Materials
Supplementary figures S1–S5
Supplementary tables S1–S3
Data Availability Statement
The datasets generated during the current study are available from the corresponding author upon reasonable request.