

Abstract
A highly immunosuppressive tumor microenvironment (TME) and the presence of the blood‒brain barrier are the two major obstacles to eliciting an effective immune response in patients with high-grade glioma (HGG). Here, we tried to enhance the local innate immune response in relapsed HGG by intracranially injecting poly(I:C) to establish a robust antitumor immune response in this registered clinical trial (NCT03392545). During the follow-up, 12/27 (44.4%) patients who achieved tumor control concomitant with survival benefit were regarded as responders in our study. We found that the T-cell receptor (TCR) repertoire in the TME was reshaped after poly(I:C) treatment. Based on the RNA-seq analysis of tumor samples, the expression of annexin A1 (ANXA1) was significantly upregulated in the tumor cells of nonresponders, which was further validated at the protein level. In vitro and in vivo experiments showed that ANXA1 could induce the production of M2-like macrophages and microglia via its surface receptor formyl peptide receptor 1 (FPR1) to establish a Treg cell-driven immunosuppressive TME and suppress the antitumor immune response facilitated by poly(I:C). The ANXA1/FPR1 signaling axis can inhibit the innate immune response of glioma patients by promoting an anti-inflammatory and Treg-driven TME. Moreover, ANXA1 could serve as a reliable predictor of response to poly(I:C), with a notable predictive accuracy rate of 92.3%. In light of these notable findings, this study unveils a new perspective of immunotherapy for gliomas.
Keywords: glioma, ANXA1, TLR3, poly(I:C), immunotherapy
Subject terms: Tumour immunology, Predictive markers
Introduction
High-grade glioma (HGG), including glioblastoma (GBM), is characterized by high mortality and an extremely dismal prognosis and is the most common intracranial malignancy [1, 2]. In addition toshortened survival, the impaired neurological function and decreased quality of life of HGG patients indicate the urgent need for more effective treatments [3, 4]. Although immunotherapy has recently opened up new prospects for tumor management, limited success has been observed in the treatment of HGG. Tumor immune desertification and obstacles brought by the blood‒brain barrier (BBB) are the two major challenges of immunotherapy for gliomas [5, 6]. HGG harbors an extensively immunosuppressive tumor microenvironment (TME) lacking T-cell infiltration and has few characterized tumor antigens, which impede the establishment of an effective immune response [7, 8]. Therefore, increasing the amount of T cells and neoantigens in the TME and crossing the BBB is the key to improving the immune response [9]. Our previous clinical results showed that approximately 30% of patients with recurrent GBM could achieve partial or even complete remission after intracranial injection of polyinosinic:polycytidylic acid [poly(I:C)] [10]. Poly(I:C), a typical Toll-like receptor (TLR) agonist, is currently used as an immunoadjuvant to reactivate the suppressed immune response in gliomas [11]. Recent studies have shown that poly(I:C) primes primary human GBM cells for an immune response [12]. In addition, poly(I:C) can repolarize tumor-resident microglia and macrophages toward an M1 active phenotype and mature dendritic cells (DCs) [13–15]. Furthermore, microglia isolated from glioma patients demonstrate antitumor activity after poly(I:C) stimulation [14].
Hence, we continued our clinical trial by expanding the patient population to those with different types of HGG. More than half of the patients still showed no response to poly(I:C). This distinct immune response among patients prompted us to clarify the underlying causes. Based on the bulk RNA-seq results, we found that gliomas from nonresponders expressed high levels of annexin A1 (ANXA1), which was further confirmed by immunohistochemistry. Subsequent single-cell sequencing analysis indicated that ANXA1 was mainly expressed in tumor cells, while formyl peptide receptor 1 (FPR1), a specific receptor of ANXA1, was predominantly expressed in macrophages and microglia, which indicated that tumor cells might interact with macrophages and/or microglia through the ANXA1/FPR1 axis to regulate the immune response of gliomas.
Here, we mainly explored the clinical potential of ANXA1 to serve as a predictive marker of patient response to TLR3 ligands and provide mechanistic insight into the interaction between TLR3 ligands and the ANXA1/FPR1 complex in HGG. Our results showed that higher ANXA1 levels can skew the polarization of macrophages and microglia toward a protumor M2 phenotype, and these cells secrete cytokines, such as CCL22, to recruit more T regulatory (Treg) cells to create an immunosuppressive TME. These findings have profound clinical implications for the management of patients with HGG.
Results
Treatment and outcomes of patients with HGG
The current investigation encompassed the enrollment of a cohort comprising twenty-seven patients. Comprehensive sampling procedures were undertaken to acquire tumor samples, cerebrospinal fluid (CSF), and peripheral blood in the pre- and post-operation stages (Fig. 1A). The corresponding genetic and clinical data of these patients were obtained from Beijing Tiantan Hospital. The detailed information is summarized in Supplementary Table 1.
Fig. 1.

Treatment with the immunoadjuvant poly(I:C) provides a survival benefit for responders. A Schematic representation of patient sample collection and the experimental procedures performed. RT radiotherapy; CTX cytoxan; GM-CSF granulocyte-macrophage colony-stimulating factor. B Typical MR images from a responder and a nonresponder after receiving poly(I:C). C Kaplan–Meier curve comparing the PFS between responders and nonresponders (221.0 vs. 61.0 days, P = 0.0054). D Kaplan–Meier curve comparing the OS between responders and nonresponders (441.0 vs. 263.0 days, P = 0.011)
Of the 27 patients, 1 (3.7%) had a complete response (CR), 9 (33.3%) had a partial response (PR), 2 (7.4%) had stable disease (SD), and 15 (55.6%) had progressive disease (PD), resulting in a disease control rate of 44.4% (Fig. 1B). Patients who achieved CR, PR or SD were defined as responders, while those who exhibited PD were defined as nonresponders. The median progression-free survival and overall survival of responders were 221.0 days and 441.0 days, respectively, which were significantly longer than those of nonresponders (P < 0.05) (Fig. 1C and D).
Dominant oligoclones of CTLs exist in the CSF and TILs of responders
To evaluate potential disparities in cytotoxic T lymphocytes (CTLs) proliferation in the TME between the responder and nonresponder groups after poly(I:C) treatment, we conducted an analysis of the TCR repertoire patterns of CSF, peripheral blood lymphocytes (PBLs) and tumor- infiltrating lymphocytes (TILs) in both groups before and after poly(I:C) treatment. The TCR repertoires of the CD8+ T cells from these samples were generated (Supplemental Fig. 1A and B). We performed a correlation analysis to exclude the impact of cell number on TCR diversity and found that TCR diversity in PBLs was positively associated with cell number (Supplemental Fig. 1C). In contrast, no significant correlation was observed in CSF (Supplemental Fig. 1D). This finding suggests that the amplification of some dominant clones might have occurred in CSF, finally resulting in an increased number of cells in the CSF without affecting TCR clonotypes.
Furthermore, we analyzed the proportions of all clone types of TCRs in CSF and PBLs between groups. The variation in TCR diversity within the CSF exhibited a significant distinction between the responder and nonresponder groups, while this trend disappeared in the analysis of PBLs (Fig. 2A). The hyperexpanded clonotypes accounting for more than 5% of the total clonal space were specifically enriched in CSF from the responders (Fig. 2B). We further analyzed the proportions of the top 10 TCR clones between responders and nonresponders and found that the most expanded clonotype occupied a significantly greater percentage of the clonal space in the CSF of responders (Fig. 2C). As expected, robust proliferation of partial CTL clones in CSF and among TILs occurred in responders but not nonresponders (Fig. 2D). Additionally, the highly abundant clonotypes were significantly enriched only among the TILs in responders after they received poly(I:C) and not those in nonresponders (Fig. 2E), which indicated that the T-cell repertoire in local tumors was reshaped.
Fig. 2.

Analysis of the TCR diversity in paired CSF and PBL samples between the poly(I:C) responder and nonresponder groups. A The proportions of VJ combinations in the PBL and CSF TCRα/β (TCRA/TCRB) repertoires are displayed in circular plots, with the proportion of each V or J cassette represented by its arc length and that of the VJ cassette combination represented by the width of the joining ribbon. B Mean distribution of the CD8+ T-cell clone proportion in PBL and CSF samples from the poly(I:C) responder group. C CDR3 proportion of the ten most prevalent TCR clones in CSF samples from the poly(I:C) responder group and poly(I:C) nonresponder group. D, Circular VJ plots of the TCRB repertoires of CD8+ T cells in CSF and TIL between nonresponder P1 and responder P2. E Circular VJ plots of the TCRB repertoires of TIL in poly(I:C) pre- and post-treatment samples between nonresponders P1 and responders P2
Nonresponders harbor a Treg cell-dominated TME
Since the responders exhibited dominant CTL proliferation, we expanded the characterization of CD45+ immune cells among TILs using scRNA-seq and paired TCR-seq. A total of 13,522 cells from nonresponder P1 (4,163 cells) and responder P2 (9,359 cells) were captured (Supplemental Fig. 2A and B). We initially identified 10 distinct clusters of T cells in the 2 samples by unsupervised clustering (Fig. 3A). CD8+ and CD4+ T cells showed subsets expressing naïve markers (SELL and CCR7), activated effector markers (GZMA, GZMH and GZMK) or exhaustion markers (PDCD1 and HAVCR2). In addition, Treg cells expressed CD4 and FOXP3 (Fig. 3B). The following cluster analysis demonstrated that the TCR clones were mostly CD4+ Treg cells and exhausted CD4+ cells in nonresponders, while the top-ranked clones were mainly memory and effector T cells in responders (Fig. 3C). We further divided the immune cells into three major subgroups (Treg cells, non-Treg CD4+ cells and CD8+ cells) and found that Treg cells were predominant in the tumors of nonresponders, while CD8+ cells were enriched in the tumors of responders (Fig. 3D). Interestingly, according to the changes in TCR ratios in the samples pre- and post-treatment combined with the scRNA-seq data obtained from recurrent tumors after remission, we found that the clones with increasing proportions in the post-treatment tumor of nonresponders eventually degenerated into exhausted and Treg CD4+ cells (Fig. 3E). In contrast, the high-proportion and decreasing proportion clones in the post-treatment tumors of responders were mainly CTLs, most of which were effector, memory and exhausted CD8+ cells after recurrence (Fig. 3F). These results suggest that the increased Treg cells in nonresponders create an immunosuppressive TME.
Fig. 3.

scRNA-seq analyses reveal that nonresponders retain the Treg cell-dominated tumor microenvironment. A UMAP plot of T cells. The clusters are colored by inferred cell type (left), patient (top right) and TCR detection (bottom right). B Dot plots showing marker genes across T-cell subsets. The size of each point indicates the proportion of cells expressing the marker colored by the normalized expression level. C T-cell subtype composition of the top 20 most abundant clones in each patient. Each bar represents a clone, colored by the proportion of the cell subtype. D Bar plot showing the percentages of clonal cells in each T-cell subtype. E Alluvial plots showing the common clonotypes in pre- and post-treatment samples from P1 (nonresponder) in the bulk TCR-seq data. Each column indicates the quartile of the ranked clonotypes based on proportion (left). Each bar indicates the T-cell subtype composition of all common clonotypes (right) detected by scRNA-seq. F Alluvial plots showing the common clonotypes in pre- and post-treatment samples from P2 (responder)
A hyperinflammatory TME is promoted in nonresponders
To further investigate the reasons for this distinct treatment response and identify predictors of the response to poly(I:C), we sequenced the transcriptomes of 6 pretreatment samples from both responders and nonresponders (Supplemental Figure 3A). Principal component analysis (PCA) showed that the responders had a more uniform transcriptional profile than the nonresponders (Supplemental Figure 3B). Functional enrichment analysis of the differentially expressed genes revealed that many immune-related gene modules involved in adaptive and innate immunity were upregulated in nonresponders (Fig. 4A and B). Moreover, most downregulated modules in nonresponders were correlated with neurodevelopmental function (Fig. 4C and D).
Fig. 4.

Differences in transcriptomic profiles between responders and nonresponders. A Annotation network showing the results of the functional enrichment analysis of the significantly upregulated genes (adjusted p value < 0.05) in the nonresponders versus responders. The nodes represent statistically significant enriched GO terms. The size of each node represents the number of genes enriched in each term. The edges show the numbers of overlapping genes within terms. B Broken line diagram of the 12 upregulated gene modules in the nonresponders. The y-axes show the average expression values of the enriched genes in each module. C Functional annotation network of the significantly upregulated genes (adjusted p value < 0.05) in the responders versus nonresponders. D Broken line diagram of the 5 upregulated gene modules in the responders. E Heatmap of the average expression of genes from gene modules across each sample with distinct states. The expression data of 5 normal samples were downloaded from TCGA. Boxplots of gene modules across samples with distinct states. The p value was calculated using an unpaired Student’s t test. *P < 0.05, **P < 0.01, ***P < 0.001, ****P < 0.0001. H Heatmap of the top 20 genes present in upregulated or downregulated modules in the responders compared with the nonresponders
To better understand the characteristics of nonresponders, we systematically analyzed the transcriptomic data of 5 normal samples from paratumor tissue (GBM) from The Cancer Genome Atlas (TCGA) database as controls, 2 samples from responders who experienced recurrence, and prior sequencing data. The combined analysis indicated that the gene expression patterns in the pretreatment samples of responders were similar to those in the paratumor samples, while the characteristics of samples from responders who experienced recurrence were intermediate between those of responders and nonresponders (Fig. 4E–G, Supplemental Figures 3C-E). This finding indicates the gradually transformed transcriptional characteristics of patients from immune response to nonresponse. Notably, the immune-related modules were significantly upregulated in the samples from nonresponders compared with those from others (Fig. 4F). These findings suggest that the TME in nonresponders is linked to excessive activation and hyperinflammation.
ANXA1 is a potential predictor of response to TLR3 ligands
Through differential expression analyses, we identified the top 20 differentially expressed genes that were upregulated or downregulated (Fig. 4H). By quantitative PCR verification, we found that the levels of ANXA1 significantly differed between responders and nonresponders (Fig. 5A). Therefore, our subsequent analysis focused on ANXA1. By comparing the expression level of ANXA1 among the 4 groups (paratumor, nonresponder tumors, responder tumors and responder relapsed tumors), we found that the expression of ANXA1 was the highest in nonresponder samples, followed by lower expression in normal samples and responder tumors (Fig. 5B). The immunohistochemical data also indicated that ANXA1 was highly expressed in the tumors of nonresponders and that its expression was very low in the responder group but increased in the relapsed group (Supplemental Fig. 4 and 5C). In addition, we added the expression of ANXA1 in hundreds of samples between glioma tumor and control normal tissues according to the TCGA and GTEx databases (Supplemental Fig. 5). The analysis results showed that the expression level of ANXA1 in gliomas was significantly higher than that in normal tissues. To investigate the effectiveness of ANXA1 as a predictor of response to TLR3 ligands, we retrospectively analyzed the protein expression of ANXA1 in patients who received poly(I:C) treatment. Our results showed that responders had significantly lower ANXA1 expression than nonresponders. The receiver operating characteristic (ROC) curve indicated that the sensitivity, specificity and accuracy of ANXA1 in predicting the response to TLR3 ligands were 91.7%, 92.9% and 92.3%, respectively (Fig. 5D).
Fig. 5.

Glioma-derived ANXA1 induces M2-like macrophages to recruit Treg cells. A The mRNA expression level of ANXA1 was verified by quantitative PCR between the responder group (n = 5) and the nonresponder group (n = 5). The data were analyzed according to the 2-△CT method and normalized to GAPDH levels and are represented as the means ± SDs. B Boxplots of the expression of the ANXA1 gene across samples with distinct states. C Representative HE and immunohistochemical images of ANXA1 expression in responder and nonresponder samples (scale bar, 200 µm). D The expression of ANXA1 could be regarded as a reliable predictive marker of response to poly(I:C); analysis of ANXA1 levels showed an AUC of 0.923 (0.815-1.000) (P < 0.001). The sensitivity, specificity and accuracy were 0.917, 0.929 and 0.923, respectively. E mRNA expression level of ANXA1 in different cell types from the scRNA-seq data. F mRNA expression level of FPR1 in different cell types from the scRNA-seq data. G Boxplots showing the expression of CCL22 in macrophages in responders (P2) and nonresponders (P1). H M2/M1 score in macrophages between responders (P2) and nonresponders (P1) from the scRNA-seq data. The p values were calculated using the Wilcoxon test. I Both M1 and M2 phenotype macrophages were cocultured with ANXA1Low and ANXA1High glioma cells for 48 hours. M2-like phenotype cells were assessed for the expression of human M2 macrophage markers (CD163 and CD206) at the recommended concentration (0.5 μg/106 cells). Then, the cells were collected using a BD FACSAria flow cytometer. J, L The mRNA expression levels of CCL22 and TLR3 were verified by quantitative PCR after poly(I:C) (50 µg/µl, 24 hours), ANXA1 (100 ng/ml, 24 hours) or HCH6-1 (50 μM, 1 hour) stimulation in M0 macrophages. The data were analyzed according to the 2-△CT method and normalized to GAPDH levels and are represented as the means ± SDs. K The effects of M2 macrophages treated with or without ANXA1 on the migration of Treg cells were assessed by a Transwell assay, and the number of Treg cells in the lower chamber was statistically analyzed by FACS at a high speed for 60 seconds per sample. These macrophages were differentiated from THP-1 cells. In A, B, J, K and L, the p value was calculated using an unpaired Student’s t test. *P < 0.05, **P < 0.01, ***P < 0.001, ****P < 0.0001, ns stands for not significant. In E and F, the p value was calculated using the Wilcoxon test, and ****P < 0.0001
ANXA1 triggers macrophage M2 polarization
Although ANXA1 is widely expressed in cells, tumor cells were the major source of the distinct expression patterns between responders and nonresponders according to the single-cell data (Fig. 5E). As the main receptor of ANXA1, FPR1 was predominantly expressed in the microglia and macrophages of nonresponders (Fig. 5F). Furthermore, cell‒cell interaction analysis in the TME showed that macrophages/microglia interacted with Treg cells in the nonresponder sample (Supplemental Fig. 6). Studies have shown that CCL22 can be used as a chemokine gradient to facilitate Treg cell migration [16]. These results suggest that some chemokines might have been secreted by macrophages to recruit Treg cells in tumors. Therefore, we measured the expression of CCL22 in macrophages from single-cell RNA-seq and found that CCL22 expression in the nonresponder sample was significantly higher than that in the nonresponder sample (Fig. 5G). Previous studies have shown that M2 macrophages recruit more Treg cells, so we evaluated the expression of M2-related genes in macrophages. According to the M1 (IL6, IL1B, IL12B, CD86, CXCL9, CXCL10, IFNB1, IFNAR1 and TNF) and M2 (IL10, CCL22, ARG1, MRC1, CD163, MRC1, TGFB1, IRF4, TGM2, CXCL12 and CXCR4) marker genes, we scored each macrophage from single-cell RNA-seq and confirmed that the macrophages in the nonresponder (P1) sample showed a stronger M2 phenotype (Fig. 5H).
This insight related to the tumor-macrophage/microglia-Treg relationship prompted us to explore the role of ANXA1 in regulating macrophage polarization. In a coculture system of U251 cells with macrophages, the M2 phenotype was assessed based on the expression of the surface markers CD163 and CD206. Our flow cytometry findings demonstrate that the number of M2 phenotype macrophages in the group cocultured with U251-ANXA1High glioma cells was higher than that of macrophages cocultured with U251-ANXA1Low glioma cells. These results collectively support the conclusion that ANXA1 plays a pivotal role in triggering macrophage M2 phenotype polarization (Fig. 5I). Furthermore, higher levels of CCL22 release were observed in macrophages treated with recombinant human ANXA1 than in untreated macrophages, while poly(I:C) significantly inhibited the induction of ANXA1 and further reduced the expression of CCL22 in macrophages. The addition of the FPR1 inhibitor HCH6-1 inhibited the increase in CCL22 levels induced by ANXA1 (Fig. 5J).
To validate the function of the ANXA1/FPR1 axis between tumor cells and macrophages in the recruitment of Treg cells, we performed a Treg chemotaxis assay, and the results showed that M2 macrophages treated with ANXA1 recruited more Treg cells than untreated M2 macrophages (Fig. 5K). These findings indicate that ANXA1 can significantly enhance the ability of macrophages to recruit Treg cells.
In addition, the mRNA expression of TLR3 was significantly activated in M0 cells after stimulation with poly(I:C), and the activation efficiency was not significantly affected by the addition of the FPR1 inhibitor HCH6-1, but the coexistence of ANXA1 and poly(I:C) resulted in the downregulation of TLR3 (Fig. 5L). This finding indicates that ANXA1 suppresses the response to poly(I:C) by downregulating the expression of its receptor TLR3.
Decreasing ANXA1 expression improves the response to TLR3 ligands
We investigated the direct impact of ANXA1 on TLR3 ligands using an in situ tumor mouse model with GL261 cells. Poly(I:C)-based immunotherapy was administered to the mice. We performed RNA-seq analysis of the tumors and found that the poly(I:C)-responsive mice had a relatively low level of ANXA1 expression, which was similar to that in normal brain tissues of mice (Fig. 6A). To determine the tumor-infiltrating T-cell types in orthotopic tumors of mice subjected to the model, we analyzed cells from mouse samples and found that CD8 cells were significantly more enriched in the tumors of responsive mice than in the tumors of nonresponsive mice. Conversely, the levels of Treg cells were higher in the nonresponsive mice than in responsive mice (Figs. 6B and C). To further validate the association between ANXA1 and TLR3 ligands, we used GL261-ANXA1WT-luc and GL261-ANXA1KD-luc cells to generate orthotopic tumors in mice and administered poly(I:C) (Fig. 6D). GL261-ANXA1WT-luc cells induced more substantial tumor progression than GL261-ANXA1KD-luc cells. In addition, low ANXA1 expression in tumors resulted in an effective response to poly(I:C) and showed potent tumor-control capacity (Fig. 6E and F). Furthermore, we performed a survival analysis among all experimental mice, and the results showed that the survival time of the ANXA1KD mice who received poly(I:C) was significantly longer than that of the ANXA1WT mice without poly(I:C) injection (P < 0.01) (Fig. 6G). Although these mice were killed on Day 20, the survival trends among the four groups can still provide valuable insights into the effects of the interventions. We analyzed TILs from orthotopic tumors of mice and found that the GL261-ANXA1KD-luc mice activated more CD8 cells in the tumor than the GL261-ANXA1WT-luc mice after poly(I:C) treatment. Conversely, the levels of Treg cells and M2 macrophages were higher in the tumors of the GL261-ANXA1WT-luc mice than in those of the GL261-ANXA1KD-luc mice (Fig. 6H). The flow cytometry data were consistent with the results of multicolor IF staining (Fig. 6I). Therefore, our data indicated that tumors with lower ANXA1 levels had a more effective response to TLR3 ligands.
Fig. 6.

Low ANXA1 expression in glioma is associated with an effective response to TLR3 ligands in orthotopic tumor mice. A Transcript level of Anxa1 by RNA-seq in normal brain tissue and tumor tissues of responders or nonresponders to poly(I:C) treatment in GL261-bearing mice, n = 5 for each group. B Cell type analysis of TILs by FACS between responders and nonresponders to poly(I:C) treatment in GL261-bearing mice. C Statistical analysis of the cell ratios of CD8+, CD4+ and Treg cells in CD45+ cells from TILs between responders and nonresponders to poly(I:C) treatment in GL261-bearing mice. D Scheme of the poly(I:C) treatment of mice bearing established GL261-ANXA1WT-luc and GL261-ANXA1KD-luc glioma orthotopic tumors. E Bioluminescence images of orthotopic GL261-ANXA1WT-luc and GL261-ANXA1KD-luc glioma orthotopic tumors. F Progression of orthotopic GL261-ANXA1WT-luc and GL261-ANXA1KD-luc tumors as evaluated by bioluminescence imaging; n = 5 mice for different treatment groups; data are shown as the means ± SEMs; P values determined by two-way ANOVA with Tukey’s correction for multiple comparisons compare tumors on Day 20. *P < 0.05 and **P < 0.01. G Comparisons of survival time between different groups. Log-rank test. **P < 0.01, ns stands for not significant. H Multicolor IF staining with anti-CD8-PE and anti-PD1-GFP antibodies showing CD8+ exhausted cells, anti-CD4-PE and anti-Foxp3-GFP antibodies showing Treg cells, and anti-CD68-PE and anti-CD206-GFP antibodies showing M2 macrophages in tumors between GL261-ANXA1WT-luc mice and GL261-ANXA1KD-luc mice after poly(I:C) treatment. The scale bar represents 100 µm. I Flow cytometry was employed to evaluate changes in immune cell subsets within the tumor microenvironment between GL261-ANXA1WT-luc mice and GL261-ANXA1KD-luc mice after poly(I:C) treatment
Discussion
In this study, we demonstrate that glioma-derived ANXA1 has an important effect on the TLR3 ligand response in vivo, promoting the development of an immunosuppressive TME by skewing macrophages and microglia toward an M2-like phenotype via the ANXA1/FPR1 axis. Our findings provide more mechanistic insight into the functions of ANXA1 in glioma biology. First, we found that nonresponders did not have the characteristic of dominant oligoclones in either CSF or TILs, as observed in patients who responded to poly(I:C). Second, we indicated that a hyperinflammatory and immunosuppressive TME, accompanied by high ANXA1 expression, was promoted in nonresponders. Third, we found that higher ANXA1 expression could trigger macrophage polarization toward the M2 phenotype, enhance Treg cell infiltration and decrease the survival of patients and glioma model mice. Our results revealed the mechanism by which glioma cells regulate the brain tumor environment through the ANXA1/FPR1 axis and contribute to therapeutic resistance to TLR3 ligands.
Recently, novel strategies targeting innate immune processes involved in tumor immunosurveillance and the generation of antitumor immune responses have attracted considerable attention [17]. Because TLR3 can induce apoptosis in cancer cells and simultaneously activate the immune system, TLR3 ligands are promising therapeutic options for the treatment of different cancers [11], including glioma [12, 14]. In our clinical trial, approximately half of the glioma patients in whom first- and second-line therapy failed still responded to poly(I:C). Moreover, an elevated level of ANXA1 was detected in the subgroup of nonresponders to poly(I:C). ANXA1, initially identified as an anti-inflammatory mediator, is implicated in cancer, and its functions in cancer growth and metastasis remain unclear and even conflicting. The expression of ANXA1 can be upregulated or downregulated in different cancers [18]. ANXA1 expression is reduced in some cancers, especially squamous cell carcinomas or cancers located in the upper region of the body [19, 20]. However, ANXA1 can be highly expressed in other cancers [21, 22], predominantly those in the gut [23]. The expression of ANXA1 has previously been shown to vary with the grade of malignancy in neuroepithelial tumors but is not associated with survival [24]. Despite the contradictory findings regarding the impact of ANXA1 on survival, clinical studies have confirmed the involvement of ANXA1 in glioma progression and its correlation with poor patient outcomes [25, 26].
ANXA1/FPR signaling pathways and their biological implications in inflammation (exerting pro- and anti-inflammatory effects in innate and adaptive immunity) have already been reviewed [27–29]. Human FPRs, the receptors of ANXA1, constitute a family of seven-transmembrane G protein-coupled receptors with the following three members: FPR1, FPR2 and FPR3 [30]. In a recently published spatial transcriptome article on human squamous cell carcinoma, ANXA1/FPRs was the top-ranking pair in an analysis of ligand–receptor pairs in the TME. The expression of FPRs is particularly high in tumor-associated macrophages (TAMs) and myeloid-derived suppressor cells (MDSCs) [31]. Signaling through the ANXA1/FPR1 axis in glioblastoma cells could be involved in tumor progression [25, 32]. By mining our single-cell data, we found that FPR1 was highly expressed in macrophages and microglia but not in other types of cells, which was accompanied by increased expression of ANXA1 in nonresponders. By combining our ligand–receptor pair analysis between macrophages/microglia and TILs with glioma RNA-seq data from our patients, we observed that in the samples from the poly(I:C) nonresponders, high ANXA1 expression was positively correlated with the levels of macrophages/Treg cells, indicating an environment associated with a dismal prognosis. The immune response provides selective pressure and has been associated with both effective tumor clearance and immunoediting of the cancer cell population. The exhaustion and dysfunction of TILs seem to be particularly apparent among T cells that infiltrate the glioma microenvironment [33]. Our single-cell results also support this observation. We found that the predominant oligoclonal CTLs originally discovered during remission were lost as the disease progressed, possibly stemming from tumor immune escape and T-cell exhaustion. Moreover, ANXA1 expression was significantly increased in relapsed tumors, implying that gliomas with high ANXA1 expression may be resistant to the TLR3 ligand poly(I:C). Similarly, ANXA1-expressing tumors established in Fpr1−/− mice develop resistance to chemotherapy, and the TLR3 agonist poly(I:C) can restore antigen presentation by Fpr1−/− DCs and correct this poor chemotherapeutic response [34]. As poly(I:C) is a TLR3 receptor that does not directly interact with the ANXA1/FPR1 activation pathway, we performed the following molecular experiments in THP1-induced M0 macrophages, in which IL1β, IL6 and TNFα are related to the activation of the FPR1 signaling pathway. We found that only ANXA1 could significantly activate these genes, and there was no difference in poly(I:C) compared with the control (Supplemental Fig. 7A). The downstream molecule ISG56 of poly(I:C) was significantly activated in M0 cells after stimulation with poly(I:C), and the activation efficiency was not significantly affected by the addition of the FPR1 inhibitor, but the coexistence of ANXA1 and poly(I:C) resulted in the downregulation of the expression of molecules associated with the poly(I:C) activation pathway (Supplemental Fig. 7B). Therefore, ANXA1/FPR1 and TLR3 probably share an immune-related pathway that precipitates a therapeutic response. Although we are not clear whether there is a direct effect of ANXA1/FPR1 on TLR3 at present, our findings suggest a direction to explore the molecular mechanism in the future.
Collectively, we propose the following model (Fig. 7): in nonresponsive gliomas, the high expression of ANXA1 correlates with a high expression of FPR1 in macrophages and microglia, which can release anti-inflammatory cytokines to recruit Treg cells by chemotaxis; thus, the Treg cell-dominated immune cell population establishes an immunosuppressive TME. Consistent with this model, immune activation by poly(I:C) was inhibited by the TME and clinically manifested as resistance to poly(I:C). ANXA1 is thought to be useful as a reliable predictor of the response to TLR3 ligands due to its differential expression in tumor tissue samples between responders and nonresponders. From a clinical perspective, it may be interesting to evaluate the therapeutic utility of TLR3 ligands, such as poly(I:C), while focusing on a select population of patients who have a similar or slightly lower expression level of ANXA1 in glioma tumor tissue than in paratumor tissue as determined by puncture biopsy. This approach could contribute to a personalized immunotherapy protocol. For nonresponders, poly(I:C) resistance might be overcome by FPR1 blockade, although support from clinical trials is needed. Exploring and understanding the molecular mechanisms of ANXA1 in glioma biology could broaden the target population of TLR3 ligand responders and improve the outcomes of patients with glioma.
Fig. 7.
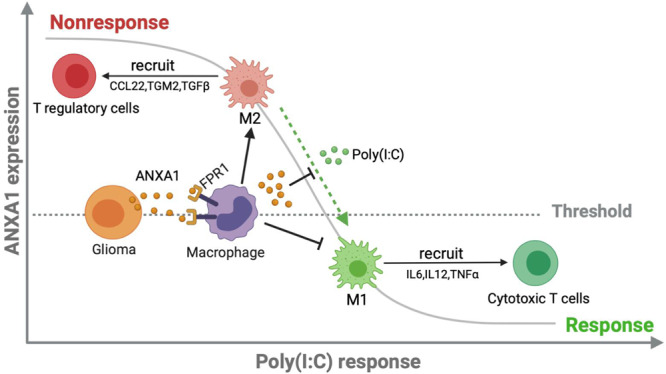
The ANXA1/FPR1 axis and TLR3 ligands trigger an antagonistic immune response in the TME of glioma
Methods
Patients and clinical samples
This study was registered at clinicalTrials.gov (NCT03392545). The specific dosing regimen of poly(I:C) consisted of intracranial (0.25–0.5 mg per injection, 5 consecutive injections) and systemic (2 mg per injection, q.o.d., 7 total intramuscular injections) stimulation of immunity. All patients underwent resection or biopsy to confirm the pathological diagnosis and obtain tumor samples. An Ommaya reservoir was implanted into the surgical cavity or lateral ventricle during the operation to inject poly(I:C) and drain CSF. Patients were followed and analyzed by brain magnetic resonance at an interval of 1 month, and the treatment effect was evaluated according to the immunotherapy response assessment in neuro-oncology (iRANO) criteria [35].
Preparation of single-cell suspensions
Blood clots and vessels were removed from fresh tumor specimens, and the samples were washed with Hank’s balanced salt solution (HBSS), finely minced with a scalpel and enzymatically dissociated using 0.05% collagenase Type 4, 0.125% trypsin, 1,000 U/ml hyaluronidase and 5 U/ml deoxyribonuclease I in HBSS (+Ca+Mg). The samples were incubated at 37 °C with rotation at 70 rpm for 60 minutes and passed through a 40-µm cell strainer, and the dissociated cells were centrifuged at 800 rpm (180 × g) for 5 minutes at room temperature. After the supernatant was removed, the pelleted cells were suspended in red blood cell lysis buffer (Solarbio) and incubated on ice for 2 minutes to lyse red blood cells. The cell pellets were resuspended in sorting buffer (PBS with 2% FBS) after washing twice with PBS. One part of the single-cell suspensions was processed for scRNA-seq, and the other part was processed for TCR repertoire assessment.
Establishment and analysis of the TCR repertoire of CD8+ CTLs
Peripheral blood, CSF and some fresh tumor samples were collected from the enrolled patients. Mononuclear cells were sorted to isolate CD3+CD8+ T cells by flow cytometry (BD). The total RNA extracted from CD3+CD8+ T cells was purified using the RNeasy Plus Micro Kit (Qiagen, Cat No. 74034). For TCR repertoire amplification, RNA was reverse transcribed to construct the TCRα chain (TCRA) and TCRβ chain (TCRB) cDNA libraries by using a locked nucleic acid (LNA)-containing template-switching oligo (TSO) [36] and the TRAC1 and TRBC1 primers. Then, nested PCR with the first and second amplicons of complementarity-determining region 3 (CDR3) of the human TCRA and TCRB was performed with the corresponding primers. By Illumina HiSeq 2500 PE250 sequencing, we obtained 220-250-nt paired-end reads. The TCR repertoire information was first extracted from the raw paired-end fastq files, and clonotypes were defined by the CDR3 amino acid sequence using BioQueue [37]. Then, the extracted.txt document that contained the TCR sequence information was further analyzed with the VDJviz browser and VDJtools [38].
Single-cell RNA sequencing (scRNA-seq) and scRNA-seq data processing
For droplet-based scRNA-seq (including transcriptome and paired TCR) sequencing of individual cells in each sample, single cells (CD45+/CD3+ cell:CD45- cell ratio = 7:3) were processed on the GemCode Single Cell Platform using GemCode Gel Bead, Chip and Library Kits (10× Genomics, Pleasanton) following the manufacturer’s protocol.
ScRNA-seq reads were mapped to the GRCh38 reference genome using 10× Genomics Cell Ranger (version 3.1). After the read count matrices of each sample were obtained, the following analyses were performed using the Seurat R package [39]. We filtered cells with fewer than 200 genes or more than 5000 genes and a mitochondrial RNA read count greater than 25%. Genes detected in more than 3 cells were retained for further analysis. Then, the gene expression matrices were normalized with the NormalizeData function and scaled based on the top 2000 highly variable genes calculated with the FindVariableFeatures function. To reduce the dimensionality of the data, we used the RunPCA function and RunUMAP with the first 20 principal components. Finally, cells were displayed based on uniform manifold approximation and projection (UMAP) embedding of the first 2 principal components. The cells were clustered using the FindNeighbors and FindClusters functions. Each cell cluster was annotated according to the expression of marker genes.
To integrate T cells from two samples, we used the FindIntegrationAnchors function [40] to identify ‘anchors’ between the samples and then integrated the two datasets with the IntegrateData function with 30 dimensions. The batch-corrected expression matrix was used to perform the scRNA-seq data analysis described above.
TCR sequencing (TCR-seq) data processing
The Cell Ranger vdj pipeline (version 3.1) for assembling V(D)J sequences and annotating consensus TCRs was provided by 10X Genomics. TCR clonotypes were assigned using this pipeline. For exclusion of doublets and incomplete TCR sequences, only clonotypes with one productive TCRB and at least one productive TCRA were retained for further analysis.
Cell‒cell interactions
For systematic analysis of cell‒cell interactions, we used CellPhoneDB [41] to identify potential ligand‒receptor pairs between cell types from single-cell transcriptomic data. The ligand‒receptor pairs we used were stored in CellPhoneDB. Only ligands and receptors expressed in more than 30% of the cells in any given subset were retained. For identification of high-confidence interactions, a total of 1000 permutation tests were performed by randomly permuting the cell type labels of all cells. The empirical p value for each ligand‒receptor pair between two cell types was assessed by permutation tests.
RNA-seq data analysis and enrichment analysis
Fastq reads were processed with Cutadapt (v1.9.1) [42] to remove adapter sequences and retain clean reads of high quality. The clean reads were aligned to the GRCh38 reference genome using HISAT2 (v2.0.1) [43]. Then, the expression level of each gene was estimated with HTSEQ (v0.6.1) [44]. A differential expression analysis was performed using the R package DESeq2 [45], a model based on a negative binomial distribution. To assess the biological functions of the differentially expressed genes in each comparison, we used the Cytoscape plugin ClueGO [46] to perform Gene Ontology (GO) biological process (BP) enrichment analysis. Only terms with adjusted p values < 0.01 were selected to generate the annotation network.
Tissue sectioning and immunohistochemistry (IHC)
Formalin-fixed, paraffin-embedded tissues were cut into 4 μm thick slices. IHC was performed with a Ventana Bench Mark XT autostainer according to the manufacturer’s protocol with a rabbit monoclonal Ab against ANXA1 (1:4,000 dilution, Abcam). Each individual sample was screened in at least three isolated fields, and more than 100 qualified tumor cells were evaluated per field. Necrotic areas and perivascular zones were excluded. The immunohistochemical score was calculated as the mean percentage of ANXA1-positive cells among all assessed tumor cells. For interpretation, the expression level of ANXA1 was defined as either high (≥30%) or low (<30%) according to the percentage of ANXA1-positive cells.
Immunofluorescence (IF)
The CD8, Treg and M2 macrophages in the TME of tumor-bearing mice were stained with markers (CD8, programmed cell death protein-1 (PD-1), CD4, Foxp3, CD68 and CD206). Briefly, the sections were blocked with 10% normal goat serum for 30 min after deparaffinization, rehydration, antigen retrieval, and endogenous peroxidase inactivation. Then, the sections were incubated with primary antibodies from different panels in a humidified chamber at 4 °C overnight, followed by horseradish peroxidase-conjugated secondary antibody incubation and tyramide signal amplification (TSA). The slides were microwave heat-treated after each TSA operation. Nuclei were stained with DAPI after all the antigens above had been labeled. The stained slides were subjected to confocal imaging (Nikon) using a 20× objective. Image analysis was performed using NIS-Elements Viewer.
Cell lines and culture conditions
Human U251, mouse GL261 and THP-1 cells were purchased from the American Type Culture Collection (ATCC). All cells were maintained in standard culture conditions (at 37 °C under 5% CO2). U251 and GL261 cells were maintained in complete medium (Dulbecco’s modified Eagle’s medium (DMEM)) with 10% heat-inactivated fetal bovine serum (FBS). THP-1 cells were cultured in RPMI-1640 medium with 10% FBS.
The human ANXA1 overexpression vector was transfected into U251 glioma cells, and the ANXA1-overexpressing cell line (U251-ANXA1High) was obtained. The U251 wild-type cell line with low ANXA1 expression was used as the cell line with low ANXA1 expression (U251-ANXA1Low). The ANXA1 mRNA and protein levels in the U251-ANXA1High and U251-ANXA1Low cell lines are shown in Supplemental Figure 8.
THP-1 cells were stimulated and differentiated into the M1 phenotype or M2a phenotype. THP-1 cells were stimulated with phorbol 12-myristate 13-acetate (PMA; 100 nM) for 48 hours for differentiation into M0 macrophages. The differentiated macrophages were further washed and treated with lipopolysaccharide (LPS; 100 ng/ml) and IFN-γ (20 ng/ml) for polarization toward the M1 phenotype or IL-4 (20 ng/ml) and IL-13 (20 ng/ml) for polarization toward the M2a phenotype [47, 48]. After 48 hours, the cells were washed and cocultured with tumor cells for further experiments.
We performed the following molecular experiments in THP1-induced M0 macrophages, including the addition of poly(I:C) (50 μg/μl, 24 hours), ANXA1 (100 ng/ml, 24 hours) and the FPR1 inhibitor HCH6-1 (50 μM, 1 hour), and then collected the cells to evaluate the expression of related genes by quantitative PCR.
The GL261-ANXA1 knockdown (GL261-ANXA1KD) cell line was obtained using the CRISPR–Cas9 plasmid [guide RNA (sgRNA) sequence: agtacgcggccttgatctgc]. Wild-type GL261 (GL261-ANXA1WT) cells were used as a negative control. GL261-ANXA1KD and GL261-ANXA1WT cells were transduced to express firefly luciferase GFP with lentivirus, and GL261-ANXA1WT-luc and GL261-ANXA1KD-luc cell lines were obtained.
Flow cytometry
Cells were stained with fluorophore-conjugated antibodies (0.5 μg/ml) in phosphate-buffered saline (PBS) containing 1% FBS and 0.5 mM EDTA at a concentration of 1 × 10⁷ cells/ml. For human cells, the following antibodies were used: CD45-BV421 (BioLegend, #368522), CD3-APC (BioLegend, #344812), CD8-FITC (BD Biosciences, #555634), CD163-PerCP/Cy5.5 (BD Biosciences, #563887), CD206-PE (BioLegend, #321105), and Foxp3-BV421 (BioLegend, #320123). For mouse cells, the following antibodies were used: CD3-AF700 (BioLegend, #100216), CD4-APC (BioLegend, #100412), CD8-PE (BioLegend, #100708), CD8-FITC (BioLegend, #100705), CD45.2-PerCP/Cy5.5 (BioLegend, #109827), and Foxp3-FITC (eBioscience, #11-5773-82). For staining of activation-induced dying cells, cells were stained with surface markers followed by Annexin V (SizhengBai, #FXP023-100) staining in calcium-containing buffer. Flow cytometry data were acquired by BD Fortessa and analyzed by using FlowJo software (BD Biosciences).
Chemotaxis assay
The in vitro migration of primary lymphoma cells was measured by a Transwell assay using Transwell plates (Corning) with 8.0-µm pore size polycarbonate membranes. Regarding the assays involving ANXA1 (R&D Systems, Minneapolis, MN) treatment, M2 macrophages were treated with ANXA1 (50 ng/ml) for 48 hours. Primary lymphoma cells from healthy donors were provided by the Department of Hematology, Peking University People’s Hospital under an institutional review board–approved protocol. Primary lymphoma cells (5 × 10⁵) were cultured in serum-free RPMI 1640 medium for 3 hours and added to the upper chambers. The plates were incubated at 37 °C for 12 hours, the cells that migrated through the pores into the lower chamber were collected, and Treg cells were counted by passage through a flow cytometer at a high speed for 60 seconds per sample.
Mouse models
Female C57BL/6 mice aged 6-8 weeks were purchased from SPF (Beijing) Biotechnology Co. The mice were kept under 12:12 light/dark cycles with unrestricted food and water availability. All mouse experiments were conducted according to the guidelines of Institutional Animal Care and Use Committee (IACUC)-approved protocols. For the glioma orthotopic tumor models, GL261-ANXA1WT-luc or GL261-ANXA1KD-luc cells were implanted intracranially. The surgical implants were performed using a stereotactic surgical apparatus (Stoelting) with tumor cells (2 × 10⁶ cells in a total volume of 10 μl) implanted 2.6 mm lateral to the bregma and 3.5 mm below the skull. Tumor progression was evaluated by bioluminescence emission on a Lumina II instrument (CALIPER) after intraperitoneal d-luciferin (Yeasen) injection.
Statistical analysis
All analyses were conducted using GraphPad Prism, Excel and R Foundation’s R software version 3.1.0. Student’s t test was used to compare 2 experimental groups except for separate annotations, and all data are represented as the mean ± SD. Survival analysis was computed using the Kaplan‒Meier method, and differences between curves were compared by the log-rank test. Probability values were obtained using two-sided tests with statistical significance defined as P < 0.05.
Sequencing data upload information
The raw sequence data reported in this paper have been deposited in the Genome Sequence Archive (Genomics, Proteomics & Bioinformatics 2021) in the National Genomics Data Center (Nucleic Acids Res 2022), China National Center for Bioinformation/Beijing Institute of Genomics, Chinese Academy of Sciences (GSA-Human: HRA005174), which are publicly accessible at https://ngdc.cncb.ac.cn/gsa-human.
Supplementary information
Acknowledgements
This study was supported by a grant from the National Natural Science Foundation of China (81771309, 31930039 and 31821003 to Xin Lin and 82202983 to Haihui Jiang). This study was also supported by grants from the Capital’s Funds for Health Improvement and Research (2020-2-1075 to Yong Cui) and the National Key Research and Development Program of China (2019YFA0508502 to Xin Lin). The authors would like to thank Dr. Youwen He, Department of Immunology, Duke University Medical Center, for his valuable suggestions during this study.
Author contributions
Conceptualization, XL, S., and YZ; methodology, YZ, HJ, and NY; formal analysis, YZ, HJ, and NY; investigation, YZ, HJ, NY, SS, DH, LJ., J.L and LX; resources, SL, HJ, ML, KY, XR, and YC; data curation, YZ; writing – original draft, YZ; visualization, YZ, HJ, and NY.; supervision, XL, and SL; funding acquisition, XL SL HJ, and YC.
Competing interests
The authors declare no competing interests.
Footnotes
These authors contributed equally: Yu Zheng, Haihui Jiang, Naixue Yang.
Contributor Information
Song Lin, Email: linsong2005@126.com.
Xin Lin, Email: linxin307@tsinghua.edu.cn.
Supplementary information
The online version contains supplementary material available at 10.1038/s41423-023-01110-0.
References
- 1.Ostrom QT, Price M, Neff C, Cioffi G, Waite KA, Kruchko C, et al. CBTRUS Statistical Report: Primary Brain and Other Central Nervous System Tumors Diagnosed in the United States in 2015-2019. Neuro Oncol. 2022;24:v1–v95. doi: 10.1093/neuonc/noac202. [DOI] [PMC free article] [PubMed] [Google Scholar]
- 2.Tan AC, Ashley DM, Lopez GY, Malinzak M, Friedman HS, Khasraw M. Management of glioblastoma: State of the art and future directions. CA Cancer J Clin. 2020;70:299–312. doi: 10.3322/caac.21613.. [DOI] [PubMed] [Google Scholar]
- 3.Wefel JS, Noll KR, Scheurer ME. Neurocognitive functioning and genetic variation in patients with primary brain tumours. Lancet Oncol. 2016;17:e97–e108. doi: 10.1016/S1470-2045(15)00380-0.. [DOI] [PMC free article] [PubMed] [Google Scholar]
- 4.Weyer-Jamora C, Brie MS, Luks TL, Smith EM, Hervey-Jumper SL, Taylor JW. Postacute cognitive rehabilitation for adult brain tumor patients. Neurosurgery. 2021;89:945–53. doi: 10.1093/neuros/nyaa552.. [DOI] [PMC free article] [PubMed] [Google Scholar]
- 5.Jackson CM, Choi J, Lim M. Mechanisms of immunotherapy resistance: lessons from glioblastoma. Nat Immunol. 2019;20:1100–9. doi: 10.1038/s41590-019-0433-y.. [DOI] [PubMed] [Google Scholar]
- 6.Arvanitis CD, Ferraro GB, Jain RK. The blood-brain barrier and blood-tumour barrier in brain tumours and metastases. Nat Rev Cancer. 2020;20:26–41. doi: 10.1038/s41568-019-0205-x.. [DOI] [PMC free article] [PubMed] [Google Scholar]
- 7.Patel MA, Pardoll DM. Concepts of immunotherapy for glioma. J Neurooncol. 2015;123:323–30. doi: 10.1007/s11060-015-1810-5.. [DOI] [PMC free article] [PubMed] [Google Scholar]
- 8.Watowich, MB, Gilbert, MR, and Larion, M. T cell exhaustion in malignant gliomas. Trends Cancer. 10.1016/j.trecan.2022.12.008. (2023). [DOI] [PMC free article] [PubMed]
- 9.Kreatsoulas D, Bolyard C, Wu BX, Cam H, Giglio P, Li Z. Translational landscape of glioblastoma immunotherapy for physicians: guiding clinical practice with basic scientific evidence. J Hematol Oncol. 2022;15:80. doi: 10.1186/s13045-022-01298-0.. [DOI] [PMC free article] [PubMed] [Google Scholar]
- 10.Jiang H, Yu K, Cui Y, Ren X, Li M, Yang C, et al. Combination of immunotherapy and radiotherapy for recurrent malignant gliomas: Results From a prospective study. Front Immunol. 2021;12:632547. doi: 10.3389/fimmu.2021.632547.. [DOI] [PMC free article] [PubMed] [Google Scholar]
- 11.Deng S, Zhu S, Qiao Y, Liu YJ, Chen W, Zhao G, et al. Recent advances in the role of toll-like receptors and TLR agonists in immunotherapy for human glioma. Protein Cell. 2014;5:899–911. doi: 10.1007/s13238-014-0112-6.. [DOI] [PMC free article] [PubMed] [Google Scholar]
- 12.De Waele J, Marcq E, Van Audenaerde JR, Van Loenhout J, Deben C, Zwaenepoel K, et al. Poly(I:C) primes primary human glioblastoma cells for an immune response invigorated by PD-L1 blockade. Oncoimmunology. 2018;7:e1407899. doi: 10.1080/2162402X.2017.1407899.. [DOI] [PMC free article] [PubMed] [Google Scholar]
- 13.Salmon H, Idoyaga J, Rahman A, Leboeuf M, Remark R, Jordan S, et al. Expansion and activation of CD103(+) dendritic cell progenitors at the tumor site enhances tumor responses to therapeutic PD-L1 and BRAF inhibition. Immunity. 2016;44:924–38. doi: 10.1016/j.immuni.2016.03.012.. [DOI] [PMC free article] [PubMed] [Google Scholar]
- 14.Kees T, Lohr J, Noack J, Mora R, Gdynia G, Todt G, et al. Microglia isolated from patients with glioma gain antitumor activities on poly (I:C) stimulation. Neuro Oncol. 2012;14:64–78. doi: 10.1093/neuonc/nor182.. [DOI] [PMC free article] [PubMed] [Google Scholar]
- 15.Shime H, Matsumoto M, Oshiumi H, Tanaka S, Nakane A, Iwakura Y, et al. Toll-like receptor 3 signaling converts tumor-supporting myeloid cells to tumoricidal effectors. Proc Natl Acad Sci USA. 2012;109:2066–71. doi: 10.1073/pnas.1113099109.. [DOI] [PMC free article] [PubMed] [Google Scholar]
- 16.Wertel I, Surowka J, Polak G, Barczynski B, Bednarek W, Jakubowicz-Gil J, et al. Macrophage-derived chemokine CCL22 and regulatory T cells in ovarian cancer patients. Tumour Biol. 2015;36:4811–7. doi: 10.1007/s13277-015-3133-8.. [DOI] [PMC free article] [PubMed] [Google Scholar]
- 17.Rameshbabu, S, Labadie, BW, Argulian, A, and Patnaik, A. Targeting innate immunity in cancer therapy. Vaccines (Basel) 9. 10.3390/vaccines9020138. (2021). [DOI] [PMC free article] [PubMed]
- 18.Foo SL, Yap G, Cui J, Lim LHK. Annexin-A1 - A blessing or a curse in cancer? Trends Mol Med. 2019;25:315–27. doi: 10.1016/j.molmed.2019.02.004.. [DOI] [PubMed] [Google Scholar]
- 19.Garcia Pedrero JM, Fernandez MP, Morgan RO, Herrero Zapatero A, Gonzalez MV, Suarez Nieto C, et al. Annexin A1 down-regulation in head and neck cancer is associated with epithelial differentiation status. Am J Pathol. 2004;164:73–9. doi: 10.1016/S0002-9440(10)63098-2.. [DOI] [PMC free article] [PubMed] [Google Scholar]
- 20.Rodrigo JP, Garcia-Pedrero JM, Fernandez MP, Morgan RO, Suarez C, Herrero A. Annexin A1 expression in nasopharyngeal carcinoma correlates with squamous differentiation. Am J Rhinol. 2005;19:483–7. doi: 10.1177/194589240501900511. [DOI] [PubMed] [Google Scholar]
- 21.Lin Y, Lin G, Fang W, Zhu H, Chu K. Increased expression of annexin A1 predicts poor prognosis in human hepatocellular carcinoma and enhances cell malignant phenotype. Med Oncol. 2014;31:327. doi: 10.1007/s12032-014-0327-7.. [DOI] [PubMed] [Google Scholar]
- 22.Bai XF, Ni XG, Zhao P, Liu SM, Wang HX, Guo B, et al. Overexpression of annexin 1 in pancreatic cancer and its clinical significance. World J Gastroenterol. 2004;10:1466–70. doi: 10.3748/wjg.v10.i10.1466.. [DOI] [PMC free article] [PubMed] [Google Scholar]
- 23.Cheng TY, Wu MS, Lin JT, Lin MT, Shun CT, Huang HY, et al. Annexin A1 is associated with gastric cancer survival and promotes gastric cancer cell invasiveness through the formyl peptide receptor/extracellular signal-regulated kinase/integrin beta-1-binding protein 1 pathway. Cancer. 2012;118:5757–67. doi: 10.1002/cncr.27565.. [DOI] [PubMed] [Google Scholar]
- 24.Schittenhelm J, Trautmann K, Tabatabai G, Hermann C, Meyermann R, Beschorner R. Comparative analysis of annexin-1 in neuroepithelial tumors shows altered expression with the grade of malignancy but is not associated with survival. Mod Pathol. 2009;22:1600–11. doi: 10.1038/modpathol.2009.132.. [DOI] [PubMed] [Google Scholar]
- 25.Yang Y, Liu Y, Yao X, Ping Y, Jiang T, Liu Q, et al. Annexin 1 released by necrotic human glioblastoma cells stimulates tumor cell growth through the formyl peptide receptor 1. Am J Pathol. 2011;179:1504–12. doi: 10.1016/j.ajpath.2011.05.059.. [DOI] [PMC free article] [PubMed] [Google Scholar]
- 26.Cheng SX, Tu Y, Zhang S. FoxM1 promotes glioma cells progression by up-regulating Anxa1 expression. PLoS One. 2013;8:e72376. doi: 10.1371/journal.pone.0072376.. [DOI] [PMC free article] [PubMed] [Google Scholar]
- 27.Gavins FN, Hickey MJ. Annexin A1 and the regulation of innate and adaptive immunity. Front Immunol. 2012;3:354. doi: 10.3389/fimmu.2012.00354.. [DOI] [PMC free article] [PubMed] [Google Scholar]
- 28.Perretti M, D’Acquisto F. Annexin A1 and glucocorticoids as effectors of the resolution of inflammation. Nat Rev Immunol. 2009;9:62–70. doi: 10.1038/nri2470.. [DOI] [PubMed] [Google Scholar]
- 29.D’Acquisto F, Piras G, Rattazzi L. Pro-inflammatory and pathogenic properties of Annexin-A1: the whole is greater than the sum of its parts. Biochem Pharmacol. 2013;85:1213–8. doi: 10.1016/j.bcp.2013.02.011.. [DOI] [PubMed] [Google Scholar]
- 30.Boudhraa Z, Bouchon B, Viallard C, D’Incan M, Degoul F. Annexin A1 localization and its relevance to cancer. Clin Sci. 2016;130:205–20. doi: 10.1042/CS20150415.. [DOI] [PubMed] [Google Scholar]
- 31.Ji AL, Rubin AJ, Thrane K, Jiang S, Reynolds DL, Meyers RM, et al. Multimodal analysis of composition and spatial architecture in human squamous cell carcinoma. Cell. 2020;182:497–514.e422. doi: 10.1016/j.cell.2020.05.039.. [DOI] [PMC free article] [PubMed] [Google Scholar]
- 32.Zhou Y, Bian X, Le Y, Gong W, Hu J, Zhang X, et al. Formylpeptide receptor FPR and the rapid growth of malignant human gliomas. J Natl Cancer Inst. 2005;97:823–35. doi: 10.1093/jnci/dji142.. [DOI] [PubMed] [Google Scholar]
- 33.Woroniecka K, Chongsathidkiet P, Rhodin K, Kemeny H, Dechant C, Farber SH, et al. T-cell exhaustion signatures vary with tumor type and are severe in Glioblastoma. Clin Cancer Res. 2018;24:4175–86. doi: 10.1158/1078-0432.CCR-17-1846... [DOI] [PMC free article] [PubMed] [Google Scholar]
- 34.Le Naour J, Liu P, Zhao L, Adjemian S, Sztupinszki Z, Taieb J, et al. A TLR3 ligand reestablishes chemotherapeutic responses in the context of FPR1 deficiency. Cancer Discov. 2021;11:408–23. doi: 10.1158/2159-8290.CD-20-0465.. [DOI] [PubMed] [Google Scholar]
- 35.Okada H, Weller M, Huang R, Finocchiaro G, Gilbert MR, Wick W, et al. Immunotherapy response assessment in neuro-oncology: a report of the RANO working group. Lancet Oncol. 2015;16:e534–42. doi: 10.1016/S1470-2045(15)00088-1.. [DOI] [PMC free article] [PubMed] [Google Scholar]
- 36.Picelli S, Faridani OR, Bjorklund AK, Winberg G, Sagasser S, Sandberg R. Full-length RNA-seq from single cells using Smart-seq2. Nature Protocols. 2014;9:171–81. doi: 10.1038/nprot.2014.006... [DOI] [PubMed] [Google Scholar]
- 37.Yao L, Wang HM, Song YY, Sui GC. BioQueue: a novel pipeline framework to accelerate bioinformatics analysis. Bioinformatics. 2017;33:3286–8. doi: 10.1093/bioinformatics/btx403.. [DOI] [PubMed] [Google Scholar]
- 38.Shugay M, Bagaev DV, Turchaninova MA, Bolotin DA, Britanova OV, Putintseva EV, et al. VDJtools: Unifying post-analysis of T cell receptor repertoires. Plos Comput Biol. 2015;11:ARTN e1004503. doi: 10.1371/journal.pcbi.1004503.. [DOI] [PMC free article] [PubMed] [Google Scholar]
- 39.Butler A, Hoffman P, Smibert P, Papalexi E, Satija R. Integrating single-cell transcriptomic data across different conditions, technologies, and species. Nat Biotechnol. 2018;36:411–20. doi: 10.1038/nbt.4096.. [DOI] [PMC free article] [PubMed] [Google Scholar]
- 40.Stuart T, Butler A, Hoffman P, Hafemeister C, Papalexi E, Mauck WM, et al. Comprehensive integration of single-cell data. Cell. 2019;177:1888–1902.e1821. doi: 10.1016/j.cell.2019.05.031.. [DOI] [PMC free article] [PubMed] [Google Scholar]
- 41.Efremova M, Vento-Tormo M, Teichmann SA, Vento-Tormo R. CellPhoneDB: inferring cell-cell communication from combined expression of multi-subunit ligand-receptor complexes. Nat Protoc. 2020;15:1484–506. doi: 10.1038/s41596-020-0292-x.. [DOI] [PubMed] [Google Scholar]
- 42.Martin M. Cutadapt removes adapter sequences from high-throughput sequencing reads. EMBnet Journal. 2011;17:10–2. doi: 10.14806/ej.17.1.200.. [DOI] [Google Scholar]
- 43.Kim D, Langmead B, Salzberg SL. HISAT: a fast spliced aligner with low memory requirements. Nat Methods. 2015;12:357–60. doi: 10.1038/nmeth.3317.. [DOI] [PMC free article] [PubMed] [Google Scholar]
- 44.Anders S, Pyl PT, Huber W. HTSeq-a Python framework to work with high-throughput sequencing data. Bioinformatics. 2015;31:166–9. doi: 10.1093/bioinformatics/btu638.. [DOI] [PMC free article] [PubMed] [Google Scholar]
- 45.Love MI, Huber W, Anders S. Moderated estimation of fold change and dispersion for RNA-seq data with DESeq2. Genome Biol. 2014;15:550. doi: 10.1186/s13059-014-0550-8.. [DOI] [PMC free article] [PubMed] [Google Scholar]
- 46.Bindea G, Mlecnik B, Hackl H, Charoentong P, Tosolini M, Kirilovsky A, et al. ClueGO: a Cytoscape plug-in to decipher functionally grouped gene ontology and pathway annotation networks. Bioinformatics. 2009;25:1091–3. doi: 10.1093/bioinformatics/btp101.. [DOI] [PMC free article] [PubMed] [Google Scholar]
- 47.Chanput W, Mes JJ, Wichers HJ. THP-1 cell line: an in vitro cell model for immune modulation approach. Int Immunopharmacol. 2014;23:37–45. doi: 10.1016/j.intimp.2014.08.002.. [DOI] [PubMed] [Google Scholar]
- 48.Ma H, Li YN, Song L, Liu R, Li X, Shang Q, et al. Macrophages inhibit adipogenic differentiation of adipose tissue derived mesenchymal stem/stromal cells by producing pro-inflammatory cytokines. Cell Biosci. 2020;10:88. doi: 10.1186/s13578-020-00450-y.. [DOI] [PMC free article] [PubMed] [Google Scholar]
Associated Data
This section collects any data citations, data availability statements, or supplementary materials included in this article.