

Abstract
We provide a detailed protocol for imaging ATP-binding cassette subfamily G member 2 (ABCG2) function at the blood–brain barrier (BBB) of transgenic mice. d-Luciferin is specifically transported by ABCG2 found on the apical side of endothelial cells at the BBB. The luciferase–luciferin enzymatic reaction produces bioluminescence, which allows a direct measurement of ABCG2 function at the BBB. Therefore bioluminescence imaging (BLI) correlates with ABCG2 function at the BBB and this can be measured by administering luciferin in a mouse model that expresses luciferase in the brain parenchyma. BLI allows for a relatively low-cost alternative for studying transporter function in vivo compared to other strategies such as positron emission tomography. This method for imaging ABCG2 function at the BBB can be used to investigate pharmacokinetic inhibition of the transporter.
Keywords: d-Luciferin, BCRP, ABCG2, Optical imaging, Neuroimaging
1. Introduction
The blood–brain barrier (BBB) plays a vital role in protecting the central nervous system by preventing a variety of molecules from entering the brain. This protective barrier is mediated in part by ATP-binding cassette transporters, primarily P-glycoprotein and ABCG2, located on the apical membrane of capillary endothelial cells [1]. While protecting the brain, these transporters also restrict the delivery of potentially therapeutic molecules aimed at the management of neurologic disorders. As therapeutic molecules do not reach the brain parenchyma in clinically relevant concentrations, the BBB is a major obstacle to drug delivery to the brain.
Mouse models have been used to investigate ABCG2 function at the BBB, and the findings can be extrapolated to provide clinical relevance [2, 3]. The mouse ortholog of ABCG2 has 81 % protein sequence homology with human ABCG2 [4] and the substrate and inhibitor specificity of human and mouse ABCG2 is very similar [5]. Amino acid mutations have been shown to alter the substrate and antagonist specificity in both species [6]. The overlapping substrate and inhibitor specificity of human and mouse ABCG2 supports utilization of mouse models in understanding the functional roles of ABCG2.
This protocol describes a noninvasive imaging modality using d-Luciferin in transgenic mice. We have previously shown that d-Luciferin is a specific substrate of ABCG2 (and not other ABC transporters expressed at the BBB). Therefore, d-Luciferin can be used to study ABCG2 function at the BBB [7]. Real-time function at the BBB is often studied using positron emission tomography (PET) [8], but d-Luciferin is not amenable for radiotracer labeling. As such, we decided to take advantage of the fact that d-Luciferin is a substrate for the enzyme firefly luciferase (FLuc). In the presence of FLuc, ATP, and O2, d-Luciferin generates a photon of light (bioluminescence), and this can be detected with commercially available charge-coupled device detectors. To study the BBB function of ABCG2, we utilized a GFAP-FLuc transgenic mouse model [2], in which the expression of FLuc is controlled by the glial fibriliary acid protein (GFAP) promoter. GFAP is predominately expressed in astrocytes in the parenchyma of the brain [9] and is found behind the BBB. As luciferin is enzymatically converted to oxyluciferin, the production of bioluminescence can allow one to measure the amount of d-Luciferin in the brain parenchyma.
In this model, when d-Luciferin is injected into GFAP-FLuc transgenic mice, bioluminescent signal from the brain is low due to the efflux of d-Luciferin by Abcg2 at the BBB (see Fig. 1). However, in the presence of a pharmacologic blocker of ABCG2 (or some other mechanism for interfering with ABCG2 expression or function), d-Luciferin can cross the BBB and enter astrocytes in the brain, where FLuc is expressed. This results in an elevated bioluminescent signal. Previously, we have shown that a dose-dependent increase in bioluminescence from the brain can be observed with ABCG2 inhibitors of interest. These data can be used to calculate the effective dose of ABCG2 inhibition at the BBB in vivo. Therefore, bioluminescence imaging (BLI) of mice expressing the luciferase enzyme in the brain can be used to monitor ABCG2 function at the BBB. Here, we provide a detailed protocol for this assay of BBB function.
Fig. 1.

Scheme depicting the basis of the imaging protocol. ABCG2 transporters normally prevent d-Luciferin from crossing brain endothelial cells, by pumping it back from the apical membrane into the luminal space. However, when ABCG2 is inhibited, luciferin can cross the endothelial cells (BBB) and enter the parenchymal space. In astrocytes, firefly luciferase expressed under the GFAP promoter uses luciferin as a substrate, producing bioluminescence. The light generated can be captured by a sensitive optical camera and act as a surrogate indicator of luciferin uptake into the brain
2. Materials
2.1. Chemicals
The substrate, d-Luciferin (PerkinElmer (Waltham, MA)) (see Note 1).
-
There are several ABCG2 inhibitors that are commercially available. The potency and efficacy varies for each inhibitor (see Note 2).
Ko-143 (Tocris Bioscience (Minneapolis, MN)).
Nilotinib and gefitinib (Cayman Chemical (Ann Arbor, MI)).
Elacridar and tariquidar (MedKoo Biosciences (Chapel Hill, NC)).
2.2. In Vivo Studies
d-Luciferin solution is prepared by dissolving in saline to obtain 30 mg/mL stock solutions and stored at −20 °C protected from light (see Note 1).
As indicated by solubility profiles, candidate inhibitors of ABCG2 can be dissolved in appropriate stock solutions. For example, lipophilic molecules such as tariquidar and elacridar can be dissolved in vehicle containing 2:2:1 dimethyl sulfoxide, propylene glycol, and water (5 % Dextrose) (see Notes 2–6). Molecules that are more water-soluble can be prepared in normal saline solution and filtered as described for d-Luciferin above.
2.3. Anesthesia
The mice are administered isoflurane at 2–5 %. Procedures conducted with anesthesia can be done under low-pressure high flow ventilation hoods to collect excess isoflurane.
2.4. Animal Model
The FVB/N-Tg(GFAP-FLuc)-Xen mouse (Taconic Farms (Germantown, NY)). This is a transgenic mouse line that carries the firefly luciferase (FLuc) gene under the transcriptional control of the mouse GFAP promoter [2]. Expression of the reporter is observed primarily in the brain (see Note 7).
-
For mouse identification, two methods can be employed. For both methods, the identification is susceptible to loss of the identification marker over time, by falling or being torn out. Both can be purchased from Kent Scientific Corporation (Torrington, CT).
Ear tags—a metal ID can be placed on the pinna of the ear with an applicator.
Ear punch—ear notches or holes are placed with an ear punch device, following universal mouse numbering systems [10].
Prior to experiments, the weight of each mouse should be recorded.
2.5. Bioluminescence Imaging Unit
An IVIS spectrum and charged-coupled device (CCD) optical imaging system, Living Image Software (PerkinElmer, Waltham, Massachusetts) can be used for spatiotemporal detection and analysis of the luciferase - luciferin reaction in multiple mice.
3. Methods
3.1. Bioluminescence Imaging
Four to five mice should be used for each condition to reach statistical significance. Depending on the bioluminescence imaging unit housing, up to five mice can be simultaneously imaged. In addition, for each experimental run there should be at least one sham mouse receiving only luciferin and vehicle (see Fig. 2 and Notes 8 and 9).
Anesthesia is induced in a chamber with 2–5 % isoflurane in O2. Anesthesia is maintained with 2 % isoflurane via a nosecone, for the duration of the procedure.
Responses to anesthesia can be monitored by changes in physiological parameters including: respiratory rate, evidence of sensation, and reflex.
Body temperature of the animal can be maintained by use of a heated circulating water pad, heated air, heat lamp, or heated platform.
Measure baseline bioluminescence from the brain of each mouse (without co-injected inhibitor or vehicle).
Specify the appropriate acquisition settings (Exposure time, Binning, F/stop) (see Note 10).
Administer 18 mg/kg of d-Luciferin via intraperitoneal (i.p.) injections using a 25-gauge needle (see Table 1 and Notes 11 and 12).
Immediately place mice in the IVIS100 optical imaging system (PerkinElmer, Waltham, Massachusetts), in a supine position (i.e., lying on the back) and record bioluminescent signal for 60 min with sequential acquisitions at 1 min intervals (see Notes 12–14).
At least 24 h following step 2, animals are again anesthetized (see step 1), temporarily placed under a heating lamp to dilate the lateral tail veins and to facilitate ease of i.v. injections (see Notes 15–17). Inhibitors are administered by tail vein injections using a 30½-gauge needle (see Notes 17–19).
Exactly 10 min following step 3, the inhibitor injections are followed by i.p. injections of d-Luciferin, (100 μL for 18 mg/kg) using a 25-gauge needle (see Note 20).
The mice are then immediately placed in the optical imaging system in a supine position. While anesthesia is maintained in the imaging unit with 2 % isoflurane with nose cones, bioluminescent signals are recorded in 60-min sequential acquisitions with 1-min intervals using IVIS100 (PerkinElmer) (see Note 21).
After the imaging procedure (60 min), the mice are removed from the imaging system, placed in animal cages, and monitored to ensure they are not displaying any signs of distress.
Fig. 2.

Scheme demonstrating experimental and control setup with dosages. Either the vehicle or nothing is injected for option A and mice are injected with luciferin for all experimental conditions
Table 1.
Luciferin injection calculations for mice of varying weights. Required luciferin stock for injection is supplemented with saline, making up a total 100 μL injection volume
| Desired dose (mg/kg) | Luciferin stock solution (mg/mL) | Mouse weight (g) | Luciferin needed (mg) | Volume of luciferin stock (μL) | Saline (μL) | Total injection volume (μL) |
|---|---|---|---|---|---|---|
|
| ||||||
| 18 | 10 | 35 | 0.63 | 63 | 37 | 100 |
| 18 | 10 | 34 | 0.61 | 61.2 | 38.8 | 100 |
| 18 | 10 | 33 | 0.59 | 59.4 | 40.6 | 100 |
| 18 | 10 | 32 | 0.58 | 57.6 | 42.4 | 100 |
| 18 | 10 | 31 | 0.56 | 55.8 | 44.2 | 100 |
| 18 | 10 | 30 | 0.54 | 54 | 46 | 100 |
| 18 | 10 | 29 | 0.52 | 52.2 | 47.8 | 100 |
| 18 | 10 | 28 | 0.50 | 50.4 | 49.6 | 100 |
| 18 | 10 | 27 | 0.49 | 48.6 | 51.4 | 100 |
| 18 | 10 | 26 | 0.47 | 46.8 | 53.2 | 100 |
| 18 | 10 | 25 | 0.45 | 45 | 55 | 100 |
3.2. Analysis of BLI Data
To quantify the light output from the mouse brain region, define a consistent region of interest (ROI) over the cranium and examine all bioluminescence values in the same ROI in sequential images using LivingImage software (PerkinElmer, Waltham, Massachusetts) (see Notes 21 and 22).
Each data point is corrected for the respective mouse’s baseline signal level (without inhibitor) generated in step 2, and background autoluminescence (see Notes 23–25).
Time-activity curves can be created for each mouse by plotting the total flux (photon/s) versus time (min).
The area under the time-activity-curve (AUC, p/s · min) can be calculated by the trapezoidal method using Prism 6.0 (GraphPad software).
If varying doses of the inhibitor are tested, the effective concentration where 50 % (EC50) of maximal bioluminescence is achieved can be calculated. The area under the time-activity-curve is plotted against the concentration of inhibitor used, and the EC50 can be calculated with Prism 6.0 (GraphPad software).
After the data are tested for homogeneity of variance, differences in mean AUC (p/s · min) can be compared using a one-way analysis of variance followed by the Bonferroni post-t test for multiple comparisons (α = 0.05).
4. Notes
Luciferin absorbs light maximally at a wavelength of 350 nm [11], which can result in photodegradation from natural light exposure. In a laboratory setting, wrapping the solution vessel in aluminum foil, or using a brown glass vial, ensures protection from incident light.
Ko-143 is a potent ABCG2 inhibitor [12]. Gefitinib, nilotinib [13], tariquidar [14] and elacridar [15] are dual ABCG2 and P-gp inhibitors. Ko-143, gefitinib, and nilotinib were shown to inhibit ABCG2 at the BBB, indicated by increased bioluminescent signal in the GFAP-FLuc animal model [5]. Elevated bioluminescence was not observed with tariquidar or elacridar (they are shown to be more efficacious inhibitors of P-gp than ABCG2). In our original study, DCPQ, a specific P-gp inhibitor, was used as a negative control, in addition to administering vehicle-only. As DCPQ is not commercially available, an alternate specific high-affinity P-gp inhibitor may be utilized such as zosuquidar, cyclosporin A, or verapamil [16]. It is critical to confirm that P-gp inhibitors intended to be used as negative controls do not interfere with ABCG2 function in vitro.
Prepare stock solutions of the inhibitors that will allow you to inject 100 μL volumes by direct tail vein injections of 4, 6, 8, 16, and 32 mg/kg. To achieve this, first prepare stock solutions of 25 mg/mL inhibitor in 1:1 dimethyl sulfoxide and propylene glycol. These can be stored at −20 °C. To prepare injectable solutions, dilute with additional 2:2:1 dimethyl sulfoxide, propylene glycol, and water (5 % Dextrose) (see Table 2 for sample calculations for preparing inhibitor solutions for an average 30 g mouse). Saline is not used in preparation of the stock solution to avoid precipitation and hydrolysis of inhibitors, but is used for dilution of stock solution and for preparation of injectable inhibitor solution. The numbers displayed in Table 2 can be scaled based on the total number of mice to be injected for each condition. The injection volume is kept at 100 μL to limit the volume of vehicle administration and to keep the total volume of solution administration (including inhibitor and luciferin substrate) below 200 μL (maximum amount allowed for injection).
It is important to use an agent that does not physically disrupt the BBB, which may confound the results by providing an alternate route for luciferin to bypass the BBB. If necessary, to evaluate BBB disruption one may use Evans blue (see Note 5) or sodium fluorescein (see Note 6) to determine increased brain penetration following injection of a test agent [17, 18].
Evans blue is a marker that binds albumin avidly in blood plasma. Albumin has a 60 kDa molecular weight, and does not cross the BBB. A detailed protocol is provided in [17]. Briefly, 2 mL/kg of a 2 % (w/v) solution of Evans blue in saline is administered i.v. with a 25-gauge needle. Evans blue is allowed to circulate for 30 min before mice are euthanized and the brain extracted. An analog scale-based evaluation of the intensity and distribution of the bluish coloration is used to evaluate the degree of the BBB permeabilization.
A spectrophotofluorimetric sodium flourescein uptake measurement (excitation at 440 nm and emission at 525 nm) enables detection of subtle alterations in BBB permeability. A detailed protocol is provided in ref. 18. It is suggested that changes in BBB permeability to sodium fluorescein may be the earliest and the most sensitive indicator of BBB disruption and therefore in many instances. Briefly, 2 mL/kg of a 2 % [wt: vol] solution in saline can be administered at a dose of 5 mL/kg body weight of animal i.p. with a 25-gauge needle. Sodium fluorescein is allowed to circulate for 30 min before mice are euthanized.
This model was generated for the study of transcriptional regulation of the GFAP gene [9], for example, to observe changes in expression associated with kainic acid-induced astrogliosis [2]. In the protocol reported here, we use the same mouse strain to indicate the ability of d-Luciferin to cross the BBB using baseline expression, and do not require induction of expression by inflammatory processes such as kainic acid.
d-Luciferin i.p only (control B in Fig. 2) can serve as a control for bioluminescent variations that may be caused by experimental error in the amount of luciferin injected, or other causes.
Administering luciferin via i.p. injection is the standard route of administration in in vivo studies. Intravenous injections of d-Luciferin are possible, but introduce a more technically demanding protocol, including more injections, tail catheter line placements, and catheter or needle ‘clogging’ due to precipitation of solutions. Another disadvantage of i.v. injections is the fast kinetics/clearance with the lack of a plateau phase, which may not provide sufficient time to saturate luciferin at the site of interest (brain), impeding reproducible measurements and leading to additional error [19].
The acquisition setting is adjusted to produce a signal above the noise/background, but less than the detection limit (60 K counts) of the camera. A higher binning increases the pixel size at the loss of spatial resolution. ‘F/stop’ sets the size of the camera aperture and the amount of light that is collected. Therefore, a larger lens opening (f/1) will maximize sensitivity.
Instead of the 150 mg/kg of d-Luciferin used in a standard BLI protocol [19], 18 mg/kg of d-Luciferin is used, as it produces a low baseline signal from the brain region [7]. This lower dose is used to avoid saturating ABCG2 transporters at the BBB while increasing the sensitivity to detect changes in bioluminescent signal produced by inhibiting ABCG2 function. Prior to performing functional studies, an experiment can be performed with mice injected with a range of luciferin doses (for example, 150, 80, 40, 20, 10, and 5 mg/kg d-Luciferin) to ensure a dose is utilized that produces a low baseline signal with the instrument and settings being used.
It is important to measure baseline bioluminescence under identical conditions, since anesthesia induces changes in the blood flow of the animal, and may alter the pharmacokinetics of d-Luciferin and subsequent bioluminescence production.
The photon emission in living brain tissue is limited substantially by anatomical layers. BLI signal from the ventral brain is higher [20] and signal does arise from the cochlear spiral ganglion [21]; therefore mice are imaged in the supine position (i.e., on their back).
The body of the mice can be covered with black construction paper, exposing only the head region. This reduces any bioluminescence signal that may be produced from the periphery. The GFAP-FLuc mouse model produces a low-level signal from the exposed skin regions (tail and foot pads).
Tail vein injections are technically demanding and require practice and accuracy to correctly perform them. This technique can be performed after anesthesia induction; however, it can also be performed without anesthesia when using proper restraining devices.
To help locate the lateral veins, a heated stage or heat lamp may be utilized to dilate the vasculature. Hold the tail so that the lateral vein is uppermost and insert the needle. Draw back on the syringe slightly to make sure the needle is inserted in the blood vessel, indicated by blood being drawn. In the event that the injected agent is not introduced to the vein, the surrounding tissue will blanch.
It is advised to use a small volume syringe with attached needles (Becton, Dickinson and Company), as the ‘dead space’ volume is lower, increasing accuracy of injections and minimizing wastage of injectable solutions. Care should be taken to remove air bubbles in the syringe.
Alternatively, a tail vein catheter with minimal dead space may be used for rapid near-simultaneous injection to multiple mice. However, the catheters need to be coated with heparin to avoid clogging of the catheter. One should be cautious with coating the catheters with heparin in a saline solution, because this may cause precipitation of the lipophilic inhibitor agent during the injection process.
To help administer the inhibitor to multiple mice within a short time interval, the “snipped glove” technique may be employed. A glove is snugly placed around the anesthesia tubing and taped securely in place. The finger tips of the glove are then snipped, and each finger opening acts as a different outlet or nose cone to be fitted loosely around the muzzle of each mouse for anesthesia maintenance on the benchtop.
The time delay between inhibitor injection, luciferin injection, and acquisition is recorded during each BLI experiment and can be used for time-line correction (acquisition time = 60 min), enabling precise data evaluation.
The optical signal intensity is expressed as photon flux (photon count/s). Each image can be displayed as a pseudo-colored photon-count image superimposed onto a grayscale anatomic image of the same animal (see Fig. 3).
While outside the scope of the protocol described here, an ex vivo confirmation that the signal from the ROI can be performed. Steps 1–6 are completed as described, except mice are imaged for 20–25 min only. This is the time period where maximal bioluminescence has been shown [7, 19]. The mice are immediately sacrificed; brains are removed and placed in the imaging unit for BLI. Mice with similar baseline bioluminescent signals and weight should be utilized. Four to five mice are needed for each group. The ratio between in vivo and ex vivo imaging of mice receiving luciferin only and luciferin + inhibitor should be similar. In addition, a statistical difference in bioluminescence between luciferin only and luciferin + inhibitor can be captured ex vivo.
Each animal serves as its own control. For example, the production of bioluminescence with luciferin only by animal A is X, and the production of bioluminescence with luciferin + inhibitor by animal A is Υ; the fold signal change (Υ/X) can be calculated for each animal and then averaged across multiple animals receiving the same inhibitor.
Further, a control animal (luciferin without inhibitor) should be utilized in each experimental protocol to act as an indicator of potential confounding factors. For example, on Day 1 the production of bioluminescence with luciferin only is X by animal B, on Day 2 this is repeated and the production of bioluminescence is Z by animal B. The standard variation in signals with luciferin injection is Z/X (<1.1 fold change is ideal), and should be taken into consideration for each run.
All datasets should be corrected for background autoluminescence. To accomplish this, a separate region of interest can be drawn outside the targeted region of interest to calculate fluctuations in the background signal. This measurement can be subtracted from the readings during that run.
Table 2.
Sample calculations for preparation of injectable solutions of ABCG2 inhibitors
| Inhibitor stock solution | Injectable solution | |||||||
|---|---|---|---|---|---|---|---|---|
|
| ||||||||
| Desired dose (mg/kg) | Mouse weight (g) | Inhibitor needed (mg) | Inhibitor stock solution (mg/ mL) | Stock solution to use (μL) | DMSO (μL) | PEG (μL) | Saline (μL) | Total injection volume (μL) |
|
| ||||||||
| 32 | 30 | 0.96 | 25 | 38.4 | 20.8 | 20.8 | 20 | 100 |
| 16 | 30 | 0.48 | 20 | 24 | 28 | 28 | 20 | 100 |
| 8 | 30 | 0.24 | 10 | 24 | 28 | 28 | 20 | 100 |
| 4 | 30 | 0.12 | 5 | 24 | 28 | 28 | 20 | 100 |
The numbers displayed can be scaled based on the total number of mice to be injected for each condition. Stock solutions of inhibitor are prepared in a 1:1 dimethyl sulfoxide and propylene glycol solution for storage, and prepared for injection immediately prior to the experiment
Fig. 3.
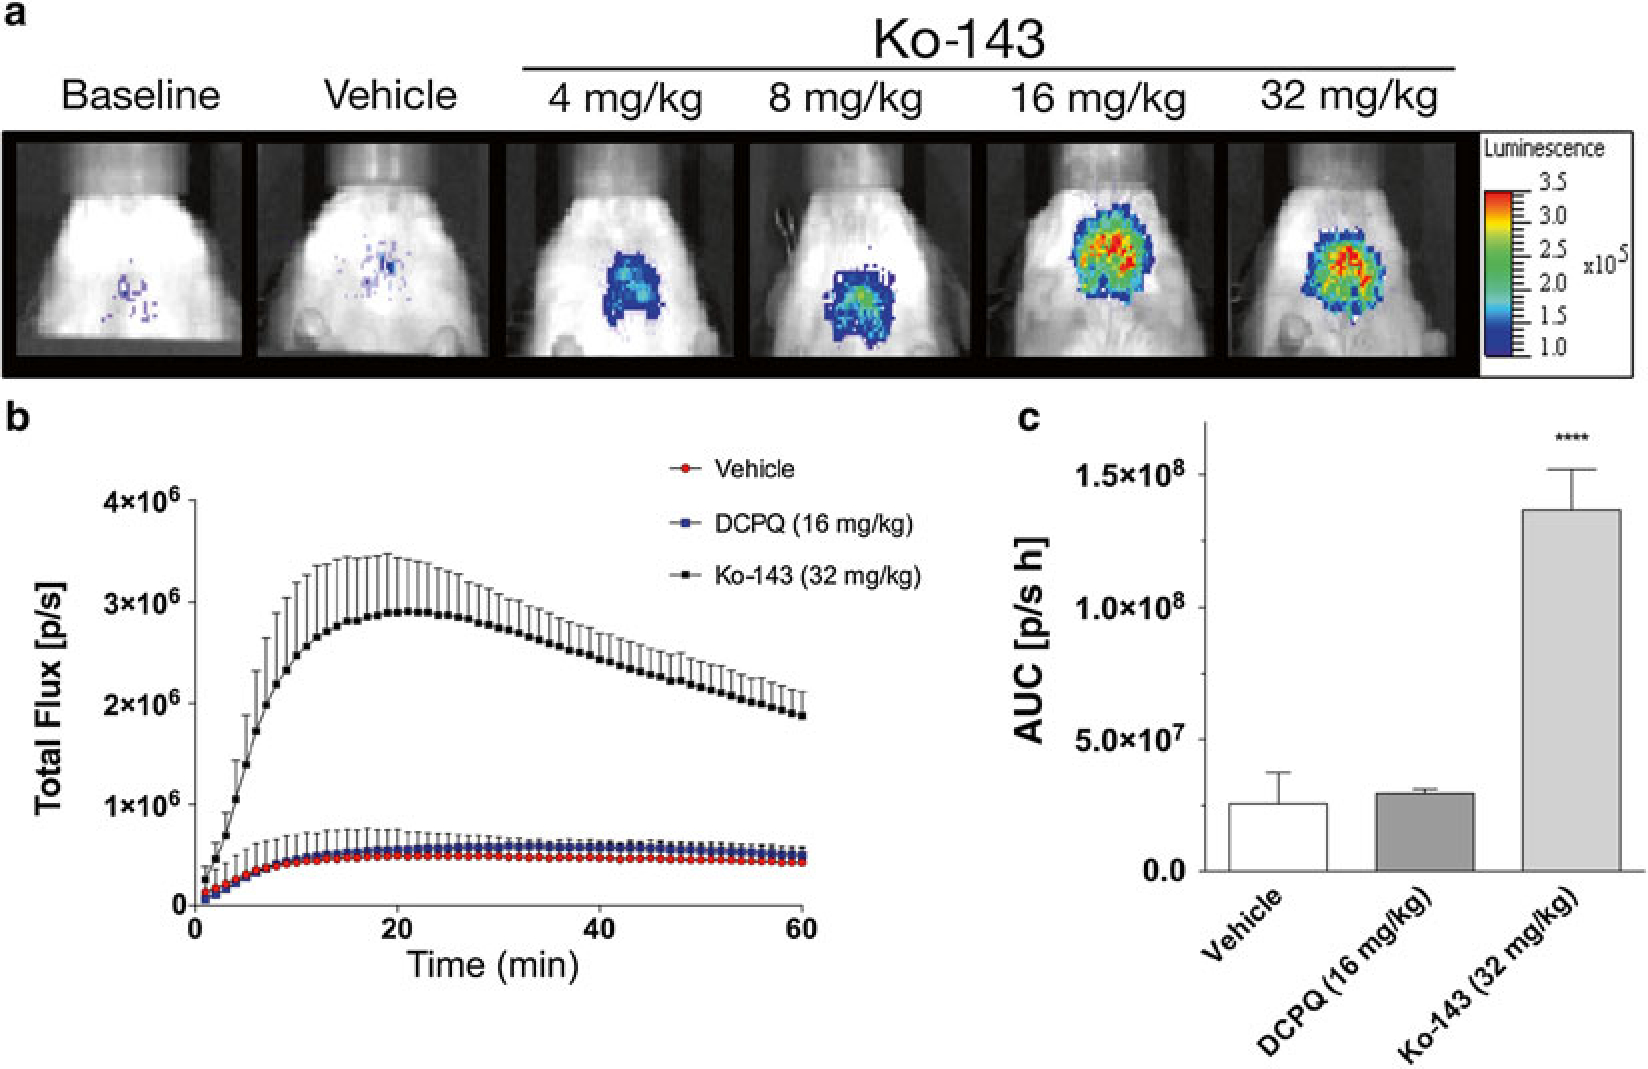
Ko-143 produces a dose-dependent increase in bioluminescence in vivo. Mice were measured at baseline (receiving luciferin only), and then measured again with vehicle-only or different Ko-143 concentrations prior to receiving luciferin. (a) Representative pseudo-colored photon-count images of bioluminescence measurements from the same region of interest (ROI) and animal under different experimental conditions. (b) Analyses of the dynamic total flux (photons/s), also referred to as the time-activity curve, from the ROI (brain region) measured at 1-min intervals for 60 min after d-Luciferin administration. Mice were administered either vehicle, DCPQ (P-gp inhibitor) or Ko-143 before d-Luciferin. Data represent means ± SD of four experiments (n = 4). The area under the curve (AUC) can be calculated from the time-activity-curve. (c) Calculated AUC (photon/s h) for each of the conditions are displayed. Data represent means ± SD of four experiments (****P < 0.0001)
Acknowledgments
We thank Mr. George Leiman for editorial assistance. This research was supported by the Intramural Research Program of the National Institutes of Health (NIH), National Cancer Institute. Joshua Bakhsheshian is a NIH Medical Research Scholar. The Medical Research Scholars Program is a public–private partnership supported jointly by the NIH and contributions to the Foundation for the NIH from Pfizer, the Leona M. and Harry B. Helmsley Charitable Trust, the Howard Hughes Medical Institute, as well as other private donors (listed at www.fnih.org/work/programs-development/medicalresearch-scholars-program).
References
- 1.Hartz AM, Bauer B (2010) Regulation of ABC transporters at the blood-brain barrier: new targets for CNS therapy. Mol Interv 10:293–304 [DOI] [PubMed] [Google Scholar]
- 2.Zhu L, Ramboz S, Hewitt D, Boring L, Grass DS, Purchio AF (2004) Non-invasive imaging of GFAP expression after neuronal damage in mice. Neurosci Lett 367:210–212 [DOI] [PubMed] [Google Scholar]
- 3.Vlaming ML, Lagas JS, Schinkel AH (2009) Physiological and pharmacological roles of ABCG2 (BCRP): recent findings in Abcg2 knockout mice. Adv Drug Deliv Rev 61:14–25 [DOI] [PubMed] [Google Scholar]
- 4.Allen JD, Brinkhuis RF, Wijnholds J, Schinkel AH (1999) The mouse Bcrp1/Mxr/Abcp gene: amplification and overexpression in cell lines selected for resistance to topotecan, mitoxantrone, or doxorubicin. Cancer Res 59:4237–4241 [PubMed] [Google Scholar]
- 5.Bakhsheshian J, Hall MD, Robey RW, Herrmann MA, Chen JQ, Bates SE, Gottesman MM (2013) Overlapping substrate and inhibitor specificity of human and murine ABCG2. Drug Metab Dispos 41:1805–1812 [DOI] [PMC free article] [PubMed] [Google Scholar]
- 6.Robey RW, Honjo Y, Morisaki K, Nadjem TA, Runge S, Risbood M, Poruchynsly MS, Bates SE (2003) Mutations at amino-acid 482 in the ABCG2 gene affect substrate and antagonist specificity. Br J Cancer 89:1971–1978 [DOI] [PMC free article] [PubMed] [Google Scholar]
- 7.Bakhsheshian J, Wei BR, Chang KE, Shukla S, Ambudkar SV, Simpson RM, Gottesman MM, Hall MD (2013) Bioluminescent imaging of drug efflux at the blood-brain barrier mediated by the transporter ABCG2. Proc Natl Acad Sci U S A 110:20801–20806 [DOI] [PMC free article] [PubMed] [Google Scholar]
- 8.Kannan P, John C, Zoghbi SS, Halldin C, Gottesman MM, Innis RB, Hall MD (2009) Imaging the function of P-glycoprotein with radiotracers: pharmacokinetics and in vivo applications. Clin Pharmacol Ther 86:368–377 [DOI] [PMC free article] [PubMed] [Google Scholar]
- 9.Bignami A, Eng LF, Dahl D, Uyeda CT (1972) Localization of the glial fibrillary acidic protein in astrocytes by immunofluorescence. Brain Res 43:429–435 [DOI] [PubMed] [Google Scholar]
- 10.Dickie M (1975) Keeping records in biology of the laboratory Mouse. Dover Publications, New York, NY [Google Scholar]
- 11.Bowie LJ (1978) Synthesis of firefly luciferin and structural analogs. Methods Enzymol 57:15–28 [Google Scholar]
- 12.Allen JD, van Loevezijn A, Lakhai JM, van der Valk M, van Tellingen O, Reid G, Schellens JH, Koomen GJ, Schinkel AH (2002) Potent and specific inhibition of the breast cancer resistance protein multidrug transporter in vitro and in mouse intestine by a novel analogue of fumitremorgin C. Mol Cancer Ther 1:417–425 [PubMed] [Google Scholar]
- 13.Ozvegy-Laczka C, Hegedus T, Varady G, Ujhelly O, Schuetz JD, Varadi A, Kéri G, Orfi L, Német K, Sarkadi B (2004) High-affinity interaction of tyrosine kinase inhibitors with the ABCG2 multidrug transporter. Mol Pharmacol 65:1485–1495 [DOI] [PubMed] [Google Scholar]
- 14.Kannan P, Telu S, Shukla S, Ambudkar SV, Pike VW, Halldin C, Gottesman MM, Innis RB, Hall MD (2011) The “specific” P-glycoprotein inhibitor Tariquidar is also a substrate and an inhibitor for breast cancer resistance protein (BCRP/ABCG2). ACS Chem Neurosci 2:82–89 [DOI] [PMC free article] [PubMed] [Google Scholar]
- 15.Agarwal S, Sane R, Gallardo JL, Ohlfest JR, Elmquist WF (2010) Distribution of gefitinib to the brain is limited by P-glycoprotein (ABCB1) and breast cancer resistance protein (ABCG2)-mediated active efflux. J Pharmacol Exp Ther 334:147–155 [DOI] [PMC free article] [PubMed] [Google Scholar]
- 16.Shepard RL, Cao J, Starling JJ, Dantzig AH (2003) Modulation of P-glycoprotein but not MRP1- or BCRP-mediated drug resistance by LY335979. Int J Cancer 103:121–125 [DOI] [PubMed] [Google Scholar]
- 17.Manaenko A, Chen H, Kammer J, Zhang JH, Tang J (2011) Comparison Evans Blue injection routes: intravenous versus intraperitoneal, for measurement of blood-brain barrier in a mice hemorrhage model. J Neurosci Methods 195:206–210 [DOI] [PMC free article] [PubMed] [Google Scholar]
- 18.Morrey JD, Olsen AL, Siddharthan V, Motter NE, Wang H, Taro BS, Chen D, Ruffner D, Hall JO (2008) Increased blood-brain barrier permeability is not a primary determinant for lethality of West Nile virus infection in rodents. J Gen Virol 89:467–473 [DOI] [PubMed] [Google Scholar]
- 19.Aswendt M, Adamczak J, Couillard-Despres S, Hoehn M (2013) Boosting bioluminescence neuroimaging: an optimized protocol for brain studies. PLoS One 8:e55662. [DOI] [PMC free article] [PubMed] [Google Scholar]
- 20.Kadurugamuwa JL, Modi K, Coquoz O, Rice B, Smith S, Contag PR, Purchio T (2005) Reduction of astrogliosis by early treatment of pneumococcal meningitis measured by simultaneous imaging, in vivo, of the pathogen and host response. Infect Immun 73:7836–7843 [DOI] [PMC free article] [PubMed] [Google Scholar]
- 21.Kanzaki S, Fujioka M, Yasuda A, Shibata S, Nakamura M, Okano HJ, Ogawa K, Okano H (2012) Novel in vivo imaging analysis of an inner ear drug delivery system in mice: comparison of inner ear drug concentrations over time after transtympanic and systemic injections. PLoS One 7:e48480. [DOI] [PMC free article] [PubMed] [Google Scholar]