

Abstract
How enhancers activate their distal target promoters remains incompletely understood. Here we dissect how CTCF-mediated loops facilitate and restrict such regulatory interactions. Using an allelic series of mouse mutants, we show that CTCF is neither required for the interaction of the Sox2 gene with distal enhancers, nor for its expression. Insertion of various combinations of CTCF motifs, between Sox2 and its distal enhancers, generated boundaries with varying degrees of insulation that directly correlated with reduced transcriptional output. However, in both epiblast and neural tissues, enhancer contacts and transcriptional induction could not be fully abolished, and insertions failed to disrupt implantation and neurogenesis. In contrast, Sox2 expression was undetectable in the anterior foregut of mutants carrying the strongest boundaries, and these animals fully phenocopied loss of SOX2 in this tissue. We propose that enhancer clusters with a high density of regulatory activity can better overcome physical barriers to maintain faithful gene expression and phenotypic robustness.
Enhancers can control precise spatial and temporal gene expression across large genomic distances. Therefore, the mechanisms of nuclear organization that guide enhancers to their target promoters, while preventing off-target activation, are instrumental components of gene regulation1,2. Genome folding by the combined action of the cohesin complex and CTCF has been shown to facilitate enhancer recruitment when CTCF binding occurs proximal to promoters3–7. CTCF can block extrusion of chromatin by cohesin in an orientation-dependent manner, leading to close physical association of loci with convergent CTCF motifs, which become the anchors of a DNA loop8–12. Enhancer–promoter interactions driven by CTCF-independent mechanisms are less well defined but include molecular bridges such as LDB1, YY1 and the mediator complex13–15. In addition, enhancer–promoter contacts can be induced by the act of transcription itself and spatial clustering of chromatin regions bound by the same transcription factors (TFs), chromatin regulators and with similar histone modifications16–20.
CTCF-mediated loops have also been shown to restrict enhancer–promoter interactions across their anchors. CTCF motifs are frequently enriched at the boundaries of topologically associating domains (TADs)—defined as regions of high self-interaction, insulated from their genomic neighbors—and most enhancer–promoter pairs are found within the same domain21–25. Deletion of some domain boundaries can expose promoters to neighboring enhancers, causing ectopic gene activation and developmental phenotypes26–29. At other loci, however, domain disruption has only modest or no measurable impact on gene expression and animal physiology30–35. These opposing observations highlight our incomplete understanding of how the interplay of enhancer–promoter interactions and CTCF-mediated loops contributes to gene regulation36–38.
To understand the impact of three-dimensional (3D) chromatin structure on Sox2 expression, we generated an allelic series of mouse mutants with deletions of CTCF motifs or with insertions of ectopic CTCF loops with varying degrees of insulation. We show that the role of CTCF in creating insulation can be decoupled from its potential function in the recruitment of enhancers controlling Sox2. We also found that the ability to overcome ectopic CTCF boundaries is tissue-specific, which allowed us to start dissecting the molecular principles determining how enhancer–promoter contacts contribute to phenotypic robustness upon perturbations of chromosomal structure.
Results
Sox2 expression in the epiblast requires the distal SCR enhancer
SOX2 is an essential TF for the pluripotent state of cultured embryonic stem (ES) cells and the epiblast of pre-implantation embryos39. Up to 95% of Sox2 expression in ES cells is induced by the Sox2 control region (SCR), a 12-kb enhancer cluster located 100 kb downstream of Sox2 (refs. 40–43), which is active specifically in pluripotent cells (Fig. 1a and Extended Data Fig. 1a). In ES cells, the TAD harboring Sox2 is delimited on the centromeric end by three CTCF motifs directly upstream of Sox2, and by SCR and its central CTCF motif on the telomeric end. To characterize the function of SCR in vivo, we generated the SCRΔ mouse line by injecting zygotes with Cas9 and gRNAs surrounding SCR (Extended Data Fig. 1b).
Fig. 1 |. SCR is required for Sox2 expression in epiblast cells.

a, CHi-C 1D interaction frequency heatmap in WT mES cells (top). Black arrowhead points to the center of the Sox2–SCR interaction and this corner signal overlaps with CTCF binding suggesting the formation of a CTCF-mediated loop. Publicly available ChIP-seq of RAD21, CTCF and NIPBL as well as CUT&RUN of H3K27ac in mES cells are shown at the bottom. CTCF motif orientation (red and blue arrowheads) is shown for significant CTCF motifs (Q < 0.05) as detected by FIMO. Shaded box shows deleted region in SCRΔ mice. b, qPCR analysis of Sox2 expression in blastocysts at E3.5 was done using the ΔΔCT method and Gapdh as a reference. Sox2 expression was calculated by comparing it to the median of all analyzed WT embryos. Each dot represents a single blastocyst. The number of biologically independent blastocysts (n) analyzed of each genotype is shown in the legend. Boxplots show minimum, maximum, median, first and third quartiles. A Wilcoxon two-sided test was performed to assess statistical significance. Het, heterozygous; Hom, homozygous. c, E6.5–E7.5 embryos were stained for GATA4, T and SOX2. Eight of nine SCRΔ homozygotes showed arrested development shortly after implantation and failed to initiate gastrulation as shown by T expression. Eight of eight WT and heterozygotes displayed correct pattern of T expression. Scale bars, 80 μm.
Homozygous loss of SCR in blastocysts at embryonic day (E) 3.5 caused a dramatic reduction of Sox2 expression (Fig. 1b). We asked whether SCR deletion caused most cells to lose SOX2 protein or if, instead, a few cells expressed normal amounts of SOX2 while others expressed none. To answer this, and assess if less SOX2 affected pre-implantation lineage fate decisions, we quantified the expression of markers of the epiblast (SOX2 and NANOG) and primitive endoderm (GATA6)44,45. At E4.5, we did not find a difference in number of SOX2-expressing cells in SCRΔ homozygotes compared to wild-type littermates but most cells showed a stark reduction in their ability to express high levels of SOX2 (Extended Data Fig. 1c). In contrast to what has been described for complete SOX2 ablation46, homozygous loss of SCR did not affect the expression of NANOG and GATA6, nor the ability of embryos to specify cells with divergent expression pattern of these TFs.
The marked SOX2 decrease in SCRΔ homozygotes was nevertheless sufficient to disrupt embryo development shortly after implantation, phenocopying Sox2 knockout animals. Embryos isolated at E6.5–E7.5 displayed developmental arrest, with 8/9 homozygotes failing to express BRACHYURY (T), a marker of mesoderm differentiation and gastrulation (Fig. 1c). These data confirm that SCR is essential for Sox2 expression during pre-implantation and postimplantation and establish this enhancer–promoter pair as an excellent model to study distal gene regulation in vivo.
SCR activates Sox2 expression independently of CTCF
CTCF binds upstream of Sox2 at a cluster of three motifs and at the center of SCR (Fig. 2a). The motif closest to Sox2 is in convergent orientation with the motif at SCR, and the Sox2–SCR interaction frequency is highest at the CTCF motif within SCR (see arrowhead in Figs. 1a and 2c). This suggests that CTCF-mediated loops may play an important role in this interaction and regulation of Sox2 expression. To test this, we generated two mouse lines where CTCF motifs at the two ends of the domain were deleted (Extended Data Fig. 2a). At the Sox2 end, we removed the entire cluster of three divergent CTCF motifs (referred to here as C2, C3 and C4). The goal of this large deletion—named CTCFΔ(C2–C4)—was to ensure the complete loss of cohesin retention upstream of the promoter and disrupt CTCF-mediated loops with motifs both upstream and downstream of Sox2 (refs. 47,48). Although this deletion removes a portion of the lncRNA Sox2ot, as well as binding sites for NANOG, OCT4 and SOX2, this region has been shown to be dispensable for mouse development49,50. The other mouse line—named CTCFΔ(C5)—was generated by replacing the CTCF motif at SCR by a sequence of the same size and similar GC content.
Fig. 2 |. SCR activates Sox2 expression independently of CTCF.

a, CHi-C 1D interaction frequency heatmaps in homozygotic CTCFΔ(C2–C4) and CTCFΔ(C5) mES cells, compared to WT. Rectangles represent the Sox2–SCR interaction. Insulation scores for 5-kb windows in this region are shown below publicly available CTCF and H3K27ac enrichment tracks. Lower scores represent higher insulation. b, Differential CHi-C interaction frequency heatmap. Red signal represents interactions occurring at higher frequency in mutant cell lines compared to control and the blue shows interactions of lower frequency. Dashed lines represent the Sox2–SCR domain as detected in WT control cells. c, Virtual 4C plots using the Sox2 and SCR viewpoints. Region surrounding viewpoint was removed from the analysis. Dashed lines highlight SCR in the Sox2 viewpoint (top) and Sox2 in the SCR viewpoint (bottom). Virtual 4C signal is shown as the average of the two replicates in 5-kb overlapping windows. Colored dots represent regions of statistically significant difference compared to WT (adj. P < 0.01). Black arrowhead indicates region of the highest intensity of the Sox2–SCR interaction, which overlaps with the SCR–CTCF motif. d, qPCR analysis of Sox2 expression in blastocysts at E3.5 was done using the ΔΔCT method and Gapdh as a reference. Sox2 expression was calculated by comparing it to the median of all analyzed WT embryos. Each dot represents a single blastocyst. The number of biologically independent blastocysts (n) analyzed of each genotype is shown below the plot. Boxplots show minimum, maximum, median, first and third quartiles. A Wilcoxon two-sided test was performed to assess statistical significance.
We derived ES cells from homozygous blastocysts of each of these two mutant strains in parallel with wild-type littermates. For each genotype, two independently derived ES lines served as biological replicates. Capture Hi-C (CHi-C) was then performed separately for each replicate and data were pooled for visualization. By using biotinylated oligonucleotides, CHi-C enriches for interactions within the locus of interest thus providing higher-resolution data than Hi-C, with lower sequencing effort51. Loss of CTCF motifs upstream of Sox2 in CTCFΔ(C2–C4) caused a strong loss of insulation, and fusion with the upstream domain (Fig. 2a,b). The change in insulation was limited to the Sox2–SCR domain and did not affect the overall structure of the neighboring region (Extended Data Fig. 2b). In contrast, CTCFΔ(C5) showed a very small decrease in insulation and no noticeable change in the Sox2– SCR domain. Virtual 4C plots, using either Sox2 or SCR as viewpoints, showed that loss of CTCF motifs anchoring the Sox2–SCR domain did not cause statistically significant changes in interaction frequency between Sox2 and SCR (Fig. 2c and Extended Data Fig. 3a). This was especially striking in CTCFΔ(C2–C4) cells, where insulation with the upstream domain was completely lost but the Sox2–SCR interaction was not substantially affected. In both mutant lines, the highest Sox2–SCR interaction signal was still centered on the region containing the CTCF motif in wild-type (WT) cells (rectangle in Fig. 2a and arrowhead in Fig. 2c). This region of maximum signal appeared slightly reduced compared to WT cells but did not meet our threshold for significance, suggesting that the CTCF motif is not the sole determinant of higher interaction frequency.
In line with unperturbed Sox2–SCR interactions in the absence of CTCF motifs, we did not detect statistically significant differences (P < 0.05) in Sox2 expression in blastocysts from either CTCFΔ(C2–C4) or CTCFΔ(C5) mutants (Fig. 2d). Furthermore, simultaneous deletion of both loop anchors of the Sox2–SCR domain (C2–C4 and C5 motifs) in ES cells showed no change in Sox2 expression or in domain structure (Extended Data Fig. 3b). This rules out potential compensation between the two ends of Sox2–SCR domain as seen at other loci33,35. These data show that CTCF-mediated loops are not required for de novo establishment of this interaction or for Sox2 expression.
SCR can activate Sox2 across CTCF-mediated boundaries
To characterize the ability of CTCF boundaries to disrupt enhancer–promoter interactions, we targeted a cassette of three CTCF motifs to two locations between Sox2 and SCR, in combinations we predicted to cause boundaries of different insulation strength (Extended Data Fig. 4a). The CTCF cassette consisted of tissue-invariant strongly bound CTCF motifs that retain cohesin efficiently52. The mouse line CTCFi3×− was generated by targeting the cassette to contain CTCF motifs on the negative strand. This should create a loop with the CTCF motif in the positive strand, upstream of Sox2. The CTCFi3×+ line was created by inserting the cassette closer to SCR, with CTCF motifs on the positive strand to form a loop with the CTCF motif at SCR. Enrichment of the cohesin loader NIPBL suggests that cohesin can be loaded at both Sox2 and SCR (Fig. 1a). Therefore, the two insertions were expected to bind CTCF in the correct orientation to halt cohesin extrusion53. We also generated the CTCFi3×−;3×+ line by combining both insertions, predicting the formation of two ectopic loops. Finally, CTCFi18×+ mice carrying six copies of the transgene for a total of 18 motifs were used to assess the ability of CTCF binding at high density to block cohesin extrusion.
CHi-C showed that our predictions based on the loop extrusion model were correct. Insertion of CTCF motifs in the CTCFi3×−, CTCFi3×+ and CTCFi18×+ lines resulted in two subdomains between Sox2 and SCR with a new boundary at the location of transgene insertion. Similarly, the double CTCF cassette in CTCFi3×−;3×+ cells led to the formation of three subdomains. Based on the insulation score, the greatest local increase in insulation was seen in CTCFi18×+ cells, while CTCFi3×−;3×+ showed a larger boundary with high insulation between the two insertion sites (bottom panel in Fig. 3a and Extended Data Fig. 4b). Although we detected the formation of a strong boundary in CTCFi3×− and CTCFi3×+ cells, the interaction of Sox2 with SCR was not as affected as in cells with the CTCFi18×+ insertions (Fig. 3b and Extended Data Fig. 5a,b). The strongest reduction in enhancer–promoter contacts was detected in cells where CTCF motifs were inserted across a larger region in divergent orientation in the CTCFi3×−;3×+ line. However, despite this strong decrease, we could still detect some Sox2–SCR interactions in CTCFi3×−;3×+ cells, which displayed higher CHi-C signal between the promoter and the enhancer cluster compared to adjacent regions. This suggests that a high density of CTCF motifs in the same orientation, as in CTCFi18×+ mice, can lead to stronger local insulation, but a combination of CTCF motifs in divergent orientations, such as in CTCFi3×−;3×+, blocks enhancer–promoter contacts more efficiently by forming loops with both upstream and downstream CTCF motifs.
Fig. 3 |. SCR can activate Sox2 across CTCF-mediated insulation.

a, CHi-C 1D interaction frequency heatmaps in homozygotic mES cells of the CTCFi3×−, CTCFi3×+, CTCFi18×+ and CTCFi3×−;3×+ strains compared to WT. Rectangles show the Sox2–SCR interaction. Inserted CTCF motif orientation and position in each mutant are shown below the plots. Insulation scores for 5-kb windows are shown below publicly available CTCF and H3K27ac tracks. Dashed lines below heatmap show CTCF insertion sites. b, Virtual 4C plots using the Sox2 and SCR viewpoints. Dashed lines highlight SCR in the Sox2 viewpoint (top) and Sox2 in the SCR viewpoint (bottom). Region surrounding viewpoint was removed from analysis. Virtual 4C signal is shown as the average of the two replicates in 5-kb overlapping windows. Colored dots represent regions of statistically significant difference compared to WT using a Wald test and after correction for multiple comparisons (Q < 0.01). c, qPCR analysis of Sox2 expression in blastocysts at E3.5 was done using the ΔΔCT method and Gapdh as a reference. Sox2 expression was compared to the median of all WT embryos. Each dot represents a blastocyst and a Wilcoxon two-sided test assessed statistical significance. The number of biologically independent blastocysts (n) analyzed of each genotype is shown below the plot. Boxplots show minimum, maximum, median, first and third quartiles. d, IF of blastocysts with antibodies targeting GATA6, NANOG and SOX2. Each dot in the quantification plots represents the signal intensity of a single cell normalized by the cell with the highest intensity in heterozygotes. The number of biologically independent blastocysts (n) analyzed of each genotype is shown below the plot. Boxplots show minimum, maximum, median, first and third quartiles. A Wilcoxon two-sided test was performed to assess statistical significance. Scale bars, 10 μm.
Although all homozygous mutant embryos had substantially reduced Sox2 expression (P < 0.05), none of the mutants had a loss similar to SCR deletion (Fig. 3c). Notably, the two lines that showed the strongest reduction in interactions, CTCFi18×+ and CTCFi3×−;3×+, also showed the greatest reduction in Sox2 expression. We hypothesized that Sox2 expression was higher in blastocysts with CTCF insertions than in those without SCR because the dynamic nature of CTCF binding—and consequently loop formation—would allow sporadic Sox2– SCR contacts leading to stronger expression in a few cells. To test this, we again quantified protein expression in blastocysts, focusing on CTCFi3×−;3×+ mutants as they showed the strongest decrease in SCR contacts and Sox2 expression. Similar to the SCRΔ line, CTCFi3×−;3×+ homozygous blastocysts showed no defect in specification of epiblast and primitive endoderm or in the total number of SOX2-expressing cells (Fig. 3d). Instead, we found that all epiblast cells expressed less SOX2, suggesting that the CTCF motif insertion homogenously reduced Sox2 transcription. In contrast to the postimplantation lethality of SCRΔ, we found that CTCFi3×−;3×+ animals, as well as homozygotes of all other lines, completed gastrulation and initiated organogenesis without any overt phenotypes (Fig. 4e). The difference in expression of the insertion mutant lines compared to the full enhancer deletion, and the fact that even CTCFi3×−;3×+ embryos can successfully gastrulate, highlights how SCR can still exert some regulatory activity over Sox2 across CTCF-mediated boundaries.
Fig. 4 |. DNE also induces Sox2 across CTCF-mediated insulation.
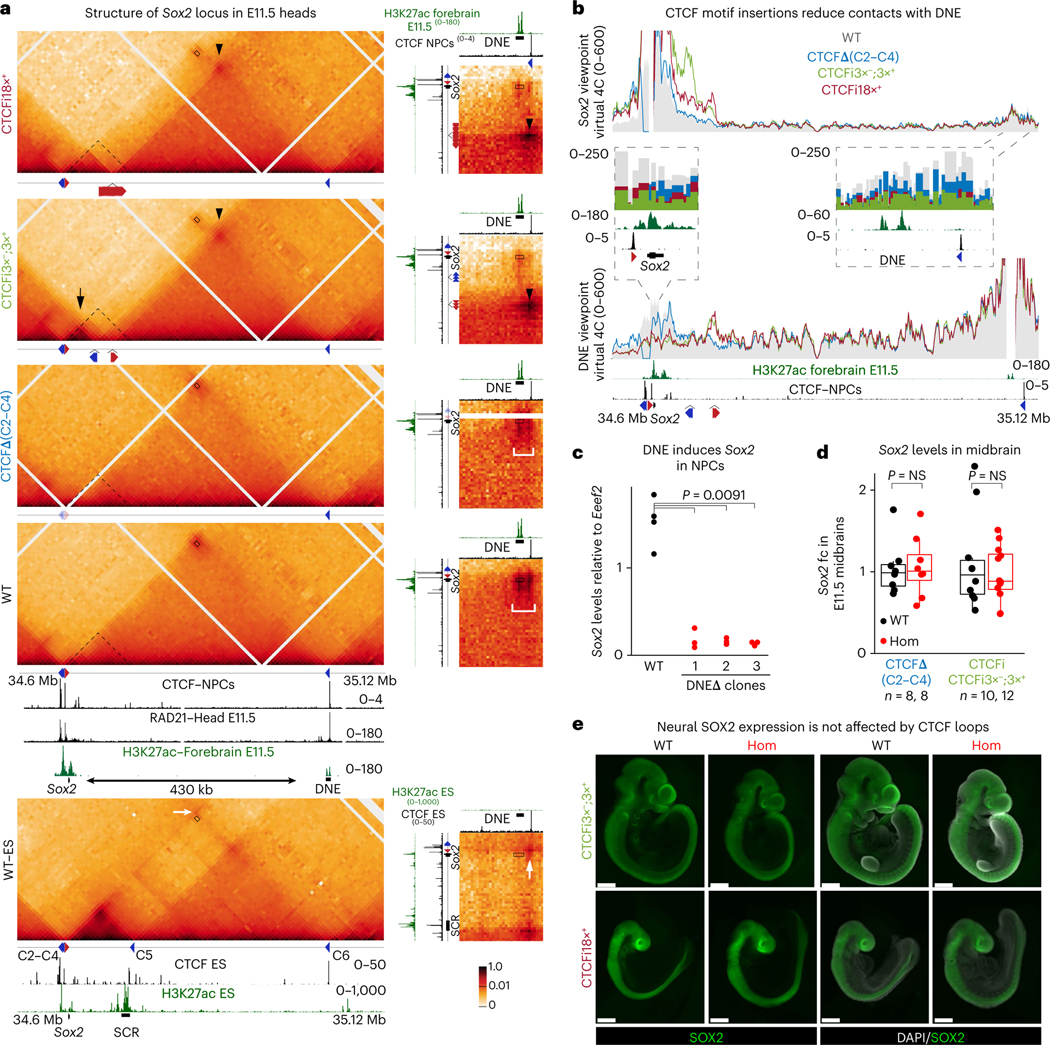
a, CHi-C 1D interaction frequency heatmap in E11.5 heads. Data of WT ES cells are shown for comparison (bottom). Insets on the right show 2D interaction heatmaps highlighting interactions between regions surrounding Sox2 and DNE. CTCF ChIP-seq publicly available data were obtained from in vitro differentiated neural progenitor cells. RAD21 ChIP-seq was performed on E11.5 heads isolated as for CHi-C. 2D insets show the same tracks on the x and y axes but at different locations. Rectangles represent the Sox2–DNE interaction, arrowheads represent loops with CTCF downstream of DNE established by transgene insertions, black arrow represents loops with CTCF upstream of Sox2 established by transgene insertions, white arrow represents loops in ES cells between CTCF upstream of Sox2 and CTCF downstream of DNE, white brackets in the insets highlight the region between DNE and CTCF. Dashed triangle in head CHi-C represents the Sox2–SCR interaction domain detected in ES cells. b, Virtual 4C plots using Sox2 and DNE viewpoints using 5-kb overlapping windows and signal are shown as an average of the two replicates of each genotype. Region surrounding viewpoint was removed from the analysis. Insets show signal at DpnII fragments. c, qPCR analysis of Sox2 expression in NPCs was done using the standard curve dilution method and Eef2 as a reference. Each dot represents a technical replicate and three individual mutant cell lines (n) were analyzed. A Wilcoxon two-sided test assessed the statistical significance by comparing WT to all mutant clones combined. d, qPCR analysis of Sox2 expression in E11.5 midbrains was done using the ΔΔCT method and Gapdh as a reference. Sox2 expression was compared to the median of all WT embryos. Each dot represents one embryo and a Wilcoxon two-sided test assessed statistical significance. The number of biologically independent embryos (n) analyzed for each genotype is shown in the legend. Boxplots show minimum, maximum, median, first and third quartiles. e, IF of E9.5–10.5 embryos stained with an antibody targeting SOX2. Three homozygotes of each line were stained and imaged together with two WT littermates. Scale bars, 500 μm.
Imaging studies have shown that enhancers can induce their target genes without an increase in interaction frequency54,55. In contrast, our CHi-C-based data show that the impact on Sox2 expression correlated with the ability of CTCF insertions to disrupt this interaction. To better quantify the effect of perturbing Sox2–SCR interactions on transcriptional output, we implemented the ABC model, which predicts the ability of a gene to be activated by an enhancer, based on the contact frequency between the two and activity measured as H3K27ac enrichment56. The model predicted that the strongest decrease in contacts between Sox2 and SCR, observed in the CTCFi3×−;3×+ line, would lead to the biggest reduction in Sox2 expression (Extended Data Fig. 5c). In contrast, the unperturbed Sox2–SCR interactions seen in CTCFΔ(C5) cells were predicted to not affect gene expression. In sum, our data suggest that enhancer–promoter interaction frequency can play a determinant role in transcriptional output. We also show that enhancers that can activate their targets across CTCF-mediated insulation contribute to phenotypic robustness, as the vastly reduced SCR contacts still induced enough SOX2 for successful implantation. These data also demonstrate that despite being an essential TF for successful implantation, mouse embryos require a surprisingly low amount of SOX2.
A distal neural enhancer can also activate Sox2 across CTCF loops
Later in development, Sox2 is essential for neurogenesis57. To visualize the structure of its locus in neural cells, we performed CHi-C on chromatin from the heads of individual E11.5 embryos. We found that along with the loss of SCR activity, the CTCF motif at SCR becomes unoccupied, cohesin is no longer retained, and the strong interaction domain is lost in these cells (Fig. 4a). Instead, Sox2 forms a larger (~430 kb) domain, delimited at its telomeric end by a CTCF motif in the negative strand, and a putative enhancer22,58 that we refer to as DNE (distal neural enhancer). Proximal to Sox2, several neural enhancers have also been identified59 that show specific activity in neuronal cells (Extended Data Fig. 6a). As in ES cells, CHi-C is inconclusive to determine if CTCF-mediated loops play an essential role in the Sox2–DNE interaction as the signal at the domain corner encompasses both DNE and the CTCF peak (bracket in the inset of Fig. 4a). The inactive state of DNE in ES cells reveals a clear corner signal between the CTCF motifs upstream of Sox2 and those downstream of DNE (white arrow in ES cells of Fig. 4a), which suggests that both CTCF peaks can retain cohesin and form a large loop.
We asked whether the CTCF motifs upstream of Sox2 function as anchors to facilitate contacts with proximal enhancers and DNE, and whether DNE could also activate Sox2 across CTCF-mediated insulation. As in ES cells, deletion of the CTCF motifs upstream of Sox2 in CTCFΔ(C2–C4) homozygous embryos caused loss of insulation and fusion with the upstream domain (Fig. 4a and Extended Data Fig. 6b,c). While contacts with the CTCF motif downstream of DNE were reduced to approximately half (inset in Fig. 4b in the Sox2 viewpoint), the interaction with DNE was only minimally affected (bracket in insets of Fig. 4a,b), suggesting that CTCF is also not essential for the interaction in neural cells. CTCF insertions generated new loops between the CTCF motif downstream of DNE in the negative strand and the motifs targeted to the positive orientation in CTCFi3×+, CTCFi18×+ and CTCFi3×−;3×+ embryos (arrowheads in Fig. 4a and Extended Data Fig. 6a). The CTCFi18×+ line showed again the strongest insulation score at the integration site, and CTCFi3×−;3×+ generated a larger boundary (Extended Data Fig. 6b,c). Interestingly, interactions with proximal neural enhancers increased in CTCFi3×− and CTCFi3×−;3×+ embryos. This was caused by the formation of a strong interacting domain with CTCF upstream of Sox2 upon targeting motifs to the negative strand (black arrows in Fig. 4a and Extended Data Fig. 6a,c). As before, upon introduction of CTCF-mediated loops, Sox2 and DNE interacted less frequently with the starkest decrease seen in CTCFi3×−;3×+ homozygotes. However, even in these embryos, Sox2–DNE interactions were not completely abrogated (rectangle in Fig. 4a,b and Extended Data Fig. 7a).
We then deleted DNE in ES cells and differentiated them into neural progenitor cells (NPCs). We detected a large decrease in Sox2 transcript levels, suggesting that DNE is required for Sox2 neural expression (Fig. 4c). In contrast, Sox2 expression in E11.5 midbrains was not substantially affected (P < 0.05) either by the loss of CTCF binding upstream of its promoter or by the introduction of ectopic loops (Fig. 4d). In addition, whole mount immunofluorescence (IF) confirmed that SOX2 expression remained largely unaltered (Fig. 4e and Extended Data Fig. 7b). Unperturbed Sox2 expression upon either loss of the telomeric anchor in CTCFΔ(C2–C4) mutants or the increase in short range contacts in CTCFi3×− and CTCFi3×−;3×+ homozygotes suggests that CTCF loops are not required for Sox2 expression and may reflect even higher resilience of its locus to structural perturbations in neural cells than in the epiblast (Fig. 4d). Unaltered Sox2 expression, despite the stark reduction in contacts with DNE, could also be explained by compensatory roles of Sox2 proximal enhancers in vivo that are different from what we observed in NPCs. Nonetheless, similar to ES cells, Sox2–DNE contacts were not completely abrogated by the introduction of ectopic CTCF-mediated loops.
Anterior foregut enhancers cannot bypass CTCF boundaries
A closer inspection of CTCFi18×+ and CTCFi3×−;3×+ IFs revealed that insertion of CTCF motifs caused SOX2 to become undetectable in the anterior foregut (AFG) at E9.5 (white bracket in Fig. 5a). At E10.5, the AFG separates and forms the trachea and lungs ventrally, while dorsally it gives rise to the esophagus and stomach60. Mice with hypomorphic Sox2 alleles and patients with heterozygous SOX2 variants fail to separate the AFG and develop a tracheoesophageal fistula where a single tube connects the pharynx to the lungs and stomach61–63. The loss of SOX2 in the AFG of E9.5 CTCFi3×−;3×+ homozygotes led to the formation of a tracheoesophageal fistula, and we could not detect SOX2 protein or mRNA in AFG-derived tissues such as the stomach (Fig. 5b,c and Extended Data Fig. 8a). NKX2.1, a TF normally expressed in trachea and lungs, was found across the entire esophagus and the stomach. In line with failure to separate trachea and esophagus, CTCFi3×−;3×+ died within a few hours of being born (Extended Data Fig. 8b). In contrast, loss of CTCF motifs upstream of Sox2 in CTCFΔ(C2–C4) homozygotes did not affect Sox2 AFG expression (Fig. 5c), indicating that also in these tissues, Sox2 can be induced independently of CTCF-mediated loops.
Fig. 5 |. CTCF loops can completely insulate Sox2 from its AFG-specific enhancers.

a, IF of E9.5–10.5 embryos stained with an antibody targeting SOX2. Bracket highlights the AFG. First four images were taken with a dissection microscope and the two on the right with a confocal microscope. Three homozygotes of each line were stained and imaged together with two WT littermates. Scale bars, 150 μm. b, IF with antibodies targeting SOX2 and NKX2.1 using dissected E13.5 AFG-derived tissues. Tr, trachea; Es, esophagus; Lu, lungs; St, stomach. Six embryos of each genotype were stained and imaged. Scale bars, 500 μm. c, qPCR analysis of Sox2 expression in stomach at E13.5 was done using the ΔΔCT method and Gapdh as a reference. Sox2 expression was calculated by comparing it to the median of all analyzed WT embryos. Each dot represents a single embryo. The number of embryos (n) analyzed for each genotype is shown below the plot. Boxplots show minimum, maximum, median, first and third quartiles. A Wilcoxon two-sided test was performed to assess statistical significance. d, GFP expression in AFG-derived organs dissected from E15.5 fetuses originating from crosses between CTCFi3×−;3×+ and Sox2GFP heterozygous mice. Three embryos of each genotype were imaged. Scale bars, 500 μm. e, CHi-C 1D interaction frequency heatmaps in WT E11.5 heads (top) and GFP+ cells from E11.5–12.5 AFG-derived tissues dissected from Sox2GFP heterozygotes (bottom). Publicly available CTCF, ATAC-seq and H3K27ac enrichment data from different tissues are shown below the heatmaps. Green arrowheads indicate putative regulatory elements with tissue-specific activity in AFG derivatives. Insets show a 2D interaction heatmap where y axis shows region centered around Sox2 and x axis shows region around a CTCF motif downstream of DNE. For the E11.5 head inset, CTCF data from NPCs are shown on both axes. For AFG-derived tissues, CTCF from stomach is shown on x axis and from lungs on the y axis. White bracket highlights the DNE and CTCF regions. In the AFG, the signal is restricted to the CTCF motifs and not to DNE.
This striking AFG phenotype seen in CTCFi3×−;3×+ and CTCFi18×+ homozygotes prompted us to examine viability across our allelic series to understand how the structural mutations impacted animal development. We recovered CTCFΔ(C2–C4), CTCFΔ(C5), CTCFi3×− and CTCFi3+ homozygotes at weaning without significant (P < 0.01) deviation from the expected ratio, showing that they are compatible with animal development (Extended Data Fig. 8b). Further, all CTCFi3×−;3×+ and CTCFi18×+ pups were found dead shortly after birth, which is consistent with the AFG fusion phenotype occurring with complete penetrance in these strains. We also found craniofacial phenotypes, such as cleft palate, in some CTCFi3×−;3×+ and CTCFi18×+ homozygotes at E18.5/P0 (Extended Data Fig. 8c). Because SOX2 has also been implicated in craniofacial development64,65, this phenotype suggests that there are other cell types where the impact of highly insulating boundaries is more severe. To assess if further decreasing Sox2 levels could affect implantation, we bred CTCFi3×−;3×+ and Sox2GFP heterozygotes66. Because Sox2 was substituted by GFP in the Sox2GFP line, double heterozygotes have only one copy of Sox2, which also contains CTCF insertions. These embryos successfully implanted, developed normally and died shortly after birth with a tracheoesophageal fistula phenotype (Fig. 5d). This provides further evidence of the resilience of early embryos to low Sox2 levels in contrast to the higher susceptibility during AFG development.
We then focused on understanding the causes of stronger phenotypic impact in the AFG. Firstly, we hypothesized that tissues with less Sox2 expression might be more susceptible to loss of contact with distal enhancers. In line with this, mid-gestation single-cell RNA-seq revealed that Sox2 is less expressed in the AFG than in the neural lineage (Extended Data Fig. 8d)67. Secondly, we asked whether enhancer location and distribution could influence their ability to bypass CTCF boundaries and induce transcription. In E14.5 lungs and stomachs, we found several putative enhancers downstream of our CTCF insertions (green arrowheads in Fig. 5e). Unlike ES cells, where SCR displays high density of regulatory chromatin marks in just 10 kb, potential AFG enhancers are spread through a larger domain spanning ~400 kb. Proximally to Sox2, we found ATAC-seq and H3K27ac peaks in a pattern similar to neural cells, which suggests that these are not tissue-specific enhancers. To characterize the 3D structure of the Sox2 locus in AFG-derived tissues, we assessed CTCF binding in the developing stomach and lungs. This was remarkably similar to the forebrain, with binding just upstream of Sox2 and downstream of DNE without visible additional peaks between the two regions (Fig. 5e). We micro-dissected AFG-derived tissues from E11.5–E12.5 Sox2GFP heterozygous embryos and sorted the GFP+ population of Sox2-expressing cells to perform CHi-C. Our data revealed a highly interacting domain delimited by the CTCF peaks in lung and stomach primordia and point to Sox2 interacting across the entire domain at high frequency rather than specific interactions with putative AFG enhancers. Unlike neural cells, where DNE is active and the domain corner signal spans the distal CTCF motif and DNE, in AFG-derived tissues we only detected higher interaction frequency between the CTCF binding sites (white brackets in Fig. 5e). As discussed below, we propose that enhancer density may influence the ability of promoters to be activated across physical barriers by their distal enhancers and maintain faithful gene expression.
Discussion
Our extensive allelic series of mouse mutants allowed us to characterize the interplay between CTCF-mediated loops and enhancer–promoter interactions. In contrast to other loci3–7, we show that CTCF is not required for Sox2 to recruit its distal enhancers in any of the tissues we assessed—despite the importance of CTCF to delimit the boundaries of the Sox2 domain. Our data show that some enhancer–promoter contacts can be fully decoupled from CTCF-mediated insulation even when genes are located immediately adjacent to CTCF motifs that function as loop anchors. This agrees with other locus-specific dissections of TAD borders and CTCF loops, where boundary loss led to ectopic gene activation and developmental phenotypes26–30,68–72, while disruption of loops anchoring enhancer–promoter interactions had milder effects33,35,42,73. Acute degradation of proteins involved in loop extrusion confirms that most genes, including Sox2, recruit their enhancers independently of CTCF-mediated loops4,8,74–76.
The loss of Sox2 expression in blastocysts correlated with the extent to which CTCF insertions reduced Sox2–SCR contacts, providing further support that the frequency of enhancer–promoter interactions can influence transcriptional output77–80. However, in agreement with recent studies32,42,81–83, some distal enhancers were still able to induce partial Sox2 expression across CTCF boundaries despite the substantially reduced contact frequencies. Our results suggest that the ability of enhancers to bypass CTCF loops and activate target promoters is determined by two types of nuclear forces: insulation strength of CTCF loops and frequency of enhancer–promoter interactions. Concerning insulation strength, we show that clusters of divergent CTCF motifs insulate enhancer–promoter interactions more efficiently than regions with high density of motifs in the same orientation. As both enhancers and promoters are likely to induce cohesin loading, the ability to retain extrusion from both sides of an enhancer–promoter pair may promote insulation more efficiently. As for enhancer–promoter contacts, we propose that enhancers that are clustered at high density—such as SCR or DNE—may establish more robust contacts with their target promoters, which could facilitate overcoming of CTCF insulation. In contrast, AFG enhancers are spread over an ~400-kb domain and established less frequent interactions that were unable to activate Sox2 across CTCF loops.
Robust enhancer–promoter interactions that bypass CTCF insulation may provide a selective advantage by ensuring faithful gene regulation in the face of structural perturbations that interfere with regulatory contacts. Such perturbations can include chromosomal abnormalities such as amplifications or inversions but also acquisition of CTCF motifs by transposition of repeat elements. For example, SINE B2 transposons can contribute to new CTCF binding sites and could endanger efficient regulatory contacts following transposition84–88. Robust enhancer–promoter contacts across CTCF loops could provide additional flexibility for perturbations to be either positively or negatively selected, depending on physiological outcomes. In fact, some dramatic chromosomal rearrangements do not cause massive transcriptional dysregulation31. Notably, the phenotypic outcome of disruptions of nuclear structure is highly influenced by how much gene expression levels need to change for a developmental process to be perturbed. We show here that early embryos evolved to survive with a wide range of Sox2 levels, which explains their strong robustness to perturbations of chromatin structure. It is very likely that this is not the case in other tissues. Furthermore, cases of haploinsufficiency are well described where 50% of expression loss can be highly detrimental.
An important challenge going forward will be to better define the CTCF-independent mechanisms that establish enhancer–promoter interactions. Megabase-scale nuclear compartments arise from the association of chromatin with similar activity status. These associations have been recently shown to also occur at much finer resolutions between enhancers and their target promoters89–91. This suggests that enrichment of active chromatin marks or of the transcriptional machinery at promoters and enhancers could positively contribute to their interaction frequency. Some of our observations are in line with this. Enhancer clustering likely increases local TF concentration, coregulatory complexes and chromatin with similar modifications, which together may facilitate and strengthen the formation of physical hubs with target promoters and explain their increased ability to bypass CTCF loops42,43,77,92,93. In contrast, lower baseline Sox2 expression in the AFG is likely associated with reduced concentration of transcriptional machinery and active chromatin, leading to less robust interactions with distal enhancers. Finally, we recently reported94 that rapid decrease of H3K27ac at SCR occurs concomitantly with a sharp loss in Sox2 contacts. Although it is difficult to pinpoint causality to this observation, we think it also supports that clustering of active chromatin regions promotes enhancer–promoter interactions. Being in a gene desert simplifies the study of how Sox2 is regulated by multiple enhancers. However, it will be essential to understand how such compartmentalization forces may confer specificity to enhancer–promoter contacts and ensure on-target activation in regions where multiple enhancers and genes cohabit.
Online content
Any methods, additional references, Nature Portfolio reporting summaries, source data, extended data, supplementary information, acknowledgements, peer review information; details of author contributions and competing interests; and statements of data and code availability are available at https://doi.org/10.1038/s41588-022-01295-6.
Methods
Animals and transgenic line generation
Mouse studies were performed according to NIH and PHS guidelines and only after protocols were approved by the Animal Care and Use Committees of the National Cancer Institute and Eunice Kennedy Shriver National Institute of Child Health and Human Development. NCI-Frederick, where generation of transgenic mouse lines was made, is accredited by AAALAC International and follows the Public Health Service Policy for the Care and Use of Laboratory Animals. Animal care was provided in accordance with the procedures outlined in the ‘Guide for Care and Use of Laboratory Animals (National Research Council; 1996; National Academy Press). Mice were housed at 18–23 °C with 40–60% humidity and a 14 h light/10 h dark cycle. Mouse lines were generated by zygotic injection of Cas9–gRNA ribonucleoproteins. Candidate sgRNAs were designed using sgRNA Scorer 2.0 (ref. 95) and subsequently tested for editing activity in P19 cells using an approach previously described96. The most potent candidates were then procured as synthetically modified RNAs (Synthego). Cas9 protein was generated in-house (Protein Expression Lab, Frederick National Lab) using an Escherichia coli expression plasmid obtained as a gift from Niels Geijsen (Addgene, 62731)97. Superovulated C57Bl6NCr female mice were used as embryo donors. Zygotes were collected on day E0.5, microinjected and allowed to recover for 2 h by incubation (5% CO2, 37 °C), following which, viable embryos were surgically transferred to oviducts of pseudopregnant recipient females. The microinjection cocktail comprised 75 ng μl−1 of in vitro synthesized gRNAs (Synthego) and 50 ng μl−1 of Cas9 protein (produced by the Protein Expression Laboratory, Frederick National Lab) in 50 μl total volume was kept on dry ice until just before microinjection. For insertions requiring repair templates, 75 ng μl−1 of single-stranded DNA was added to the microinjection cocktail. Founder mice were then bred to C57Bl6NCr mice. The CTCFΔ(2–4) and SCRΔ lines were generated using two gRNAs to achieve a deletion. The CTCFΔ(C5) line was obtained by replacing the CTCF 19-bp motif with a sequence of the same size containing a NotI restriction enzyme site for easier genotyping and identification of founder mice where the CTCF motif was disrupted by a sequence of the same exact size. For this line, two gRNAs were used to generate two DNA double-stranded breaks. The CTCFi3×− and CTCFi3×+ lines were generated by inserting three consecutive CTCF motifs52 in two different locations between Sox2 and SCR. For this, one gRNA for each location was used to induce double-stranded DNA breaks, and repair templates containing the CTCF motifs flanked by homology arms were used for zygotic injection. The CTCFi18×+ line was a byproduct of injection of the CTCFi3×+ repair template where one chimeric F0 mouse was obtained containing three alleles: WT, CTCFi3×+ and CTCFi18×+. This founder male was bred to C57Bl6NCr females and heterozygous F1 progeny for each of the three alleles were recovered at similar levels. To identify the sequence of the integration of the CTCFi18×+ line, we amplified gDNA from ES cells derived from homozygous blastocysts using a primer pair surrounding the insertion sites. This large, repetitive DNA fragment was then sequenced using PacBio, which revealed six concatamers of the repair template for a total of 18 CTCF motifs all in the same orientation. The two lines, CTCFi3×+ and CTCFi18×+, were then crossed separately. For generation of CTCFi3×−;3×+, homozygous females of the CTCFi3×− were used as female donors and zygotes were injected with the CTCFi3×+ repair template and gRNA–Cas9 ribonucleoprotein. Mice carrying these two lines were subjected to phenotyping that included macroscopic dissections and pathology analysis by the NCI’s phenotyping core. Notably, all found phenotypes were highly similar to the phenotypes previously described in mouse models of SOX2 loss supporting that defects were caused by perturbations to the architecture of the Sox2 locus and not because of CRISPR off-target activity or because of insertion of potentially repetitive CTCF flanking sequences. Repair templates, gRNAs and primers used for genotyping and sequencing of ligation junctions of the deletion lines can be found in Supplementary Table 1. Longer nanopore-based sequencing of targeted alleles can be found in Supplementary Data 1. In addition, the Sox2GFP line was purchased from Jackson Labs (strain 017592)66.
ES cell line establishment
Blastocysts derived from the natural breeding of heterozygous transgenic mice were used for ES cell line establishment following a published protocol with some modifications98. Presence of a copulatory plug in the early morning was designated as E0.5. Blastocysts at E3.5 were collected by flushing female uterine horns with M2 medium. Twenty-four hours before embryo isolation, primary mouse embryonic fibroblasts (MEFs) were thawed and grown in 24-well plates in MEF culture medium containing DMEM (Thermo Fisher Scientific, 11965118), 10% FBS (VWR, 97068–091), 2 mM Glutamax (Thermo Fisher Scientific, 35050079) and penicillin–streptomycin (Thermo Fisher Scientific, 15140163). Isolated blastocysts were plated over MEFs in presence of serum-free media combined with MEK/ERK pathway inhibitor (PD0325901; Reprocell, 04–0006-02), GSK3 signaling inhibitor (CHIR99021; Reprocell, 04–0004-02) and leukemia inhibition factor (LIF; Sigma-Aldrich, ESG1107). Serum-free media comprised of neurobasal medium (Thermo Fisher Scientific, 21103049), DMEM/F12 nutrient mixture (Thermo Fisher Scientific, 21103049), 1% penicillin–streptomycin (Thermo Fisher Scientific, 15140163), 2 mM Glutamax (Thermo Fisher Scientific, 35050079) and β-mercaptoethanol supplemented with N2 (Thermo Fisher Scientific, 17502001) and B-27 (Thermo Fisher Scientific, 17504001). Single blastocysts, plated in individual wells, were cultured over feeders for 10 d at 37 °C, 5% CO2 to allow ICM outgrowth and 50% of the medium was changed every 48 h. Embryos hatched out and attached to the feeder layer within 48–72 h of plating. Outgrowths were picked up using a mouth pipette without feeder carry-over and transferred into 96-well round bottom plates containing 50 μl of cold 0.05% trypsin and incubated for 5 min at 37 °C. The outgrowth was disaggregated into small clumps of cells by pipetting up and down vigorously several times while observing under the microscope. Trypsin was quickly inactivated by adding 250 μl of 20% serum-containing medium and LIF. From this cell suspension, 100 μl were lysed and used for genotyping, and the remaining 200 μl were plated in 96-well plates containing feeders and grown for 48–72 h in presence of ES serum-containing media until ES colonies were visualized. Meanwhile, genotype of each ES clone was determined, and WT and homozygous clones were propagated for additional two to three passages in presence of feeders and serum-containing media. At least two independent cell lines from two individual blastocysts were established for each genotype. The growth and morphology of each ES clone was monitored before freezing the stocks (P3 or P4). Serum-containing media comprised of Knockout DMEM (Thermo Fisher Scientific, 10829018) with 15% FBS (VWR, 97068–091), 2 mM Glutamax (Thermo Fisher Scientific, 35050079), 0.1 mM β-mercaptoethanol, 0.1 mM MEM nonessential amino acids (Thermo Fisher Scientific, 11140050), 1 mM sodium pyruvate (Thermo Fisher Scientific, 11360070), 1% penicillin–streptomycin (Thermo Fisher Scientific, 15140163) and Recombinant mouse LIF (Sigma-Aldrich, ESG1107). Additionally, a fraction of these ES cell clones was feeder depleted and cultured in serum-free media (2i + LIF) for at least four to five passages and frozen in freezing medium (95% FBS + 5% DMSO) once they adopted a round 3D morphology and good growth rate. For all our downstream experiments, early passages of frozen stocks of ES cell clones were used without feeders grown in serum-free media in the presence of 2i + LIF to mimic as close as possible the in vivo pluripotent epiblast of blastocysts.
Genome engineering in vitro
For targeting of DNE in ES cells, gRNA plasmids were assembled in the gRNA_cloning vector, a gift from George Church (Addgene; Plasmid, 41824) using a previously described protocol99. The sequence of the resulting guide plasmid was confirmed by Sanger sequencing. For monoallelic Sox2 reporter line generation, one gRNA targeting the Sox2 untranslated region was designed along with a P2A-mCherry homology-directed repair integration construct. For deletions, two gRNAs targeting the 5′ and 3′ ends of the Neural Distal Element region were designed. Following a previously described protocol100, mouse ESC was transfected with 5 μg each of 5′ gRNA, 3′ gRNA and pCas9_GFP plasmid, a gift from Kiran Musunuru (Addgene; Plasmid, 44719)101 using the Neon Transfection System. Forty-eight hours after cotransfection with gRNA and Cas9-GFP plasmids, GFP+ cells were collected and sorted on a BD FACSAria (Temerty Faculty of Medicine Flow Cytometry Facility, Toronto, Canada). GFP+ cells were seeded onto 0.1% gelatin-coated plates. On days 5–6, the isolated clonal ESC outgrowths were picked and propagated in 96-well plates for genotyping. The prepGEM Universal Kit (MicroGEM) was used for DNA extraction according to the manufacturer’s recommendations. All deletions were confirmed by Sanger sequencing and analysis using primers 5′ and 3′ from the gRNA target sites. Generation of the CTCFΔ(C2–C4) + Δ(C5) was done by introducing the same reagents used to generate the CTCFΔ(C5) mouse line in homozygous CTCFΔ(C2–C4) ES cells. For this, 5 million ES cells were nucleofected using 100 μl of the P3 Primary Cell 4D-NucleofectorTM kit from Lonza with 10 μg of Cas9 protein conjugated with 500 pmol of gRNAs and 500 ng of ssDNA repair template. Following nucleofection, single colonies were picked, expanded and genotyped by PCR and sanger sequencing as done for the identification of founder mice.
CHi-C
Hi-C libraries for CHi-C were prepared as described in ref. 94. Briefly, for mouse ES cell lines, 1 million cells per sample were trypsinized, washed in growth media and fixed for 10 min at room temperature while rotating with 1% formaldehyde (Thermo Fischer Scientific, 28908) in 1 ml of HBSS media. CHi-C was processed separately for the two independent lines of each genotype that had been established from two independent blastocysts. Heads of individual E11.5 embryos consisting of forebrain, midbrain and hindbrain were dissected in PBS with 10% FBS. After cutting specimens into small pieces with fine scissors, samples were incubated for 45 min at 37 °C in 300 μl of 90% FBS/0.1 mg ml−1 collagenase type I (Sigma-Aldrich, CO130) in PBS. Following incubation, the material was strained through a 70-μm filter and washed with cold PBS before incubating for 10 min at RT in 1% formaldehyde. At least two different embryos per genotype were used as separate replicates for these experiments. For isolation of AFG-derived tissues from Sox2GFP heterozygous embryos, E11–E12.5 embryos were dissected in PBS with 10% FBS to microscopically dissect the lung and stomach primordia as well as the trachea and esophagus. GFP+ cells from non-AFG tissues, such as neural tube cells, were carefully removed during dissection. These samples were then cut into small pieces and incubated for 45 min at 37 °C while shaking in a buffer containing collagenase type IV (2.2 mg ml−1; Gibco), BSA (0.1%; Jackson Laboratory), DNase (125 units per ml; Worthington), HEPES (20 mM), CaCl2 (1 mM) and Pluronics (1%; (p-188 aka F-68; Thermo Fisher Scientific) in Medium 199 (Gibco))102. Samples were then sorted for GFP+ population using Hoechst staining to isolate living cells. As a control for setting gates, material isolated and processed in parallel from WT littermates was used. GFP+ cells were pooled from different litters containing cells isolated from several Sox2GFP heterozygous embryos. Following FACS, samples were fixed as described above. To stop fixation, glycine was added at final concentration of 0.13 M and incubated for 5 min at RT and 15 min on ice. Cells were then washed once in cold PBS, centrifuged at 2,500g 4 °C for 5 min (these centrifugation conditions were used for all washes following fixation) and pellets were frozen at −80 °C. Thawed cell pellets were incubated in 1 ml lysis buffer (10 mM Tris–HCl pH8, 10 mM NaCl, 0.2% Igepal CA-630, Roche Complete EDTA-free; Sigma-Aldrich, 11836170001). Following lysis, cells were Dounced for a total of 40 strokes with a ‘tight pestle’ and then washed in cold PBS. For DpnII digest, cells were resuspended in 50 μl 0.5% SDS and incubated at 62 °C for 10 min. Then 150 μl of 1.5% Triton-X was added and cells were incubated for 15 min at 37 °C while shaking at 900 rpm. Twenty-five microliters of 10× DpnII restriction buffer (NEB) was added, and cells were further incubated for 15 min while shaking. Further, 200 U of DpnII (NEB R0543M) was then added and incubated for 2 h, then 200 U more was added and incubated overnight. The next morning, 200 U more was added and incubated for 3 h (a total of 600 U of DpnII). DpnII was inactivated at 62 °C for 20 min. Biotin fill-in was done by incubating cells with a mixture of 4.5 μl dCTP, dTTP and dGTP at 3.3 mM, 8 μl Klenow polymerase (NEB M0210L) and 37.5 μl Biotin-14-dATP (Thermo Fischer Scientific, 19524016) for 4 h at room temperature while shaking at 900 rpm for 10 s every 5 min. Ligation was done overnight at 16 °C also rotating at 900 rpm for 10 s every 5 min by adding 120 μl of 10× ligation buffer (NEB), 664 μl water, 100 μl 10% Triton-X, 6 μl BSA 20 mg ml−1 and 2 μl T4 ligase (NEB, M0202M). Crosslink removal was done overnight with 50 μl of proteinase K in 300 μl of following buffer (10 mM Tris–HCl pH8.0, 0.5 M NaCl, 1%SDS) while shaking at 1,400 rpm at 65 °C. Following sodium acetate and 100% ethanol −80 °C precipitation, DNA was resuspended in 50 μl 10 mM Tris–HCl. Sonication was done using Covaris onetube-10 AFA strips using the following parameters for a 300-bp fragment size (duration: 10 s, repeat for 12 times, total time 120 s, peak power 20 W, duty factor 40%, CPB-50) in a Covaris ME220 sonicator. Sonicated material was then size-selected using SPRI beads with the following ratios: 0.55× and 0.75×. Hi-C material was then bound to 150 μl Streptavidin C1 beads (Thermo Fischer Scientific, 65002), washed and recovered following the manufacturer’s recommendations. Bead-bound DNA was resuspended in 50 μl 10 mM Tris–HCl. Library preparation was done using the Kapa Hyper Prep KK8502 kit. Ten microliters of end-repair buffer and enzyme mix were added to resuspended beads and incubated for 30 min at room temperature and then 30 min at 65 °C. One microliter of 15 mM annealed Illumina adapters, containing a universal p5 and an indexed p7 oligonucleotide, was then incubated with a mixture containing 4 μl of ligase and ligation buffer at room temperature for 60 min. Libraries were then amplified using four reactions per sample for a total of 200 μl and 10 cycles, as recommended by the manufacturer. For capture, 1 μg of Hi-C library per sample was mixed with 5 μl of SureSelect XT HS and XT Low Input Blocker Mix (Agilent). Samples were denatured at 95 °C for 5 min and prehybridized for 10 min at 65 °C. Two microliters of SureSelect probes (Agilent) was mixed with 2 μl of 25% RNase block, 6 μl of hybridization buffer and 3 μl of water. Following prehybridization, this probe mixture was added to prehybridized samples and incubated for 1 h at 65 °C. For washing, samples and probes were bound to 50 μl streptavidin C1 beads and washed using SureSelect wash buffers as recommended by the manufacturer. Washed material was resuspended in 25 μl of water and amplified by PCR using 20 cycles.
CHi-C analysis
CHi-C libraries were sequenced with paired-end reads of 51 nucleotides on a Hiseq2500 and Novaseq6000. Data were processed using the Hi-Cpro (version 3.1.0) pipeline103 to produce a list of valid interaction pairs with the CHi-C option for the following region: chr3:3401600035655100. This list was converted into cool and mcool files for visualization with higlass (version 1.11.7)104. Following the assessment of replicate reproducibility, the replicates of same condition were merged for visualization using Hi-Cpro followed again by conversion to cool and mcool files. One-dimensional CHi-C heatmaps are shown at 4-kb resolution and 2D heatmaps for zoom-ins at 2 kb. Signal across all samples was normalized according to the signal in WT samples. Information on the number of reads and peaks can be found in Supplementary Table 2. White regions in 1D heatmaps represent genomic regions to which reads cannot be uniquely mapped, such as transposable elements. They also represent regions where DNA has been deleted such as in the ΔC2–C4 line. Differential 1D CHi-C heatmaps were produced using the divisor function of higlass and signal from mutant lines was divided by WT CHi-C. Heatmap values were then normalized to the sample with highest differential scores. To calculate insulation scores, we used FANC (version 0.9)105 using 5-kb CHi-C resolution and a 50-kb sliding window. The make_viewpoints Hi-Cpro script was used to obtain virtual 4C plots for each replicate of each viewpoint. The following regions were used as viewpoints (Sox2—chr3:34647939–34653212, SCR—chr3:34752710–34760133 and DNE—chr3:35083629–35091662). For visualization, averages of each replicate were used and signal was normalized with DESeq2 using 5-kb overlapping windows by sliding each window 1 kb. P values were calculated using DESeq2 (version 1.36.0) and comparing Capture-C signal of 2 replicates over the regions shown in Figs. 2 and 3. All samples were compared to WT. Adjusted P values lower than 0.01 were considered as threshold for significance and are shown above the plot. Additionally, virtual 4C plots are also shown using the average signal of the two replicates at each DpnII fragment. Zoom views of CHi-C data of E11.5 are shown using combined replicate signal at the fragment level.
Reporting summary
Further information on research design is available in the Nature Portfolio Reporting Summary linked to this article.
Extended Data
Extended Data Fig. 1 |. SCR is required for Sox2 expression.

a Sox2 and SCR activity during early mouse development as assessed by enrichment of H3K27ac and ATAC-seq. SCR is active in pluripotent epiblast cells, and in germ cells that regain a pluripotent status. H3K27ac CUT&RUN in mES cells cultured in epiblast-like conditions shows enrichment at both Sox2 and SCR but not in cells differentiated into primitive endoderm (PrE). No H3K27ac is detected at Sox2 or SCR in the visceral endoderm of post-implantation embryos and SCR activity is diminished in epiblast cells. Despite strong enrichment at the Sox2 gene body in the neural tube and forebrain of E11.5 embryos, SCR is no longer active. Instead, other proximal regions (black arrow) show increased activity. ATAC-seq data shows that both male and female primordial germ cells, but not the surrounding soma, are enriched in accessible chromatin at SCR. b Regions targeted for deletion in the SCRΔ line and gRNAs used. Browser shot shows enrichment of NANOG, SOX2, OCT4 and H3K27ac over Sox2 and SCR in ES cells. Nucleotides in red represent the protospacer sequence of gRNAs used for injection. Underlined nucleotides highlight location of the Cas9 PAM in the mouse genome. Regions targeted in previous studies are show also with black boxes. Arrows on both sides of the deletion highlight the ligation junction detected in the mouse used as founder as determined by Sanger sequencing. c IF of E4.5 blastocysts stained with antibodies targeting GATA6, NANOG and SOX2. In the quantification plots, each dot represents a cell and to allow comparison across three different litters, the intensity of each cell was normalized by the cell with highest intensity in heterozygous embryos. Number of embryos analyzed for each genotype is shown below the plot. Boxplots show minimum, maximum, median, first, and third quartiles. A Wilcoxon two-sided test was performed to assess statistical significance. Scale bar represents 10 μm.
Extended Data Fig. 2 |. SCR activates Sox2 independently of CTCF.

a Scheme depicting targeting strategy for generation of the two CTCF deletion lines. Browser shot shows enrichment of CTCF, NANOG, SOX2, OCT4 and H3K27ac over Sox2 and SCR. A NANOG/SOX2/OCT4 peak showing high enrichment was deleted in the CTCFΔ(C2-C4) but this region has been previously shown to not be required for mouse development. Browser shots with zoomed-in views of CTCF enrichment at Sox2 and SCR show precise location of gRNAs used in zygotic injections. CTCF peak nearest the most centromeric gRNA used in the CTCFΔ(C2-C4) targeting does not contain a significant CTCF motif according to FIMO. This peak was nonetheless deleted in the CTCFΔ(C2-C4) line. Nucleotides in red represent the protospacer sequence of gRNAs used for injection. Underlined nucleotides highlight location of the Cas9 PAM in the mouse genome. Arrows on both sides of the deletion highlight ligation junction detected in the mouse used as founder as determined by Sanger sequencing. For the CTCFΔ(C5) scheme, purple line highlights location of the CTCF motif at SCR. The central sequence of the repair template is shown, with parts of the protospacer sequence used in the gRNA shown in red, and the restriction enzyme target that replaced the CTCF motif in blue. Full sequence of homology arms on both sides is omitted. b Differential CHi-C interaction frequency heatmaps. Red signal represents interactions occurring at higher frequency in mutant cell lines compared to control and blue shows interactions of lower frequency. Dotted lines represent the Sox2-SCR domain as detected in WT control cells.
Extended Data Fig. 3 |. SCR induces Sox2 independently of CTCF.

a Virtual 4C plots using the Sox2 and SCR viewpoints at DpnII-fragment resolution. Plots in main figure show overlapping 5 kb windows. These plots can be used to also visualize the maintenance of Sox2-SCR interactions. Region surrounding viewpoint was removed from analysis. Dotted lines highlight SCR in the Sox2 viewpoint (left), and Sox2 in the SCR viewpoint (right). Virtual 4C signal is shown as average of the 2 replicates at the fragment level. b Deletion of CTCF motifs on the centromeric and telomeric end of the Sox2-SCR domain does not affect interactions and Sox2 expression. Left-qPCR analysis of Sox2 expression in ES cells was done using the ΔΔCT method and Gapdh as a reference. Sox2 expression was calculated by comparing it to the median WT clones. Each dot represents a different ES cell clone. The number of independent cell lines(n) analyzed of each genotype was 2. Boxplots show minimum, maximum, median, first, and third quartiles. A Wilcoxon two-sided test was performed to assess statistical significance. Right-CHi-C 1D interaction frequency heatmap in homozygotic CTCFΔ(C2-C4) + (C5) mES cells compared to WT.
Extended Data Fig. 4 |. SCR can activate Sox2 across CTCF-mediated insulation.

a Top left scheme depicts targeting strategy for generation of the transgenic lines carrying insertion of CTCF motifs. Arcs represent CTCF-mediated loops generated in each insertion line as predicted by the loop-extrusion model. We assumed that the sites where cassettes were targeted did not contain regulatory elements based on conservation and analysis of ENCODE datasets. Top right browser shows CTCF ChIP-seq enrichment and insertion sites of CTCF transgenes. Left bottom panel shows the targeting of the C57Bl6 genome to generate CTCFi3×− mice. Right bottom panel shows targeting to generate CTCFi3×+, CTCFi3×−;3×+, and CTCFi18×+ mice. Nucleotides shown in red represent the protospacer sequence of gRNAs used for injection while underlined nucleotides highlight location of the Cas9 PAM in the mouse mm10 genome. gRNA mm10 coordinates are shown in red. The central sequence of the repair templates is shown, with parts of the protospacer sequence used in the gRNA shown in red and mutated PAM nucleotides underlined. The complete sequence of homology arms on both sides is omitted. Each colored rectangle represents a different region from the mouse genome containing a CTCF motif and adjacent regions. Complete sequences of the CTCF motifs and adjacent regions are shown in different color with the central CTCF motif in blue representing targeting to negative strand in the CTCFi3×− line. The first and last two nucleotides of each of the three CTCF regions are shown in the schema of the repair template. The same three CTCF-carrying regions were used in CTCFi3×− and CTCFi3×+ lines but targeted to different strands and locations. Therefore, the central region of repair template is the same but in different strands and containing different repair templates. Retargeting of the CTCFi3×+ transgene on a homozygous CTCFi3×− background generated the CTCFi3×−;3×+ line. The CTCFi18×+ line was obtained as a consequence of the CTCFi3×+ injection because of concatemerization of the repair template. The resulting allele is shown in the bottom right. b Differential CHi-C interaction frequency heatmap. Red signal represents interactions occurring at higher frequency in mutant cell lines compared to control. Dotted lines represent insertion sites of CTCF transgenes.
Extended Data Fig. 5 |. SCR can interact with Sox2 across CTCF-mediated insulation.

a Virtual 4C plot using Sox2 and SCR viewpoints. Region surrounding viewpoint was removed from analysis. Dotted lines highlight SCR in the Sox2 viewpoint (top), and Sox2 in the SCR viewpoint (bottom). Virtual 4C signal is shown as average of the 2 replicates of each genotype in 5 kb overlapping windows. b Virtual 4C plot using Sox2 and SCR viewpoints at DpnII-fragment resolution. This same signal at 5 kb overlapping bins is shown in A and in the main figure. This representation highlights how, despite massively reduced, Sox2 can interact with SCR in all lines generated. Region surrounding viewpoint was removed from analysis. Dotted lines highlight SCR in the Sox2 viewpoint (left), and Sox2 in the SCR viewpoint (right). Virtual 4C signal is shown as average of the 2 replicates of each genotype at DpnII fragment resolution. c Results from ABC model using WT H3K27ac and CHi-C data from each of our mutants. The lower score in CTCFΔ(C2-C4) mutants is likely related to the 5 kb windows used for analysis, which cause a very strong artificial reduction in CHi-C signal on these cells that have an 8 kb deletion very near the Sox2 promoter.
Extended Data Fig. 6 |. DNE also induces Sox2 across CTCF-mediated insulation.

a Interaction frequency heatmap determined by CHi-C in heads of E11.5 embryos. Insets on the right show 2D interaction heatmaps highlighting interactions between regions surrounding Sox2 and DNE. CTCF data shown under CHi-C heatmaps from heads is derived from in vitro differentiated neural progenitor cells. Rectangles represent the Sox2-DNE interaction, arrowheads represent loops with CTCF downstream of DNE established by transgene insertions, black arrow represent loops with CTCF upstream of Sox2 established by transgene insertions. b Insulation scores for 5 kb windows in this region are shown where lower levels represent higher insulation. CTCFi18×+ shows the strongest insulation score while CTCFi3×−;3×+ displays the largest ectopic boundary. c Differential CHi-C interaction frequency heatmap. Red signal represents interactions occurring at higher frequency in mutant cell lines compared to control. Black arrow highlights formation of a highly interacting domain containing Sox2 and the proximal neural enhancers.
Extended Data Fig. 7 |. DNE can activate Sox2 across CTCF-mediated insulation.

a Virtual 4C plot using Sox2 and DNE viewpoints with signal plotted at each DpnII fragment. This same signal at 5 kb overlapping bins is shown in the main figure. This representation highlights how, despite massively reduced, Sox2 can interact with DNE in all lines assessed. Signal is shown as average of the 2 replicates of each genotype. Region surrounding viewpoint was removed from analysis. Dotted lines highlight DNE in the Sox2 viewpoint (left), and Sox2 in the DNE viewpoint (right). Virtual 4C signal is shown as average of the 2 replicates of each genotype at DpnII fragment resolution. b IF of E11.5 embryos stained with an antibody targeting SOX2. Scale bar represents 500 μm. 2 embryos of each genotype were stained and imaged.
Extended Data Fig. 8 |. Developmental defects seen in homozygous embryos with modifications of the Sox2 locus.

a Transverse section of E13.5 CTCFi3×−;3×+ wt and homozygote littermates at heart level. Es-esophagus, Tr-trachea. 3 embryos from each genotype were sectioned, stained and imaged. Scale bar represents 100 μm b Genotyping at of living animals at weaning, P0 and E18.5 for the indicated strains. P values were calculated using a two-tailed chi-squared test. The viability of homozygous CTCFi3×− and CTCFi3×+ animals provides strong evidence that insertion of CTCF cassettes did not disrupt regulatory elements and that the phenotypes seen in CTCFi3×−;3×+ and CTCFi18×+ homozygotes are caused by perturbations to the chromatin structure of the Sox2 locus. In agreement with our observation that 1 of 9 post-implantation E6.5 mutant embryos initiated gastrulation (Fig. 1c), we recovered a few SCRΔ homozygotes at weaning but at a highly reduced frequency compared to the expected ratio. This could be explained by SCR losing activity following implantation, suggesting that embryos that successfully implant despite SCR deletion can complete development. In line with absence of SOX2 expression in the AFG of E9.5 embryos, we only recovered 3 CTCFi18×+homozygous pups alive at P0 (out of 15 expected) and none at weaning. As the three pups found at P0 were observed during delivery we speculate that they would perish within a few hours as all other analyzed pups of this line. c Frontal sections of E18.5 CTCFi3×−;3×+ wt and homozygote littermates. Asterisk highlights cleft palate defect. 3 embryos from each genotype were sectioned, stained and imaged. Scale bar represents 500 μm. d Plot of normalized Sox2 expression in single cells of WT E8.25 embryos. 16 biologically independent embryos (n) were analyzed. Boxplots show minimum, maximum, median, first, and third quartiles. Plot was modified from marionilab. cruk.cam.ac.uk/organogenesis/.
Supplementary Material
Acknowledgements
We would like to thank all members of the Unit on Genome Structure and Regulation for comments and discussions on this project and manuscript as well as K. Pfeifer, T. Macfarlan and J. Kassis. We thank H. Schrewe for tips on AFG isolation and N. Saiz for blastocyst IF and image analysis. We thank NICHD’s molecular genetics core, specifically S. Coon, T. Li and J. Iben. This work uses the computational resources of the NIH HPC Biowulf cluster (hpc.nih.gov). We thank L. Price for cell sorting experiments. We thank the mouse core of NICHD, specifically J. Yimdjo, V. Biggs and A. Grinberg. We also thank the NCI’s molecular histopathology core, especially T. Morgan, J. Mata and B. Karim. This work was funded by NIH intramural project HD008975 (to P.P.R.), HD008986 (to R.K.D.), HD008962 (to T.J.P.) and the Canadian Institutes of Health Research FRN 153186 (to J.A.M.). This project has also been funded in part with Federal funds from the National Cancer Institute, National Institutes of Health, under contract HHSN261201500003I. The content of this publication does not necessarily reflect the views or policies of the Department of Health and Human Services nor does mention of trade names, commercial products or organizations imply endorsement by the US Government.
Footnotes
Competing interests
The authors declare no competing interests.
Extended data is available for this paper at https://doi.org/10.1038/s41588-022-01295-6.
Supplementary information The online version contains supplementary material available at https://doi.org/10.1038/s41588-022-01295-6.
Peer review information Nature Genetics thanks Bing Ren and the other, anonymous, reviewer(s) for their contribution to the peer review of this work. Peer reviewer reports are available.
Reprints and permissions information is available at www.nature.com/reprints.
Data availability
A list of publicly available data used in this study can be found in Supplementary Table 2, which includes data from refs. 22,94,106–111. All datasets were shown using processed files as available except for files mapped to mm9, which were converted to mm10 using CrossMap112. FASTQ and processed CHi-C and RAD21 E11.5 head ChIP-seq data can be found in GEO under accession number GSE190359 at ncbi.nlm.nih.gov/geo. CHi-C data can also be easily navigated at resgen.io/pedrorocha/sox2/views/.
References
- 1.Long HK, Prescott SL & Wysocka J. Ever-changing landscapes: transcriptional enhancers in development and evolution. Cell 167, 1170–1187 (2016). [DOI] [PMC free article] [PubMed] [Google Scholar]
- 2.de Laat W. & Duboule D. Topology of mammalian developmental enhancers and their regulatory landscapes. Nature 502, 499–506 (2013). [DOI] [PubMed] [Google Scholar]
- 3.Schuijers J. et al. Transcriptional dysregulation of MYC reveals common enhancer-docking mechanism. Cell Rep. 23, 349–360 (2018). [DOI] [PMC free article] [PubMed] [Google Scholar]
- 4.Kubo N. et al. Promoter-proximal CTCF binding promotes distal enhancer-dependent gene activation. Nat. Struct. Mol. Biol. 28, 152–161 (2021). [DOI] [PMC free article] [PubMed] [Google Scholar]
- 5.Tang Z. et al. CTCF-mediated human 3D genome architecture reveals chromatin topology for transcription. Cell 163, 1611–1627 (2015). [DOI] [PMC free article] [PubMed] [Google Scholar]
- 6.Vian L. et al. The energetics and physiological impact of cohesin extrusion. Cell 173, 1165–1178 (2018). [DOI] [PMC free article] [PubMed] [Google Scholar]
- 7.Kane L. et al. Cohesin is required for long-range enhancer action at the Shh locus. Nat. Struct. Mol. Biol. 29, 891–897 (2022). [DOI] [PMC free article] [PubMed] [Google Scholar]
- 8.Nora EP et al. Targeted degradation of CTCF decouples local insulation of chromosome domains from genomic compartmentalization. Cell 169, 930–944 (2017). [DOI] [PMC free article] [PubMed] [Google Scholar]
- 9.Schwarzer W. et al. Two independent modes of chromatin organization revealed by cohesin removal. Nature 551, 51–56 (2017). [DOI] [PMC free article] [PubMed] [Google Scholar]
- 10.Rao SSP et al. Cohesin loss eliminates all loop domains. Cell 171, 305–320 (2017). [DOI] [PMC free article] [PubMed] [Google Scholar]
- 11.Fudenberg G. et al. Formation of chromosomal domains by loop extrusion. Cell Rep. 15, 2038–2049 (2016). [DOI] [PMC free article] [PubMed] [Google Scholar]
- 12.Li Y. et al. The structural basis for cohesin-CTCF-anchored loops. Nature 578, 472–476 (2020). [DOI] [PMC free article] [PubMed] [Google Scholar]
- 13.Deng W. et al. Controlling long-range genomic interactions at a native locus by targeted tethering of a looping factor. Cell 149, 1233–1244 (2012). [DOI] [PMC free article] [PubMed] [Google Scholar]
- 14.Weintraub AS et al. YY1 Is a structural regulator of enhancer–promoter loops. Cell 171, 1573–1588 (2017). [DOI] [PMC free article] [PubMed] [Google Scholar]
- 15.Richter WF, Nayak S, Iwasa J. & Taatjes DJ The mediator complex as a master regulator of transcription by RNA polymerase II. Nat. Rev. Mol. Cell Biol. 23, 732–749 (2022). [DOI] [PMC free article] [PubMed] [Google Scholar]
- 16.Pombo A. & Dillon N. Three-dimensional genome architecture: players and mechanisms. Nat. Rev. Mol. Cell Biol. 16, 245–257 (2015). [DOI] [PubMed] [Google Scholar]
- 17.Oudelaar AM & Higgs DR The relationship between genome structure and function. Nat. Rev. Genet. 22, 154–168 (2021). [DOI] [PubMed] [Google Scholar]
- 18.Furlong EEM & Levine M. Developmental enhancers and chromosome topology. Science 361, 1341–1345 (2018). [DOI] [PMC free article] [PubMed] [Google Scholar]
- 19.Schoenfelder S. & Fraser P. Long-range enhancer–promoter contacts in gene expression control. Nat. Rev. Genet. 20, 437–455 (2019). [DOI] [PubMed] [Google Scholar]
- 20.Zhang S, Übelmesser N, Barbieri M. & Papantonis A. Enhancer–promoter contact formation requires RNAPII and antagonizes loop extrusion. Preprint at bioRxiv 10.1101/2022.07.04.498738 (2022). [DOI] [PubMed] [Google Scholar]
- 21.Sexton T. et al. Three-dimensional folding and functional organization principles of the Drosophila genome. Cell 148, 458–472 (2012). [DOI] [PubMed] [Google Scholar]
- 22.Bonev B. et al. Multiscale 3D genome rewiring during mouse neural development. Cell 171, 557–572 (2017). [DOI] [PMC free article] [PubMed] [Google Scholar]
- 23.Rao SS et al. A 3D map of the human genome at kilobase resolution reveals principles of chromatin looping. Cell 159, 1665–1680 (2014). [DOI] [PMC free article] [PubMed] [Google Scholar]
- 24.Nora EP et al. Spatial partitioning of the regulatory landscape of the X-inactivation centre. Nature 485, 381–385 (2012). [DOI] [PMC free article] [PubMed] [Google Scholar]
- 25.Dixon JR et al. Topological domains in mammalian genomes identified by analysis of chromatin interactions. Nature 485, 376–380 (2012). [DOI] [PMC free article] [PubMed] [Google Scholar]
- 26.Lupianez DG et al. Disruptions of topological chromatin domains cause pathogenic rewiring of gene–enhancer interactions. Cell 161, 1012–1025 (2015). [DOI] [PMC free article] [PubMed] [Google Scholar]
- 27.Narendra V. et al. CTCF establishes discrete functional chromatin domains at the Hox clusters during differentiation. Science 347, 1017–1021 (2015). [DOI] [PMC free article] [PubMed] [Google Scholar]
- 28.Kraft K. et al. Serial genomic inversions induce tissue-specific architectural stripes, gene misexpression and congenital malformations. Nat. Cell Biol. 21, 305–310 (2019). [DOI] [PubMed] [Google Scholar]
- 29.Engel N, Raval AK, Thorvaldsen JL & Bartolomei SM Three-dimensional conformation at the H19/Igf2 locus supports a model of enhancer tracking. Hum. Mol. Genet. 17, 3021–3029 (2008). [DOI] [PMC free article] [PubMed] [Google Scholar]
- 30.Despang A. et al. Functional dissection of the Sox9–Kcnj2 locus identifies nonessential and instructive roles of TAD architecture. Nat. Genet. 51, 1263–1271 (2019). [DOI] [PubMed] [Google Scholar]
- 31.Ghavi-Helm Y. et al. Highly rearranged chromosomes reveal uncoupling between genome topology and gene expression. Nat. Genet. 51, 1272–1282 (2019). [DOI] [PMC free article] [PubMed] [Google Scholar]
- 32.Rodriguez-Carballo E. et al. Chromatin topology and the timing of enhancer function at the HoxD locus. Proc. Natl Acad. Sci. USA 117, 31231–31241 (2020). [DOI] [PMC free article] [PubMed] [Google Scholar]
- 33.Williamson I. et al. Developmentally regulated Shh expression is robust to TAD perturbations. Development 146, dev179523 (2019). [DOI] [PMC free article] [PubMed] [Google Scholar]
- 34.Amandio AR et al. Sequential in cis mutagenesis in vivo reveals various functions for CTCF sites at the mouse HoxD cluster. Genes Dev. 35, 1490–1509 (2021). [DOI] [PMC free article] [PubMed] [Google Scholar]
- 35.Paliou C. et al. Preformed chromatin topology assists transcriptional robustness of Shh during limb development. Proc. Natl Acad. Sci. USA 116, 12390–12399 (2019). [DOI] [PMC free article] [PubMed] [Google Scholar]
- 36.Misteli T. The self-organizing genome: principles of genome architecture and function. Cell 183, 28–45 (2020). [DOI] [PMC free article] [PubMed] [Google Scholar]
- 37.Beagan JA & Phillips-Cremins JE On the existence and functionality of topologically associating domains. Nat. Genet. 52, 8–16 (2020). [DOI] [PMC free article] [PubMed] [Google Scholar]
- 38.Mirny L. & Dekker J. Mechanisms of chromosome folding and nuclear organization: their interplay and open questions. Cold Spring Harb. Perspect. Biol. 14, a040147 (2022). [DOI] [PMC free article] [PubMed] [Google Scholar]
- 39.Avilion AA et al. Multipotent cell lineages in early mouse development depend on SOX2 function. Genes Dev. 17, 126–140 (2003). [DOI] [PMC free article] [PubMed] [Google Scholar]
- 40.Li Y. et al. CRISPR reveals a distal super-enhancer required for Sox2 expression in mouse embryonic stem cells. PLoS ONE 9, e114485 (2014). [DOI] [PMC free article] [PubMed] [Google Scholar]
- 41.Zhou HY et al. A Sox2 distal enhancer cluster regulates embryonic stem cell differentiation potential. Genes Dev. 28, 2699–2711 (2014). [DOI] [PMC free article] [PubMed] [Google Scholar]
- 42.Taylor T. et al. Transcriptional regulation and chromatin architecture maintenance are decoupled functions at the Sox2 locus. Genes Dev. 36, 699–717 (2022). [DOI] [PMC free article] [PubMed] [Google Scholar]
- 43.Brosh R. et al. Synthetic regulatory genomics uncovers enhancer context dependence at the Sox2 locus. Preprint at bioRxiv 10.1101/2022.06.20.495832 (2022). [DOI] [PMC free article] [PubMed] [Google Scholar]
- 44.Saiz N, Kang M, Schrode N, Lou X. & Hadjantonakis AK Quantitative analysis of protein expression to study lineage specification in mouse preimplantation embryos. J. Vis. Exp. 22, 53654 (2016). [DOI] [PMC free article] [PubMed] [Google Scholar]
- 45.Chazaud C, Yamanaka Y, Pawson T. & Rossant J. Early lineage segregation between epiblast and primitive endoderm in mouse blastocysts through the Grb2-MAPK pathway. Dev. Cell 10, 615–624 (2006). [DOI] [PubMed] [Google Scholar]
- 46.Wicklow E. et al. HIPPO pathway members restrict SOX2 to the inner cell mass where it promotes ICM fates in the mouse blastocyst. PLoS Genet. 10, e1004618 (2014). [DOI] [PMC free article] [PubMed] [Google Scholar]
- 47.Anania C. et al. In vivo dissection of a clustered-CTCF domain boundary reveals developmental principles of regulatory insulation. Nat. Genet. 54, 1026–1036 (2022). [DOI] [PMC free article] [PubMed] [Google Scholar]
- 48.Chang L-H et al. A complex CTCF binding code defines TAD boundary structure and function. Preprint at bioRxiv 10.1101/2021.04.15.440007 (2021). [DOI] [Google Scholar]
- 49.Ferri AL et al. Sox2 deficiency causes neurodegeneration and impaired neurogenesis in the adult mouse brain. Development 131, 3805–3819 (2004). [DOI] [PubMed] [Google Scholar]
- 50.Li PY, Li SQ, Gao SG & Dong DY CRISPR/Cas9-mediated gene editing on Sox2ot promoter leads to its truncated expression and does not influence neural tube closure and embryonic development in mice. Biochem. Biophys. Res. Commun. 573, 107–111 (2021). [DOI] [PubMed] [Google Scholar]
- 51.Denker A. & de Laat W. The second decade of 3C technologies: detailed insights into nuclear organization. Genes Dev. 30, 1357–1382 (2016). [DOI] [PMC free article] [PubMed] [Google Scholar]
- 52.Redolfi J. et al. DamC reveals principles of chromatin folding in vivo without crosslinking and ligation. Nat. Struct. Mol. Biol. 26, 471–480 (2019). [DOI] [PMC free article] [PubMed] [Google Scholar]
- 53.Vos ESM et al. Interplay between CTCF boundaries and a super enhancer controls cohesin extrusion trajectories and gene expression. Mol. Cell 81, 3082–3095 (2021). [DOI] [PubMed] [Google Scholar]
- 54.Benabdallah NS et al. Decreased enhancer–promoter proximity accompanying enhancer activation. Mol. Cell 76, 473–484 (2019). [DOI] [PMC free article] [PubMed] [Google Scholar]
- 55.Alexander JM et al. Live-cell imaging reveals enhancer-dependent Sox2 transcription in the absence of enhancer proximity. eLife 8, e41769 (2019). [DOI] [PMC free article] [PubMed] [Google Scholar]
- 56.Fulco CP et al. Activity-by-contact model of enhancer-promoter regulation from thousands of CRISPR perturbations. Nat. Genet. 51, 1664–1669 (2019). [DOI] [PMC free article] [PubMed] [Google Scholar]
- 57.Favaro R. et al. Hippocampal development and neural stem cell maintenance require Sox2-dependent regulation of Shh. Nat. Neurosci. 12, 1248–1256 (2009). [DOI] [PubMed] [Google Scholar]
- 58.Beagan JA et al. YY1 and CTCF orchestrate a 3D chromatin looping switch during early neural lineage commitment. Genome Res. 27, 1139–1152 (2017). [DOI] [PMC free article] [PubMed] [Google Scholar]
- 59.Uchikawa M. & Kondoh H. in Sox2 (eds. Kondoh H. & Lovell-Badge R) 107–129 (Academic Press, 2016). [Google Scholar]
- 60.Edwards NA et al. Developmental basis of trachea-esophageal birth defects. Dev. Biol. 477, 85–97 (2021). [DOI] [PMC free article] [PubMed] [Google Scholar]
- 61.Que J. et al. Multiple dose-dependent roles for Sox2 in the patterning and differentiation of anterior foregut endoderm. Development 134, 2521–2531 (2007). [DOI] [PMC free article] [PubMed] [Google Scholar]
- 62.Teramoto M. et al. The absence of SOX2 in the anterior foregut alters the esophagus into trachea and bronchi in both epithelial and mesenchymal components. Biol. Open 9, bio048728 (2020). [DOI] [PMC free article] [PubMed] [Google Scholar]
- 63.Zenteno JC, Perez-Cano HJ & Aguinaga M. Anophthalmia-esophageal atresia syndrome caused by an SOX2 gene deletion in monozygotic twin brothers with markedly discordant phenotypes. Am. J. Med. Genet. A 140, 1899–1903 (2006). [DOI] [PubMed] [Google Scholar]
- 64.Langer L, Sulik K. & Pevny L. Cleft palate in a mouse model of SOX2 haploinsufficiency. Cleft Palate Craniofac. J. 51, 110–114 (2014). [DOI] [PMC free article] [PubMed] [Google Scholar]
- 65.Mandalos N. et al. Sox2 acts as a rheostat of epithelial to mesenchymal transition during neural crest development. Front. Physiol. 5, 345 (2014). [DOI] [PMC free article] [PubMed] [Google Scholar]
- 66.Arnold K. et al. Sox2+ adult stem and progenitor cells are important for tissue regeneration and survival of mice. Cell Stem Cell 9, 317–329 (2011). [DOI] [PMC free article] [PubMed] [Google Scholar]
- 67.Ibarra-Soria X. et al. Defining murine organogenesis at single-cell resolution reveals a role for the leukotriene pathway in regulating blood progenitor formation. Nat. Cell Biol. 20, 127–134 (2018). [DOI] [PMC free article] [PubMed] [Google Scholar]
- 68.Dowen JM et al. Control of cell identity genes occurs in insulated neighborhoods in mammalian chromosomes. Cell 159, 374–387 (2014). [DOI] [PMC free article] [PubMed] [Google Scholar]
- 69.Flavahan WA et al. Insulator dysfunction and oncogene activation in IDH mutant gliomas. Nature 529, 110–114 (2016). [DOI] [PMC free article] [PubMed] [Google Scholar]
- 70.Laugsch M. et al. Modeling the pathological long-range regulatory effects of human structural variation with patient-specific hiPSCs. Cell Stem Cell 24, 736–752 (2019). [DOI] [PubMed] [Google Scholar]
- 71.van Bemmel JG et al. The bipartite TAD organization of the X-inactivation center ensures opposing developmental regulation of Tsix and Xist. Nat. Genet. 51, 1024–1034 (2019). [DOI] [PMC free article] [PubMed] [Google Scholar]
- 72.Hanssen LLP et al. Tissue-specific CTCF-cohesin-mediated chromatin architecture delimits enhancer interactions and function in vivo. Nat. Cell Biol. 19, 952–961 (2017). [DOI] [PMC free article] [PubMed] [Google Scholar]
- 73.de Wit E. et al. CTCF binding polarity determines chromatin looping. Mol. Cell 60, 676–684 (2015). [DOI] [PubMed] [Google Scholar]
- 74.Aljahani A. et al. Analysis of sub-kilobase chromatin topology reveals nano-scale regulatory interactions with variable dependence on cohesin and CTCF. Nat. Commun. 13, 2139 (2022). [DOI] [PMC free article] [PubMed] [Google Scholar]
- 75.Zhang H. et al. CTCF and transcription influence chromatin structure re-configuration after mitosis. Nat. Commun. 12, 5157 (2021). [DOI] [PMC free article] [PubMed] [Google Scholar]
- 76.Hsieh TS et al. Enhancer-promoter interactions and transcription are largely maintained upon acute loss of CTCF, cohesin, WAPL or YY1. Nat. Genet. 54, 1919–1932 (2022). [DOI] [PMC free article] [PubMed] [Google Scholar]
- 77.Zuin J. et al. Nonlinear control of transcription through enhancer-promoter interactions. Nature 604, 571–577 (2022). [DOI] [PMC free article] [PubMed] [Google Scholar]
- 78.Symmons O. et al. The Shh topological domain facilitates the action of remote enhancers by reducing the effects of genomic distances. Dev. Cell 39, 529–543 (2016). [DOI] [PMC free article] [PubMed] [Google Scholar]
- 79.Xiao JY, Hafner A. & Boettiger AN How subtle changes in 3D structure can create large changes in transcription. eLife 10, e64320 (2021). [DOI] [PMC free article] [PubMed] [Google Scholar]
- 80.Rinzema NJ et al. Building regulatory landscapes reveals that an enhancer can recruit cohesin to create contact domains, engage CTCF sites and activate distant genes. Nat. Struct. Mol. Biol. 29, 563–574 (2022). [DOI] [PMC free article] [PubMed] [Google Scholar]
- 81.Huang H. et al. CTCF mediates dosage- and sequence-context-dependent transcriptional insulation by forming local chromatin domains. Nat. Genet. 53, 1064–1074 (2021). [DOI] [PMC free article] [PubMed] [Google Scholar]
- 82.Galupa R. et al. A conserved noncoding locus regulates random monoallelic Xist expression across a topological boundary. Mol. Cell 77, 352–367 (2020). [DOI] [PMC free article] [PubMed] [Google Scholar]
- 83.Pinto PB et al. Enhancer-promoter interactions form independently of genomic distance and are functional across TAD boundaries. Preprint at bioRxiv 10.1101/2022.08.29.505755 (2022). [DOI] [PMC free article] [PubMed] [Google Scholar]
- 84.Schmidt D. et al. Waves of retrotransposon expansion remodel genome organization and CTCF binding in multiple mammalian lineages. Cell 148, 335–348 (2012). [DOI] [PMC free article] [PubMed] [Google Scholar]
- 85.Sundaram V. et al. Widespread contribution of transposable elements to the innovation of gene regulatory networks. Genome Res. 24, 1963–1976 (2014). [DOI] [PMC free article] [PubMed] [Google Scholar]
- 86.Vietri Rudan M. et al. Comparative Hi-C reveals that CTCF underlies evolution of chromosomal domain architecture. Cell Rep. 10, 1297–1309 (2015). [DOI] [PMC free article] [PubMed] [Google Scholar]
- 87.Bourque G. et al. Evolution of the mammalian transcription factor binding repertoire via transposable elements. Genome Res. 18, 1752–1762 (2008). [DOI] [PMC free article] [PubMed] [Google Scholar]
- 88.Lunyak VV et al. Developmentally regulated activation of a SINE B2 repeat as a domain boundary in organogenesis. Science 317, 248–251 (2007). [DOI] [PubMed] [Google Scholar]
- 89.Gu H. et al. Fine-mapping of nuclear compartments using ultra-deep Hi-C shows that active promoter and enhancer elements localize in the active A compartment even when adjacent sequences do not. Preprint at bioRxiv 10.1101/2021.10.03.462599 (2021). [DOI] [Google Scholar]
- 90.Goel VY, Huseyin MK & Hansen AS Region Capture Micro-C reveals coalescence of enhancers and promoters into nested microcompartments. Preprint at bioRxiv 10.1101/2022.07.12.499637 (2022). [DOI] [PMC free article] [PubMed] [Google Scholar]
- 91.Rowley MJ et al. Evolutionarily conserved principles predict 3D chromatin organization. Mol. Cell 67, 837–852 (2017). [DOI] [PMC free article] [PubMed] [Google Scholar]
- 92.Hnisz D, Shrinivas K, Young RA, Chakraborty AK & Sharp PA A phase separation model for transcriptional control. Cell 169, 13–23 (2017). [DOI] [PMC free article] [PubMed] [Google Scholar]
- 93.Oudelaar AM et al. Single-allele chromatin interactions identify regulatory hubs in dynamic compartmentalized domains. Nat. Genet. 50, 1744–1751 (2018). [DOI] [PMC free article] [PubMed] [Google Scholar]
- 94.Thompson JJ et al. Extensive co-binding and rapid redistribution of NANOG and GATA6 during emergence of divergent lineages. Nat. Commun. 13, 4257 (2022). [DOI] [PMC free article] [PubMed] [Google Scholar]
- 95.Chari R, Yeo NC, Chavez A. & Church GM sgRNA Scorer 2.0: a species-independent model to predict CRISPR/Cas9 activity. ACS Synth. Biol. 6, 902–904 (2017). [DOI] [PMC free article] [PubMed] [Google Scholar]
- 96.Gooden AA, Evans CN, Sheets TP, Clapp ME & Chari R. dbGuide: a database of functionally validated guide RNAs for genome editing in human and mouse cells. Nucleic Acids Res. 49, D871–D876 (2021). [DOI] [PMC free article] [PubMed] [Google Scholar]
- 97.D’Astolfo DS et al. Efficient intracellular delivery of native proteins. Cell 161, 674–690 (2015). [DOI] [PubMed] [Google Scholar]
- 98.Czechanski A. et al. Derivation and characterization of mouse embryonic stem cells from permissive and nonpermissive strains. Nat. Protoc. 9, 559–574 (2014). [DOI] [PMC free article] [PubMed] [Google Scholar]
- 99.Mali P. et al. RNA-guided human genome engineering via Cas9. Science 339, 823–826 (2013). [DOI] [PMC free article] [PubMed] [Google Scholar]
- 100.Moorthy SD et al. Enhancers and super-enhancers have an equivalent regulatory role in embryonic stem cells through regulation of single or multiple genes. Genome Res. 27, 246–258 (2017). [DOI] [PMC free article] [PubMed] [Google Scholar]
- 101.Ding Q. et al. Enhanced efficiency of human pluripotent stem cell genome editing through replacing TALENs with CRISPRs. Cell Stem Cell 12, 393–394 (2013). [DOI] [PMC free article] [PubMed] [Google Scholar]
- 102.Zalc A. et al. Reactivation of the pluripotency program precedes formation of the cranial neural crest. Science 371, eabb4776 (2017). [DOI] [PMC free article] [PubMed] [Google Scholar]
- 103.Servant N. et al. HiC-Pro: an optimized and flexible pipeline for Hi-C data processing. Genome Biol. 16, 259 (2015). [DOI] [PMC free article] [PubMed] [Google Scholar]
- 104.Kerpedjiev P. et al. HiGlass: web-based visual exploration and analysis of genome interaction maps. Genome Biol. 19, 125 (2018). [DOI] [PMC free article] [PubMed] [Google Scholar]
- 105.Kruse K, Hug CB & Vaquerizas JM FAN-C: a feature-rich framework for the analysis and visualisation of chromosome conformation capture data. Genome Biol. 21, 303 (2020). [DOI] [PMC free article] [PubMed] [Google Scholar]
- 106.Hansen AS, Pustova I, Cattoglio C, Tjian R. & Darzacq X. CTCF and cohesin regulate chromatin loop stability with distinct dynamics. eLife 6, e25776 (2017). [DOI] [PMC free article] [PubMed] [Google Scholar]
- 107.Kagey MH et al. Mediator and cohesin connect gene expression and chromatin architecture. Nature 467, 430–435 (2010). [DOI] [PMC free article] [PubMed] [Google Scholar]
- 108.Whyte WA et al. Master transcription factors and mediator establish super-enhancers at key cell identity genes. Cell 153, 307–319 (2013). [DOI] [PMC free article] [PubMed] [Google Scholar]
- 109.Xiang Y. et al. Epigenomic analysis of gastrulation identifies a unique chromatin state for primed pluripotency. Nat. Genet. 52, 95–105 (2020). [DOI] [PMC free article] [PubMed] [Google Scholar]
- 110.Gorkin DU et al. An atlas of dynamic chromatin landscapes in mouse fetal development. Nature 583, 744–751 (2020). [DOI] [PMC free article] [PubMed] [Google Scholar]
- 111.Li J. et al. Accurate annotation of accessible chromatin in mouse and human primordial germ cells. Cell Res. 28, 1077–1089 (2018). [DOI] [PMC free article] [PubMed] [Google Scholar]
- 112.Zhao H. et al. CrossMap: a versatile tool for coordinate conversion between genome assemblies. Bioinformatics 30, 1006–1007 (2014). [DOI] [PMC free article] [PubMed] [Google Scholar]
Associated Data
This section collects any data citations, data availability statements, or supplementary materials included in this article.
Supplementary Materials
Data Availability Statement
A list of publicly available data used in this study can be found in Supplementary Table 2, which includes data from refs. 22,94,106–111. All datasets were shown using processed files as available except for files mapped to mm9, which were converted to mm10 using CrossMap112. FASTQ and processed CHi-C and RAD21 E11.5 head ChIP-seq data can be found in GEO under accession number GSE190359 at ncbi.nlm.nih.gov/geo. CHi-C data can also be easily navigated at resgen.io/pedrorocha/sox2/views/.