

Abstract
Previous work showed that movements are accompanied by modulation of electroencephalographic (EEG) activity in both beta (13–30 Hz) and gamma (>30 Hz) ranges. The amplitude of beta event-related synchronization (ERS) is not linked to movement characteristics, but progressively increases with motor practice, returning to baseline after a period of rest. Conversely, movement-related gamma ERS amplitude is proportional to movement distance and velocity. Here, high-density EEG was recorded in 51 healthy subjects to investigate whether i) three-hour practice in two learning tasks, one with a motor component and one without, affects gamma ERS amplitude and connectivity during a motor reaching test, and ii) 90-minutes of either sleep or quiet rest have an effect on gamma oscillatory activity. We found that, while gamma ERS was appropriately scaled to the target extent at all testing points, its amplitude decreased after practice, independently of the type of interposed learning, and after both quiet wake and nap, with partial correlations with subjective fatigue scores. During movement execution, connectivity patterns within fronto-parieto-occipital electrodes, over areas associated with attentional networks, decreased after both practice and after 90-minute rest. While confirming the prokinetic nature of movement-related gamma ERS, these findings demonstrated the preservation of gamma ERS scaling to movement velocity with practice, despite constant amplitude reduction. We thus speculate that such decreases, differently from the practice-related increases of beta ERS, are related to reduced attention or working memory mechanisms due to fatigue or a switch of strategy toward automatization of movement execution and do not specifically reflect plasticity phenomena.
Keywords: Motor control, Gamma oscillations, Event-Related Synchronization (ERS), Connectivity, Reaching movements, Neurorehabilitation
1. Introduction
Accurate planning and execution of voluntary movements are associated with changes in neural oscillatory activity in different frequency ranges. Human and animal studies demonstrated that, in general, movements are accompanied by a gradual reduction (ERD, event-related desynchronization) in the amplitude of beta (12.5–30 Hz) oscillations that begins during the planning and reaches the maximum peak during their execution (Muthukumaraswamy and Johnson, 2004; Neuper et al., 2006; Pfurtscheller, 1981). Once the movement is completed, beta oscillatory activity displays a sharp rebound (event-related synchronization, ERS) (Neuper et al., 2006; Pfurtscheller and Lopes da Silva, 1999). In previous studies, we found that movement-related beta ERS increases with practice (Ricci et al., 2019; Tatti et al., 2019, 2020, 2021) and returns to baseline values after either sleep or quiet rest (Nelson et al., 2021; Tatti et al., 2021), suggesting that movement-related ERS may reflect the energy level involved in plasticity processes (Ghilardi et al., 2021).
Along with this modulation of beta band activity, a prominent synchronization of gamma oscillations (>30 Hz) has been observed in cortical and subcortical regions for a wide range of movements (Cheyne et al., 2008; Crone et al., 1998; Gwin et al., 2011; Gwin and Ferris, 2012; Miller et al., 2007; Pfurtscheller et al., 2003; Pfurtscheller and Neuper, 1992; Seeber et al., 2016, 2015). However, differently from movement-related beta modulation (Cremoux et al., 2013; Salmelin et al., 1995; Stancák and Pfurtscheller, 1995;; Tatti et al., 2019), gamma oscillations display a strong positive correlation with movement characteristics, including movement length, velocity, duration, and applied force level (Ball et al., 2008; Brücke et al., 2012; Cheyne and Ferrari, 2013; Gunduz et al., 2016; Joundi et al., 2012; Lofredi et al., 2018; Muthukumaraswamy, 2010; Nowak et al., 2018; Tatti et al., 2022; Ulloa, 2022,Wang et al., 2017a). Besides the association of gamma frequency with motor output, human and animal studies have shown that the magnitude of gamma activity can also be a good predictor of learning. In particular, gamma power increases in tasks that require working memory and attentional efforts or during training of perceptual processes (Akimoto et al., 2014; Howard et al., 2003; Popov et al., 2012; Shahin et al., 2008; Tallon-Baudry et al., 1999). Nevertheless, these local increases may be present only in the early learning stages, as some studies with motor and visual learning tasks reported an initial rise followed by a decrement of gamma power after full learning was achieved (Madhavan et al., 2019; Perfetti et al., 2011). Therefore, it is plausible that gamma activity is highest only when attentional efforts and other acquisition-related processes are more needed. Attention is an important factor in motor control, in both the planning and execution phases: it plays an essential role in informing the plan about target and limb position, monitoring, and correcting the movement, and assessing its outcome. The need to monitor, correct, and assess movements is greatest when learning a new motor skill and subsides with practice (Marinelli et al., 2017). The waning of attentional resources may also be a consequence of mental fatigue induced by extensive or intensive activities, such as learning. In turn, attention variations should be reflected by changes in the gamma band and, in particular, during movement-related gamma ERS. To explore this hypothesis, we analyzed gamma ERS during a simple motor test, mov, repeated before and after three hours of learning. The intensive learning used during the three-hour training encompassed one of two tasks, ROT, a task of visuo-motor adaptation, and VSEQ, a purely visual sequence learning task. Differently from ROT, VSEQ did not have any motor demands, but the two tasks shared the use of attention and executive control processes.
Moreover, here we examined how a period of rest impacts movement-related gamma activity, as we previously found that sleep has distinct effects on practice-related changes in theta (4–8 Hz) and beta (13.5–25 Hz) oscillatory activity (Nelson et al., 2021; Tatti et al., 2020), we examined how a period of rest impacts movement-related gamma activity. Indeed, sleep has an important role in supporting the plastic changes necessary for learning, adaptation, and consolidation (Klinzing et al., 2019; Tononi and Cirelli, 2014). Thus, in this study, we determined: i) whether the amplitude of movement-related gamma ERS, average gamma power, connectivity patterns, and graph measures change after three hours of training and, if so, whether there is a difference based on the type of training (visuo-motor or purely visual learning); ii) if a 90-minute rest, with or without sleep, restores such changes; iii) whether the scaling of movement-related gamma ERS to target distance and velocity is preserved across the testing points.
2. Materials and methods
2.1. Subjects and experimental design
A total of 51 subjects were assigned to two groups: one group (28 participants, mean age ±SD: 24.4 ± 4.0 years, 16 women) performed three blocks of a visuomotor adaptation task (ROT) and the other (23 subjects, mean age±SD: 23.3 ± 4.6 years, 12 women) a visual sequence learning task (VSEQ). All participants were right-handed, without a history of neurological problems and color vision impairment. They were instructed to sleep an average of 7–8 h per night for at least a week before the experiment, with consistent bed and rise times, and to avoid any beverage containing caffeine the day of the experiment.
This investigation was approved by the CUNY University Integrated Institutional Review Board (UI-IRB) and performed in accordance with the ethical principles of the Declaration of Helsinki and its subsequent amendments. Each participant signed an IRB-approved informed consent form before the experiment.
2.2. Experimental procedure
Participants were seated around 8 AM in a sound-shielded room in front of a computer display and fitted with a high-density 256-channel HydroCel Geodesic Sensor EEG Net (Electrical Geodesics Inc., Eugene, OR).
A motor test (mov, see test description below) was performed in the morning before (mov0) and after (mov3) three blocks of either ROT, a visuo-motor adaptation task, or VSEQ, a visual sequence learning task. After a brief lunch, participants were further divided into two sub-groups: one group was asked to take a nap (ROT: n = 15, mean±SD 25.18±4.58 years; VSEQ: n = 12, 24.40±5.73) and another to rest while listening to an audiobook (ROT: n = 13, mean±SD 23.45±3.01 years; VSEQ: n = 11, 22.17±2.57). At the end of this resting period, subjects were tested again with a mov test (mov4) (Fig. 1A). Importantly, after each block of the learning tasks, tiredness was evaluated by requesting the participants to rate their perceived tiredness on a scale from 1 (minimal tiredness) to 10 (highest level of tiredness).
Fig. 1.
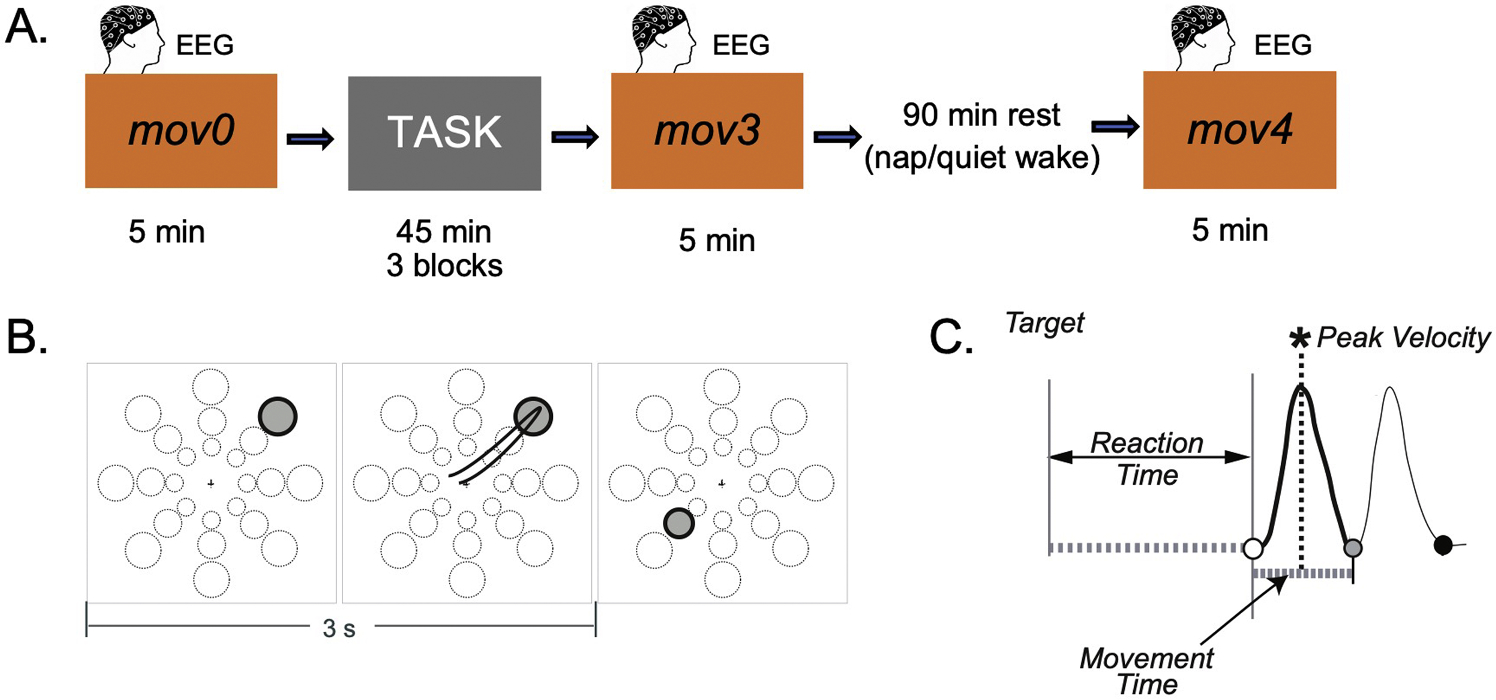
A) Experimental paradigm. Participants completed three 45-minute blocks of either a visuomotor adaptation (ROT) or a visual sequence learning (VSEQ) task. Before and after the learning blocks, participants completed a 5-minute planar reaching movement test (mov) for a total of 96 reaching movements. After three blocks of practice, the participants had a 90-minute interval of either nap or quiet wake, followed by another mov test (mov4). B. mov test. One of 24 targets (three distances, eight directions) appeared in unpredictable order every 3 s. Participants were asked to reach the target as fast and accurately as possible by moving their right hand on a graphic tablet. C. Temporal profile of velocity displaying the kinematic features included in this study: Reaction Time is the time difference between target appearance and movement onset; Movement Time is the time difference between movement onset and return; Peak Velocity is the first relative velocity maximum from onset to reversal.
2.2.1. mov test
The characteristics of this test have been previously detailed (Nelson et al., 2021; Ricci et al., 2019; Tatti et al., 2019, 2020, 2021, 2022) and are presented in Fig. 1B. Briefly, participants were required to perform straight out and back movements with their right arm by moving a cursor on a digitizing tablet from a central starting point to a target appearing on the screen. One of 24 targets appeared every 3 s as a filled black circle presented in random order at three distances (4, 7, and 10 cm; radius: 0.5, 1, and 1.25 cm, respectively) and eight directions, for a total of 96 movements and about 5-minute testing (Fig. 1B). There was no rest between consecutive target presentations. The central starting point and the cursor were always visible on the screen, whereas their right hand was hidden by an opaque surface. Instructions were to reach the target as soon and as fast as possible, with overlapping out-and-back movements, without corrections, and without stopping in the target circle. In the week before the experiment, participants were trained to perform simple reaching movements to ensure their familiarity with the equipment and their ability to perform the movements as required. Subjects reached 95 % proficiency in mov after less than 3 min of training.
2.2.2. ROT task
This visuomotor adaptation task has been extensively described in previous studies (Huber et al., 2004; Nelson et al., 2021; Perfetti et al., 2011; Tatti et al., 2020). A circular array of eight targets (4 cm distance from a central starting point) was displayed on the screen with a cursor indicating the hand position. One of the targets blackened every 1.5 s in a random unpredictable order. As for mov, participants were asked to reach the target with a single uncorrected movement as fast and accurately as possible. Differently from mov, the direction of the screen cursor was rotated with respect to the actual direction of the moving limb to a maximum of 60°, in steps of 10°, 20°, or 30° every two sets of 56 movements. The use of incremental steps minimized the awareness of the imposed rotation, thus limiting the implementation of cognitive strategies (Marinelli et al., 2017). The after-effects of rotation adaptation on the following mov test were offset with two or three sets without any imposed rotation at the end of each ROT block. As previously reported (Tatti et al., 2020), the mean directional error (i.e., an index of spatial accuracy measured as the difference between the target and hand path direction at the time of peak velocity) was similar in the first and last sets of each ROT block. Participants performed three 45-min ROT blocks, for a total of 1176 movements per block.
2.2.3. VSEQ task
In this purely visual sequence learning task, participants were asked to memorize and recall 12-element spatial sequences in 45-minute sessions (Ghilardi et al., 2003, 2009; Moisello et al., 2013; Steinemann et al., 2016; Tatti et al., 2020). Sequence elements were displayed on the screen as circles at a 4 cm distance from a central point. In each sequence, one of the circles blackened for 300 ms every 1.5 s. After three presentations of a single sequence, the participant verbally reported the order of the appearance of the targets. The same sequence was repeated until the participant reported the correct presentation order. At that point, a new sequence was presented. As per ROT, participants completed three 45-minute blocks.
2.3. Kinematic analyses of mov
Trajectories of movements in mov were recorded with custom software (MotorTaskManager, E.T.T. s.r.l., Genoa, Italy) and analyzed with ad-hoc MATLAB-based pipelines, as fully described in previous publications (Tatti et al., 2020, 2021). For this study, we focused on the outgoing part of each movement and analyzed features relevant to the specification of movement extent, such as movement time and extent, as well as the mean and peak velocity (Fig. 1C). For each block, we also computed the percentage of correct movements, defined as movements with all the kinematic values within two standard deviations of the baseline (mov0) mean. All the incorrect movements and those rejected during the cleaning of the EEG signal (see below) were excluded from all analyses. This was done to avoid the confounding effects of abnormal movements on gamma oscillatory activity. The percentage of correct movements was computed for each mov test.
To analyze the practice-related changes of kinematic measures of the correct movements we used mixed-model ANOVAs with block (mov0 and mov3) and target distance (short and long targets) as within-subject factors, and task (ROT and VSEQ) as between-subject factor. To test the effects of quiet wake and nap on the afternoon performance (mov4), we used a mixed-model ANOVA, with target distance (short and long) and block (mov3 and mov4) as within-subject factors, and Rest group (nap and quiet wake) as between-subject factor. In all cases, the normality of the distribution of the standardized residuals of each kinematic parameter was confirmed by visual exploration of QQ plots and Kolmogorov-Smirnov and Shapiro-Wilk normality tests.
2.4. EEG recording and analyses
EEG recordings were continuously acquired using a High-density (HD) 256-channel HydroCel Geodesic Sensor Net (Electrical Geodesic Inc.) with a Net Amp 300 amplifier (250 Hz sampling rate, online reference electrode: Cz) and Net Station software (version 5.0). The channel impedances were kept below 50 kΩ throughout the recording to maintain a good signal-to-noise ratio.
EEG data were processed using the public MATLAB toolbox EEGLAB (version 13.6.5b) (Delorme and Makeig, 2004). The continuous signal was filtered using a Finite Impulse Response Filter (FIR) between 1 and 80 Hz and Notch filtered at 60 Hz (59–61 Hz). Then, the signal was segmented in 4-s epochs centered on target onset (−1 to 3 s) and visually checked to remove sporadic artifacts and channels with poor signal quality. After manual artifact rejection, Independent Component Analysis (ICA) with Principal Component Analysis (PCA)-based dimension reduction (max 108 components) was run to delete stereotypical artifacts (e.g., eye blinks, muscular activity, and heartbeat). Components were rejected based on a visual assessment of the power spectral density, topographical maps, and time course of each estimated component. Spherical spline interpolation was applied to reconstruct the signal of the rejected electrodes, whereas those located on the cheeks and neck were removed. Finally, the signal was re-referenced on the average of the remaining 180 electrodes. Importantly, all the subsequent analyses on mov were carried out on the correct movements only to avoid possible confounding effects from improperly executed movements. Thus, we removed epochs representing movements whose kinematic parameters exceeded two SD (see above) and time-locked the epoch window to movement onset (−1 to 2.5 s).
After trial rejection, the average number of trials (±SD) per participant was 74.26±15.80. For this study, we focused on the movements to short (number of trials per participant: mean±SD: 25.6 ± 4.6) and long (mean±SD: 24.4 ± 5.2) targets.
EEG was recorded also during the nap and quiet wake periods and was analyzed according to standard guidelines (Berry et al., 2017), as detailed in previous papers (Tatti et al., 2020; Nelson et al., 2021; Ricci et al., 2019). Briefly, we ascertained that, in the nap group, sleep was equally consolidated and deep after both VSEQ and ROT. Indeed, after both VSEQ and ROT, subjects slept for an average of 75 % (SE: 5 %) or 76 % (4 %), respectively. All of them reached the N2 stage and most reached the N3 stage. In the quiet rest group, all the subjects were awake for at least 90 % of the time. However, four subjects briefly reached the N1 stage for 9 % of the time (VSEQ, N = 2, mean: 9 ± 4 %; ROT, N = 2, 9 ± 2 %). More details have been published in Tatti et al. (2020).
2.5. Gamma ERS spectral analyses
Time-frequency representations (1–80 Hz) were computed using the MATLAB-based Fieldtrip Toolbox (Oostenveld et al., 2011) by convolving the signal using Complex Morlet Wavelets at linearly spaced frequencies (1–80 Hz, 0.5 Hz bins steps) and a constant time window (−1 to 2.5 s). The number of wavelet cycles and length were increased as a function of frequency (from 3 to 10 cycles, 3.14–0.11 s). Importantly, since the recorded data were previously low-passed filtered at 80 Hz, in the present study we could not analyze gamma activity higher than 80 Hz. However, as demonstrated in our recent publication (Tatti et al., 2022) and in previous research (Leunissen et al., 2022; Ulloa, 2022), movement-related gamma oscillations are generally centered around 70 Hz. Therefore, our analyses included the fundamental gamma frequency during movement execution.
In order to analyze the modulation of gamma oscillatory activity related to movement planning and execution, we baseline-corrected the signal by removing the background gamma activity during each trial. Accordingly, each trial was baseline corrected by subtracting and dividing the average signal of the entire trial time window (−0.5 to 2.5 s). Compared to the use of a resting baseline, this approach ensured the analysis of movement-related gamma ERS independently from the changes occurring in the background EEG activity. Nonetheless, in order to make sure that the practice-related changes in gamma ERS were not related to changes in the background activity, we also checked whether the average gamma amplitude would differ among the mov tests.
EEG time-frequency analyses were run using the non-parametric cluster-based permutation procedure implemented in Fieldtrip (Maris and Oostenveld, 2007). At the first level of analysis, the null hypothesis that the two conditions’ time bins are equal (paired t-test) was tested using a critical alpha of 0.01. The false-alarm rate was controlled by applying cluster correction under each permutation distribution, with a threshold of four significant channels to form a cluster. The cluster-level statistic was computed using the sum of the t values within each cluster of electrodes, and then the largest statistic value from the cluster-level analysis was finally compared with a distribution of maximum cluster values obtained with 10,000 permutations (Monte Carlo method).
We first determined the topography and temporal course of gamma oscillatory activity (30–80 Hz) during mov. We thus combined the mov0 data of the two groups (ROT and VSEQ) and ran a non-parametric permutation statistic to compare the time course activity with the average normalized spectral power in the broad gamma band (30–80 Hz, paired t-statistics, 24 ms time bins, for the time window from 500 ms before the movement onset to 2500 ms after the movement onset). Significant consecutive time windows were then averaged to summarize the topographical distribution of gamma and select the electrodes with the highest movement-related gamma ERS in each significant time window (i.e., ROI). The ROIs consisted of the electrode with the highest gamma ERS and the six neighbor ones (Fig. 2).
Fig. 2.

A. Scalp distribution of gamma oscillatory activity during the baseline mov test (mov0). B. Monte Carlo cluster-based permutation analysis identified two significant time windows in the planning (from 176 to 52 ms before movement onset) and execution windows (from movement onset – i.e., 0 ms - to 552 ms after movement onset). ROIs for the planning and execution phases are displayed as white dots and were selected based on the electrode with the maximum gamma ERS value and the six neighbor ones.
Importantly, as discussed in the results section, the same scalp distribution of gamma oscillatory activity was observed for the VSEQ and ROT groups separately (Supplemental Figure 1) and during mov3 and mov4 (Supplemental Figure 2). For every participant, we then extracted the amplitude of gamma from the selected ROIs during the planning (from 176 to 52 ms before movement onset) and the execution (from 0 to 552 ms after movement onset) time windows at baseline (mov0), after three blocks of practice (mov3), and after a period of rest (mov4).
Importantly, based on our previous finding of gamma ERS in the medium and high range for the planning and execution windows, respectively, we extracted gamma ERS values not only for broad gamma (30–80 Hz), but also for the medium gamma (40.5–55 Hz), and high-gamma (65–80 Hz) frequency ranges.
Due to the violation of normality assumption assessed by visual exploration of QQ-plots and Kolmogorov-Smirnov and Shapiro-Wilk normality tests on the residuals of ANOVA test, all the subsequent analyses on gamma ERS were conducted using a non-parametric approach. Specifically, non-parametric Wilcoxon Signed Rank tests were run to explore whether: i) gamma ERS were scaled according to target distance, and ii) extended practice affected the amplitude of gamma oscillations. Between-group practice (movROT vs movVSEQ) and resting condition (Nap vs Quiet wake) differences were assessed with non-parametric Kruskal-Wallis Tests.
2.6. EEG functional connectivity analysis
To characterize any practice-related changes in gamma functional connectivity, we computed the squared weighted phase lag index (wPLI), a measure of phase coherence.
This connectivity metric is a modified version of the PLI that minimizes the contribution of zero-lag interactions (Vinck et al., 2011). As such, this method allows to identify true time-lagged functional couplings of brain activity at the sensor level, while disregarding apparent zero-lag connectivity driven by real and spurious relationships. Additionally, the wPLI is characterized by a good performance in detecting functional couplings presenting a mixture of linear and nonlinear dynamics, as well as by high topographic accuracy, thus supporting its use in complex network analysis at the sensor level. The wPLI is derived from Stam’s Phase Lag Index (Stam et al., 2007) but adds a phase-difference weighting normalization with the imaginary component of the cross-spectrum (Nolte et al., 2004); this correction allows to control for the confounding effects of volume conduction of independent sources to different electrodes, granting a good statistical power and a more reliable estimation of connectivity from the electrodes’ signal.
Phase-synchronization estimates were computed using Fieldtrip’s debiased wPLI by 1) obtaining the spectrum and cross-spectrum of a signal, and 2) weighting the cross-spectrum with its average imaginary component (Vinck et al., 2011). The debiased WPLI is summarized with the following formula:
where denotes the expected value operator and the imaginary component of the cross-spectrum. Accordingly, we first computed the power and cross-spectrum during the planning and execution time windows using multi-taper Fast Fourier Transformation with Slepian sequence for the broad gamma, medium gamma, and high-gamma frequency ranges. The debiased wPLI was then computed across all channel pairs, to obtain a weighted network for each time window (mov0, mov3, and mov4) and each frequency band (broad, medium, and high gamma). These networks were represented as a 180×180 adjacency matrix , where each node and edge are represented respectively by an electrode and the node-wise functional connectivity estimated with the debiased wPLI. All negative correlations were set to a small value of epsilon (MATLAB command eps, equivalent to 2.22 × 10⁻¹⁶) and not to 0 to ensure that the functional connectomes were connected graphs. One subject was excluded from all connectivity analyses due to a technical problem. Thus, connectivity analyses were run on 50 subjects.
2.6.1. Network-based statistical analysis
The functional connectivity matrices in the statistically defined planning and movement time windows were exported to be analyzed with Network Based Statistics (NBS) (Zalesky et al., 2010). NSB allows multiple hypothesis testing at the level of interconnected sub-networks while controlling the family-wise error rate associated with mass-univariate analyses on every connection (Zalesky et al., 2010). It first computes the connections exceeding a test statistic threshold belonging to a given connected component. Then, a corrected p-value is computed for each component using the null distribution of maximal connected component size, which is empirically derived using nonparametric permutation testing with 10,000 random permutations. Finally, the empirically determined components were tested with the proportion of permutations yielding a component with equal or greater size, correcting for the family-wise error rate at the cluster level with alpha set to 0.01. Here, a primary threshold t-score of 3.9 was chosen. The results are presented as three-dimensional graph visualizations, representing p<0.01 connection pairs surviving correction for multiple comparisons.
2.6.2. Graph theory analysis
Graph theory and network analysis have played a major role in highlighting the architecture of structural and functional brain connectomes (Rubinov and Sporns, 2010).
Briefly, network neuroscience is primarily concerned with the topological architecture of the brain network - that is a general set of brain elements endowed with some relationship among them (Papo et al., 2014). Graph theory holds the potential to unveil critical insights into how the brain is organized at the network level during motor processes, shedding light on the underlying mechanisms of movement execution and planning (Tatti et al., 2022). By quantifying functional and/or statistical features of brain networks, complex network measures can be used to study connectivity relationships in single subjects or between-subjects groups (Cacciola et al., 2019), characterizing one or more aspects of global and local brain connectivity, as well as the efficiency, resilience, and organization of the network.
Herein, we used the weighted functional connectomes to compute the following graph theoretical measures as implemented in the MATLAB-based Brain Connectivity Toolbox:
Strength, computed as the average strength across the nodes of the network. The strength of a node (Ki) in an undirected weighted graph is the weighted sum of the edges connected to node i.
Global efficiency, a measure that is inversely proportional to the characteristic path length and quantifies how efficiently the information is exchanged within the network (Latora and Marchiori, 2001; Tatti et al., 2022).
Local efficiency, a measure computed by averaging the local efficiency across the network nodes that reflects the extent of integration between the immediate neighbors of a given node (Wang et al., 2017b). Therefore, it represents a generalization of the clustering coefficient that explicitly considers paths.
2.7. Correlation analyses
Correlations between peak velocity, movement time, movement extent, and mean velocity were computed with Spearman correlation analyses. Similarly, Spearman correlation analyses were used to determine possible associations between gamma ERS amplitude or graph measures with peak velocity, movement time, movement extent, mean velocity, and fatigue scores. Differences between correlation coefficients of kinematic indices with EEG measures across mov blocks (mov0, mov3, mov4) were assessed with non-parametric permutation (10,000 permutations) analyses on correlation indices were computed using the Numerical Python (Numpy), Scientific Python (SciPy), and Pandas packages for Python.
3. Results
3.1. Morning task practice induces tiredness and a decrease in correct movements
The three-hour practice in the morning increased the feeling of tiredness, independently of the performed task (mixed model ANOVA: block: F(1,49)=31.52, p = 0.0000009, VS-MPR=28,923, η2p=0.39; task: F(1,49)=0.19, p = 0.67, VS-MPR=1, η2p=0.004; block*task: F(1, 49)=0.09, p = 0.77, VS-MPR=1, η2p=0.002), so that the corresponding scores at the end of the morning were higher than at the beginning of the session after both VSEQ and ROT training (Table 1A).
Table 1.
A. Mean and SE of tiredness scores in mov0 and mov3 in the ROT and VSEQ groups, 95 % Confidence Interval for Mean Difference with the t and p-values of post-hoc tests.
B. Effect of 90-minute quiet wake and nap on subjective tiredness levels. Mean and SE of tiredness scores in mov3 and mov4 in the quiet wake and nap groups, 95 % Confidence Interval for Mean Difference with the t and p-values of post-hoc tests. Significant p-values are in bold.
| A. | mov0 | mov3 | 95 % CI | t | p |
|---|---|---|---|---|---|
|
| |||||
| ROT | 3.64±0.37 | 5.43±0.38 | −2.09 −0.67 | −4.40 | 0.0001 |
| VSEQ | 3.52±0.45 | 5.13±0.46 | −2.84 −0.38 | −3.59 | 0.0015 |
|
| |||||
| B. | mov3 | mov4 | 95 % CI | t | p |
|
| |||||
| Quiet wake | 5.33±0.42 | 5.21±0.36 | −0.96 1.21 | 0.31 | 0.759 |
| Nap | 5.26±0.42 | 3.89±0.35 | 0.34 2.40 | 3.66 | 0.001 |
As previously reported (Tatti et al., 2019, 2020, 2021, 2022), in all mov tests, movements were in general straight with bell-shaped temporal profile of velocity. The percentage of correct trials decreased in mov3 compared to mov0 after the ROT task, while it remained at baseline levels after VSEQ, as shown by results of ANOVA (block: F(1, 49)=24.28, p = 0.000001, VS-MPR=3212, η2p=0.33; task: F(1, 49)=8.7, p = 0.005, VS-MPR=14.2, η2p=0.15; block*task: F(1, 49)=22.0, p = 0.00002, VS-MPR=1556, η2p=0.31) and post hoc tests (Table 2A). This is in agreement with the concept that mov execution deteriorated only in the group that extensively performed ROT, the task that, like mov, involves the activation of the sensorimotor network. No significant correlation was found between tiredness indices and the percentage of correct numbers.
Table 2.
A. Effect of morning training with ROT and VSEQ tasks. Mean and SE of the percentage of correct movements in mov0 and mov3 in the ROT and VSEQ tasks, 95 % Confidence Interval for Mean Difference with the t and p-values of post-hoc tests. B. Effect of 90-minute quiet wake and nap in the subjects that performed the ROT task in the morning. Mean and SE of the percentage of correct movements in mov3 and mov4 in the quiet wake and nap groups, 95 % Confidence Interval for Mean Difference with the t and p-values of post-hoc tests. C. Effect of 90-minute quiet wake and nap in the subjects that performed the VSEQ task in the morning. Mean and SE of the percentage of correct movements in mov3 and mov4 in the quiet wake and nap groups, 95 % Confidence Interval for Mean Difference with the t and p-values of post-hoc tests. Significant p-values are in bold.
| A. | mov0 | mov3 | 95 % CI | t | p |
|---|---|---|---|---|---|
|
| |||||
| ROT | 81.7 ± 0.75 | 67.7 ± 2.05 | 8.59 19.30 | 7.16 | <0.0001 |
| VSEQ | 80.0 ± 1.26 | 79.6 ± 2.05 | −5.57 6.25 | 0.16 | 0.874 |
|
| |||||
| B. | mov3 | mov4 | 95 % CI | t | p |
|
| |||||
| ROT | |||||
| Quiet wake | 64.7 ± 3.5 | 61.9 ± 4.2 | −4.29 9.92 | 1.13 | 0.279 |
| Nap | 70.4 ± 2.3 | 78.5 ± 2.4 | −14.71 −1.47 | −3.49 | 0.004 |
|
| |||||
| C. | mov3 | mov4 | 95 % CI | t | p |
|
| |||||
| VSEQ | |||||
| Quiet wake | 79.9 ± 3.3 | 80.7 ± 2.8 | −6.55 4.87 | −0.43 | 0.677 |
| Nap | 79.4 ± 2.8 | 78.2 ± 2.6 | −4.25 6.68 | 0.65 | 0.530 |
Additional analyses on kinematic data were performed on the correct trials. Correlation between the average values of kinematic measures confirmed that values of peak and mean velocity were proportional to the target extents in both mov0 and mov3 (Table 3A), without significant differences between the two morning blocks (Table 3B). The results of mixed model ANOVAs supported the finding that movements were appropriately scaled according to target distance. The details of this analysis are reported in the Supplemental Results and Supplemental Table 1. In summary, such analyses revealed that, after both learning tasks, minimal but significant kinematic changes occurred so that correct movements to short targets became slightly longer and those to long targets slightly shorter. These changes may reflect a subtle trend toward planning movements to a default extent, a strategy likely induced either by fatigue or reduced attentional capacity.
Table 3.
A. Spearman correlation coefficients (ρ) between peak velocity (PeakVel), movement time (MovTime), and movement extent (MovExt) in the three mov tests. B. Comparisons of the Spearman coefficients between the different mov blocks. Significant p-values are in bold.
| A. | mov0 | mov3 | mov4 | |||
|---|---|---|---|---|---|---|
|
|
|
|
||||
| ρ | p-value | ρ | p-value | ρ | p-value | |
|
| ||||||
| PeakVel-MovTime | −0.878 | <0.0001 | −0.890 | <0.0001 | −0.914 | <0.0001 |
| MovTime-MovExt | 0.047 | 0.744 | −0.030 | 0.838 | −0.187 | 0.189 |
| MovTime-MeanVel | −0.923 | <0.0001 | −0.912 | <0.0001 | −0.924 | <0.0001 |
| PeakVel-MovExt | 0.261 | 0.064 | 0.349 | 0.012 | 0.421 | 0.002 |
| MeanVel-MovExt | 0.291 | 0.038 | 0.401 | 0.004 | 0.510 | 0.0001 |
|
| ||||||
| B. | mov0-mov3 | mov0-mov4 | mov3-mov4 | |||
|
|
|
|
||||
| T stat | p-value | T stat | p-value | T stat | p-value | |
|
| ||||||
| PeakVel-MovTime | 0.012 | 0.488 | 0.035 | 0.054 | 0.023 | 0.054 |
| PeakVel-MovExt | 0.088 | 0.364 | 0.160 | 0.096 | 0.072 | 0.266 |
| PeakVel-MeanVel | 0.003 | 0.708 | 0.007 | 0.324 | 0.004 | 0.408 |
| MeanVel-MovTime | 0.011 | 0.432 | 0.000 | 0.923 | 0.012 | 0.212 |
| MeanVel-MovExt | 0.110 | 0.273 | 0.219 | 0.028 | 0.109 | 0.111 |
3.2. A period of quiet wake or a nap restores motor performance
We then analyzed the effects of a resting period with and without a nap. At the end of the 90-minute resting period, tiredness levels significantly decreased only in the group that napped, while they did not change in the quiet wake group (ANOVA: block: F(1, 49)=7.53, p = 0.008, VS-MPR=9.11, η2p=0.13; group: F(1, 49)=2.43, p = 0.125, VS-MPR=1.41, η2p=0.05; block*group: F(1, 49)=5.22, p = 0.027, VS-MPR=3.80, η2p=0.10, Table 1B). In separate mixed-model ANOVAs for VSEQ and ROT we then determined whether the percentage of correct movements changed in mov4 compared to mov3. This approach was used because the VSEQ group had more correct movements in mov3 than the ROT one. As also reported in a previous publication (Tatti et al., 2021), in the group practicing ROT, which showed a decrease in correct movements in mov3, the percentage of correct movements increased in mov4 only after a nap but not after a period of quiet rest (block: F(1, 26)=2.41, p = 0.133, VS-MPR=1.37, n2p=0.085; group: F(1, 26)=8.33, p = 0.008, VS-MPR=9.77, n2p=0.24; block*group: F(1, 26)=10.28, p = 0.004, VS-MPR=15.4, n2p=0.28; Table 2B). These results suggest that a beneficial effect on performance was specifically linked to sleep, in line with our previous results that showed an important role of slow wave activity in the restoration of performance after extended motor task practice (Tatti et al., 2020; Nelson et al., 2021).
No changes were found in mov4 for VSEQ after both nap and quiet rest (block: F(1, 21)=0.02, p = 0.89, VS-MPR=1, n2p=0.00; group: F(1, 21)=0.17, p = 0.69, VS-MPR=1, n2p=0.01; block*group: F(1, 21)=0.57, p = 0.457, VS-MPR=1, n2p=0.03; Table 2C), thus maintaining the same levels of both mov0 and mov3.
In the following step, we compared the kinematic indices of mov3 correct movements with those of mov4 after 90 min of either nap or quiet rest with a mixed model ANOVA. Briefly, as detailed in the supplemental results, we found rather small kinematic changes that went in the opposite direction of those found after the three-hour morning training, suggesting that 90-minute rest, with or without sleep, restored performance and overcame, at least partially, the detrimental effects of extended practice (Supplemental Table 2).
3.3. Movement-related gamma ERS power decreases with practice
We first characterized the changes in gamma activity during mov0 in the entire trial window (−0.5 to 2.5 s) with non-parametric cluster-based permutation analyses. In agreement with our previous publication (Tatti et al., 2022), we found that gamma power peaked before the movement onset in the planning window (from −176 to −52 ms) over posterior parietal electrodes (Cluster t = 2169.4, p = 0.012, CI range: 0.0022), shifting to a posterior parietal region during the execution of the out and back movements (i.e. execution time window, from 0 to 552 ms; Cluster t = 14,964, p = 0.0001, CI range: 0.00019) (Fig. 2). The same temporal and topographical patterns were observed in mov3, at the end of the morning after three hours of learning, suggesting that task practice did not alter this dynamic (Supplemental Figure 2).
As in our previous work (Tatti et al., 2022), we found that the amplitude of gamma oscillations in the identified ROIs of both the planning and execution windows was lower for movements to short than for those to long targets in both mov0 and mov3 (Fig. 3; Table 4A; see Supplemental Tables 3 and 4 for the analyses in the medium and high gamma frequency ranges). The scaling of gamma ERS to target extent was similarly present in mov0 and mov3 (Fig. 3, Table 4A). Indeed, positive correlations between both peak and mean velocity and gamma power were similar in mov0 and mov3 (Table 5A) and their strength did not significantly differ (Table 5A).
Fig. 3.

A) EEG time-frequency plots of the gamma band range (30–80 Hz) in the ROIs identified for the planning (left, from 176 to 52 ms before movement onset) and execution (right, from 0 to 552 ms after movement onset) windows for the three mov tests. The color bar represents amplitude changes in the time-frequency signal normalized by the average spectral power of the entire time window. B) Time course of gamma power averaged across trials, electrodes and subjects for each target distance (blue line: long target distance trials; green dashed line: short target distance trials). Please notice that the first gamma ERS peak corresponds to the planning phase, i.e., before the movement onset after the target presentation, while the other two ERS peaks represent the outgoing and the returning parts of the movements, respectively. The shaded area around the line plots represents the standard error of the mean.
Table 4.
Results of non-parametric statistical tests to verify changes of gamma power (30–80 Hz) during the planning and execution windows. A. Comparison of gamma ERS to short and long target distance in mov0 and mov3 with Wilcoxon Signed Rank tests. B. Comparison of the effects of practice in VSEQ and ROT on gamma ERS amplitude to short and long target distance trials in mov0 and mov3 tested with Wilcoxon Signed Rank tests. C. Direct comparisons between mov0 and mov3 on the amplitude of gamma oscillations performed with Kruskal-Wallis Tests. Significant p-values are in bold.
| A. | T | SE | STD Test | p | |
|---|---|---|---|---|---|
|
| |||||
| Planning | |||||
| Target | mov0 | 1219 | 106.68 | 5.21 | 0.0000002 |
| Short vs Long | |||||
| mov3 | 1180 | 106.68 | 4.85 | 0.0000001 | |
| Execution | |||||
| mov0 | 1214 | 106.68 | 5.16 | 0.0000002 | |
| mov3 | 1213 | 106.68 | 5.16 | 0.0000002 | |
|
| |||||
| B. | T | SE | STD Test | p | |
|
| |||||
| Task | Planning mov0 | ||||
| ROT vs VSEQ | |||||
| short | 310 | 52.83 | −0.23 | 0.82 | |
| long | 285 | 52.83 | −0.70 | 0.48 | |
| Planning mov3 | |||||
| short | 273 | 52.83 | −0.93 | 0.35 | |
| long | 317 | 52.83 | −0.09 | 0.92 | |
| Execution mov0 | |||||
| short | 330 | 52.83 | 0.15 | 0.88 | |
| long | 305 | 52.83 | −0.32 | 0.75 | |
| Execution mov3 | |||||
| short | 310 | 52.83 | −0.23 | 0.82 | |
| long | 283 | 52.83 | −0.74 | 0.46 | |
|
| |||||
| C. | U | SE | STD Test | p | |
|
| |||||
| Block | Planning | ||||
| mov0 vs. mov3 | All tasks | ||||
| short | 247 | 106.68 | −3.90 | 0.0001 | |
| long | 276 | 106.68 | −3.63 | 0.0003 | |
| ROT s short | 95 | 43.91 | −2.46 | 0.014 | |
| Long | 97 | 43.91 | −2.41 | 0.016 | |
| VSEQ sshort | 35 | 32.88 | −3.13 | 0.002 | |
| long | 47 | 32.88 | −2.77 | 0.006 | |
| Execution | |||||
| All tasks | |||||
| short | 192 | 106.68 | −4.41 | 0.0000001 | |
| long | 160 | 106.68 | −4.71 | 0.000002 | |
| ROT | |||||
| short | 72 | 43.91 | −2.98 | 0.003 | |
| long | 61 | 43.91 | −3.23 | 0.001 | |
| VSEQ | |||||
| sshort | 29 | 32.88 | −3.31 | 0.001 | |
| long | 21 | 32.88 | −3.56 | 0.0004 | |
Table 5.
A. Spearman rho values from correlation analyses between kinematic indexes and gamma (30–80 Hz) ERS amplitude with p-values for mov0, mov3 and mov4. B) Practice-related changes in the relationship between gamma amplitude and kinematic performance were investigated using a non-parametric permutation approach for repeated correlation measures (10,000 permutations).
| A. | mov0 | mov3 | mov4 | |||
|---|---|---|---|---|---|---|
| ρ | P | ρ | p | ρ | p | |
|
| ||||||
| Mov. Time - Gamma ERS | −0.311 | 0.026 | −0.417 | 0.003 | −0.397 | 0.004 |
| Peak Vel. - Gamma ERS | 0.413 | 0.003 | 0.314 | 0.025 | 0.273 | 0.055 |
| Mov. Extent - Gamma ERS | 0.182 | 0.201 | −0.081 | 0.572 | 0.113 | 0.435 |
| Mean Vel. - Gamma ERS | 0.384 | 0.005 | 0.363 | 0.010 | 0.381 | 0.006 |
|
| ||||||
| B. | mov0 vs mov3 | mov0 vs mov4 | mov3 vs mov4 | |||
|
|
|
|
||||
| Test t | P | Test t | p | Test t | p | |
|
| ||||||
| Mov. Time - Gamma ERS | 0.092 | 0.372 | 0.0727 | 0.493 | 0.0189 | 0.852 |
| Peak Vel. - Gamma ERS | 0.085 | 0.363 | 0.061 | 0.580 | 0.023 | 0.818 |
| Mov. Extent - Gamma ERS | 0.253 | 0.077 | 0.0316 | 0.823 | 0.285 | 0.060 |
| Mean Vel. - Gamma ERS | 0.030 | 0.722 | 0.0124 | 0.903 | 0.0175 | 0.871 |
The most compelling finding was that movement-related gamma power consistently decreased after both types of task practice. Indeed, the comparison of gamma power in the ROI identified in the planning window showed a significant decrease in mov3 compared to mov0 for all targets (Wilcoxon signed rank test: T = 270, SE: 106.7, p = 0.0002). Moreover, similar decreases were found for the ROI of the execution window, with a decrease in mov3 compared to mov0 (T = 190, SE: 103.6, p = 0.00002). This decrease was also evident in separate analyses for short and long targets during both planning and execution, as well as for the broad (Table 4C), medium, and high gamma frequency bands (Supplemental Tables 3A and 4A).
Kruskal-Wallis tests did not reveal any significant effect of the type of learning practice (ROT and VSEQ) (Table 4B), thus suggesting that the observed decrease in gamma ERS did not depend on the type (either motor or non-motor) of the preceding learning practice. Importantly, such gamma ERS decrease cannot be explained by changes in the average gamma power activity, as gamma amplitude averaged during the entire windows of mov0 and mov3 did not significantly differ (Supplemental Table 5).
Finally, we found that changes in the subjective fatigue scores from the beginning to the end of the morning moderately correlated with the mov3-mov0 differences in gamma power during the planning window (r=−0.465; p = 0.0007, 95 % C.I.: −0.218 −0.657; VS-MPR=85.43), suggesting that increase of fatigue with practice was associated with decrease of movement-related gamma ERS.
In summary, the main and novel finding is that the amplitude of movement-related gamma ERS decreased in the morning independently of the type of interposed learning activity. However, this decrease did not have any impact on the proper scaling of gamma power based on movement extent (Fig. 3).
3.4. Movement-related gamma modulation decrement persists after either quiet rest or nap
We then determined whether a period of quiet rest or a nap influenced gamma ERS amplitude, as we found for the beta ERS (Tatti et al., 2020, 2021). Cluster analyses showed that the pattern of activation in mov4 was similar to mov0 and mov3 (Supplemental Figure 2). A positive correlation of gamma ERS to mean velocity during execution was also present in mov4 (Table 5A) without differences from both mov0 and mov3 (Table 5B), suggesting the preservation of gamma ERS scaling across blocks of practice. Further confirmation of scaling preservation comes from the significant difference between the gamma ERS of short and long movements in mov4 (Table 6A). The comparison of gamma ERS between the two groups, nap and quiet rest, revealed no differences for both the planning and the execution window in mov4 (Table 6B). Despite a significant gamma ERS decrease in both the planning and execution phases of mov4 compared to mov0 (Table 6D), no significant differences in gamma power were found between mov3 and mov4 in both temporal windows (Table 6C). Nevertheless, when we compared mov4 and mov3, while there were no differences for short targets, long targets displayed a significant gamma power decrease in mov4 during execution (Table 6C).
Table 6.
Effect of 90-minute rest on gamma ERS. Results of non-parametric statistical tests to verify changes of gamma power during the planning and execution windows. A. Comparison of gamma ERS to short and long target distance in mov4 with Wilcoxon Signed Rank tests. B. Comparison of the effects of nap and quiet rest on gamma ERS amplitude to short and long target distance in mov4 tested with Kruskal-Wallis Tests. C. Direct comparisons between mov3 and mov4 on the amplitude of gamma oscillations performed with Kruskal-Wallis Tests. D. Direct comparisons between mov0 and mov4 on the amplitude of gamma oscillations performed with Kruskal-Wallis Tests. Significant p-values are in bold.
| A. | T | SE | STD Test | p | |
|---|---|---|---|---|---|
|
| |||||
| Target: short vs. long | Planning | 926 | 103.59 | 2.790 | 0.005 |
| mov4 | |||||
| Execution | 940 | 103.59 | 2.920 | 0.003 | |
| mov4 | |||||
|
| |||||
| B. | U | SE | STD Test | p | |
|
| |||||
| Group: nap vs. quiet wake | Planning mov4 | ||||
| Short | 300 | 51.50 | −0.233 | 0.816 | |
| Long | 300 | 51.50 | −0.233 | 0.816 | |
| Execution mov4 | |||||
| Short | 278 | 51.50 | −0.660 | 0.509 | |
| Long | 310 | 51.50 | −0.039 | 0.969 | |
|
| |||||
| C. | U | SE | STD Test | p | |
|
| |||||
| Block: mov3 vs. mov4 | Planning | ||||
| Short | 567 | 103.59 | −0.681 | 0.496 | |
| Long | 441 | 103.59 | −1.897 | 0.058 | |
| Execution | |||||
| Short | 551 | 103.59 | −0.835 | 0.404 | |
| Long | 376 | 103.59 | −2.524 | 0.012 | |
|
| |||||
| D. | U | SE | STD Test | p | |
|
| |||||
| Block: mov0 vs. mov4 | Planning | ||||
| Short | 341 | 103.59 | −2.862 | 0.004 | |
| Long | 190 | 103.59 | −4.320 | 0.00002 | |
| Execution | |||||
| Short | 226 | 103.59 | −3.972 | 0.00007 | |
| Long | 99 | 103.59 | −5.198 | 0.0000002 | |
As for the morning results, the changes in the subjective fatigue scores correlated with the mov4-mov3 differences in gamma power during the planning window (r=−0.339; p = 0.019, 95 % C.I.: −0.060 −0.568; VS-MPR=4.98), suggesting again a link between perceived fatigue levels and movement-related gamma ERS.
In summary, while gamma ERS scaling to target distance was maintained throughout the practice, the decrease of gamma ERS persisted in the afternoon testing with a non-significant trend toward a further decrement. Moreover, unlike movement-related beta ERS (Tatti et al., 2020), this trend was not reversed by a period of either quiet wake or sleep.
3.5. Gamma connectivity of fronto-posterior networks decreases after tasks and rest during movement execution
Previous analyses of the baseline test (mov0), demonstrated that functional connectivity between frontal and parieto-occipital regions was greater in the execution window than in the planning phase (Tatti et al., 2022).
When we analyzed the effect of practice (mov0>mov3), we found sub-networks of decreased functional connectivity in the broad and medium gamma frequency bands only during movement execution without differences between task practice (ROT, VSEQ) (Fig. 4). For the broad gamma band, two subnetworks displayed significantly reduced connectivity in mov3 compared to mov0. The first cluster consisted of 18 edges connecting 19 different electrodes (p = 0.0033), while the second one, which was more lateralized to the left hemisphere, connected 9 electrodes with 12 edges (p = 0.0054). In both cases, the analysis highlighted reduced fronto-posterior connectivity, specifically between the bilateral parieto-occipital and the fronto-central regions. For medium gamma, we found a significant decrease in a network (48 edges connecting 73 electrodes, p = 0.0008), mostly located within the parieto-occipital region. No significant differences were observed in the high gamma frequency band.
Fig. 4.

Movement-related significant sub-network displaying phase connectivity changes after three blocks of practice (mov0>mov3) and after 90-min rest (mov0>mov4). No statistically significant changes occurred between the last block of the morning (mov3) and mov4. The nodes and the links are depicted in the axial and sagittal projections. Colormap indicates the difference in the mean wPLI values between the examined mov tests.
When we analyzed the effects of 90 min of quiet rest and sleep on gamma connectivity, we found no significant differences between mov3 and mov4. However, a direct comparison between mov0 and mov4 highlighted further connectivity decreases in the broad, medium, and high gamma frequency bands (Fig. 4). For the broad gamma band, the subnetwork comprised 98 edges connecting 64 electrodes between the parieto-occipital and frontal regions (p<0.0001). A similar connectivity pattern was also reduced in medium gamma (55 electrodes, 74 edges, p = 0.0003) and high gamma (25 electrodes, 43 edges, p = 0.0004). No significant differences were observed for practice type (VSEQ and ROT) and resting condition (quiet wake, nap) in the examined frequency ranges.
3.6. Gamma strength and local efficiency decreased after tasks and rest during movement execution
We then analyzed the changes in graph measures - strength, local and global efficiency - in the gamma band during the planning and execution time windows (Fig. 5). We found that in mov0, strength and local efficiency were greater during movement execution than during planning (repeated measure ANOVAs, strength: F(1,49)=36.1, p = 0.0000003, VS-MPR=104,792, n2p=0.424; local efficiency: F(1,49)=37.2, p = 0.0000002, VS-MPR=143,124, n2p=0.432; Fig. 5). Mixed-model ANOVAs comparing mov0 and mov3 (Table 7) followed by post-hoc tests first, confirmed that the difference between the two time windows was still present in mov3. However, compared to mov0, both strength and local efficiency in mov3 decreased during execution, independently of the task previously performed. We found no differences between mov3 and mov4 in both the quiet wake and nap groups (Table 7B), although the values reached in mov4 were significantly lower than those in mov0 for the execution window only (Fig. 5, Table 7C). Analysis of global efficiency did not show differences between execution and planning in mov0 (F(1,49)=0.087, p = 0.769, VS-MPR=1, n2p=0.002) and all the other blocks (Table 7). Nevertheless, we found a significant effect of practice with lower values in mov3 compared to mov0 in both planning and execution, independently of the task (Table 7A). In addition, differently from strength and local efficiency, in mov4 global efficiency increased similarly after both the quiet rest and nap (Table 7B), reaching the same values of mov0 (Fig. 5, Table 7C). Interestingly, changes in the subjective fatigue scores, measured as the difference before and after mov4, moderately correlated with the changes in global efficiency from mov3 to mov4 during the execution window (r=−0.480; p = 0.0005, 95 % C.I.: −0.229 −0.670; VS-MPR=98.61), in that during mov4, increasing fatigue scores corresponded to greater decreases of global efficiency. Lower correlations with the same trend were found for local efficiency (r=−0.365; p = 0.01, 95 % C.I.: −0.093 −0.586; VS-MPR=8.04) and strength (r=−0.351; p = 0.013, 95 % C.I.: −0.078 −0.576; VS-MPR=6.407).
Fig. 5.

Graph measures. Barplots displaying the mean and SD of strength, local and global efficiency in the broad gamma band during the planning (black bars) and execution (empty bars) time windows for the three mov blocks.
Table 7.
Results of ANOVAs on graph measurements. A. Effects of morning training with mixed-model ANOVA; within-subject effects: block (mov0, mov3) and time window (planning, execution), between-subject effects: task condition (ROT, VSEQ). B. Effects of 90-minute rest with mixed-model ANOVA; within-subject effects: block (mov3, mov4) and time window (planning, execution), between-subject effects: rest group (quiet wake, nap). C. Cumulative effect of time with repeated measure ANOVA; within-subject effects: block (mov0, mov4) and time window (planning, execution). Significant p-values are reported in bold. p: p values; η2 p: Partial Eta Squared; VS-MPR: Vovk-Sellke Maximum Peak Ratio.
| A. mov0 vs mov3 | ||||
|---|---|---|---|---|
|
|
|
|
|
|
| strength | local efficiency | global efficiency | ||
|
| ||||
| block | F | 18.13 | 21.40 | 7.50 |
| df (1, 48) | ||||
| P | 9.54e−5 | 2.85e−5 | 0.009 | |
| η2 p | 0.274 | 0.308 | 0.139 | |
| VS-MPR | 9.87e+6 | 1234 | 8.969 | |
| window | F | 54.63 | 57.24 | 0.153 |
| df (1, 48) | ||||
| P | 1.85e−9 | 1.00e−9 | 0.698 | |
| η2 p | 0.532 | 0.544 | 0.003 | |
| VS-MPR | 9.87e+6 | 1.77e+7 | 1 | |
| task | F | 0.08 | 0.21 | 0.118 |
| df (1, 48) | ||||
| P | 0.783 | 0.649 | 0.733 | |
| η2 p | 0.002 | 0.004 | 0.002 | |
| VS-MPR | 1 | 1 | 1 | |
| block * task | F | 0.56 | 0.489 | 1.311 |
| P | 0.458 | 0.488 | 0.258 | |
| η2 p | 0.012 | 0.010 | 0.027 | |
| VS-MPR | 1 | 1 | 1.053 | |
| window * task | F | 0.32 | 0.500 | 0.378 |
| P | 0.575 | 0.483 | 0.542 | |
| η2 p | 0.007 | 0.010 | 0.008 | |
| VS-MPR | 1 | 1 | 1 | |
| block * window | F | 9.61 | 11.74 | 1.049 |
| P | 0.003 | 0.001 | 0.311 | |
| η2 p | 0.167 | 0.197 | 0.021 | |
| VS-MPR | 19.82 | 43.66 | 1.013 | |
| block * window * task | F | 0.66 | 0.21 | 0.118 |
| P | 0.663 | 0.649 | 0.733 | |
| η2 p | 0.004 | 0.004 | 0.002 | |
| VS-MPR | 1 | 1 | 1 | |
|
| ||||
| B. mov3 vs mov4 | ||||
|
| ||||
| strength | local efficiency | global efficiency | ||
|
| ||||
| block | F | 0.006 | 0.007 | 9.335 |
| df (1, 48) | ||||
| P | 0.938 | 0.936 | 0.004 | |
| η2 p | 1.83e−5 | 1.35e−4 | 17.9 | |
| VS-MPR | 1 | 1.248 | 0.163 | |
| window | F | 49.048 | 53.531 | 1.511 |
| df (1, 48) | ||||
| P | 7.27e−9 | 2.410e−9 | 0.225 | |
| η2 p | 0.505 | 0.527 | 0.031 | |
| VS-MPR | 2.70e+6 | 7.693e+6 | 1.096 | |
| group | F | 1.837 | 2.019 | 0.507 |
| df (1, 48) | ||||
| P | 0.182 | 0.162 | 0.48 | |
| η2 p | 0.037 | 0.04 | 0.01 | |
| VS-MPR | 1.187 | 1.248 | 1 | |
| block * group | F | 1.432 | 0.545 | 0.406 |
| P | 0.237 | 0.464 | 0.527 | |
| η2 p | 0.029 | 0.011 | 0.008 | |
| VS-MPR | 1.078 | 1 | 1 | |
| window * group | F | 0.786 | 0.799 | 2.487 |
| P | 0.38 | 0.376 | 0.121 | |
| η2 p | 0.016 | 0.016 | 0.049 | |
| VS-MPR | 1 | 1 | 1.437 | |
| block * window | F | 1.014 | 0.822 | 0.07 |
| P | 0.319 | 0.369 | 0.793 | |
| η2 p | 0.021 | 0.017 | 0.001 | |
| VS-MPR | 1.009 | 1 | 1 | |
| block * window * group | F | 0.309 | 0.094 | 0.144 |
| P | 0.581 | 0.761 | 0.706 | |
| η2 p | 0.006 | 0.002 | 0.003 | |
| VS-MPR | 1 | 1 | 1 | |
|
| ||||
| C. mov0 vs mov4 | ||||
|
| ||||
| strength | local efficiency | global efficiency | ||
|
| ||||
| block | F | 16.924 | 20.486 | 0.054 |
| df (1, 48) | ||||
| P | 1.483e−4 | 3.843e−5 | 0.817 | |
| η2 p | 0.257 | 0.295 | 0.001 | |
| VS-MPR | 281.306 | 941.64 | 1 | |
| window | F | 42.679 | 46.467 | 0.052 |
| df (1, 48) | ||||
| p | 3.512e−8 | 1.276e−8 | 0.82 | |
| η2 p | 0.466 | 0.487 | 0.001 | |
| VS-MPR | 610,209 | 1.586e+6 | 1 | |
| window * block | F | 12.356 | 14.463 | 0.673 |
| p | 9.569e−4 | 3.968e−4 | 0.416 | |
| η2 p | 0.201 | 0.228 | 0.014 | |
| VS-MPR | 55.3 | 118.38 | 1 | |
4. Discussion
In this study, we demonstrated that the amplitude of movement-related gamma ERS, but not the average gamma power, diminishes after intensive learning of either a visuo-motor adaptation or a visual sequence task. Neither a nap nor an equivalent period of quiet rest restored gamma ERS to baseline values; rather, after either type of rest, gamma ERS was further reduced compared to baseline, suggesting that gamma ERS amplitude is not related to some homeostatic function of sleep, but it may represent energy reserve, availability, or usage.
Despite these changes, the amplitudes of movement-related gamma ERS were always scaled to the target distance, independently of the block and the previously performed task, thus corroborating the existence of a tight relationship between gamma oscillations and movement features (Tatti et al., 2022). Other important and novel findings of this work include a decrease of gamma connectivity patterns during movement execution between posterior regions and fronto-central areas after task practice, which persisted after both nap and quiet rest. As we discuss in the following paragraphs, these results, together with a parallel decrement in connectivity strength and local efficiency, suggest that changes of movement-related gamma ERS may reflect practice-related variations of attentional resources and executive functions involved in motor control. Importantly, it is unlikely that the EEG findings are related to changes in the movements’ characteristics since all analyses were performed solely on correct movements and only minimal kinematic differences were found across blocks.
4.1. Gamma ERS is always scaled to target distance
Oscillations in the gamma band have been described as “prokinetic”, since they synchronize during voluntary movements and are linked to movement characteristics, such as distance, duration, velocity, and applied force level (Ball et al., 2008; Brücke et al., 2012; Cheyne and Ferrari, 2013; Lofredi et al., 2018; Muthukumaraswamy, 2010; Tatti et al., 2022; Wang et al., 2017a). In particular, our recent work showed that gamma oscillations in normal subjects are modulated by peak velocity during both planning and execution (Tatti et al., 2022). The present results confirm the prokinetic role of gamma and further suggest that the relationship between velocity and gamma ERS power is maintained with practice. The novel finding of this paper is that the amplitude of movement-related gamma ERS was significantly lower at the end of the morning after three hours of intensive practice in two different types of learning. This decrease was strictly confined to ERS and, thus, to gamma activity related to motor performance, as the average gamma power computed across the entire trial window was similar in the three mov blocks. This makes it unlikely that gamma ERS decreased because of circadian factors or the time passing by.
Interestingly, these practice-related gamma ERS changes in mov are in contrast with those we previously found in the beta range, where beta ERD and ERS increased more after ROT training than either after VSEQ (Tatti et al., 2020) or after motor practice without learning (Tatti et al., 2021). In addition, the ROT-related increases of beta ERS were more evident over the left sensorimotor and frontal regions compared to VSEQ and over a frontal area compared to motor task practice without learning. These findings suggest that changes in the beta range may represent local task-specific phenomena, while those in gamma may reflect more general processes. Most importantly, the values of beta ERD and ERS rebounded to baseline levels after 90 min of rest, either with or without sleep (Tatti et al., 2020), while gamma ERS was still reduced. These findings suggest that beta and gamma changes represent different practice-induced mechanisms and functions in motor control processes. In the following sections, we will discuss the potential relationship between practice-related gamma ERS changes and executive functions, with a particular focus on attention and fatigue.
4.2. Changes in attentional processes and gamma ERS
In contrast with the present results that focused on gamma correlates of motor performance, most studies have shown an increase in gamma power during several working memory and learning tasks (Akimoto et al., 2014; Howard et al., 2003; Tallon-Baudry et al., 1999) and after prolonged training of perceptual processes (Popov et al., 2012; Shahin et al., 2008). Enhancement of gamma activity has also been found during adaptation to imposed visuomotor rotation over a frontal region during planning and execution of reaching movements (Perfetti et al., 2011). In that context, gamma activity also increased over the right parietal area, a region that is specifically active in visuo-motor adaptation (Ghilardi et al., 2000b; Huber et al., 2004). This right parietal increase occurred during movement planning in the initial adaptation phases of visuomotor transformation compared to baseline values and disappeared in the later phases of the adaptation (Perfetti et al., 2011). Therefore, these results suggest that gamma activity increases are usually present in the early stages of learning over areas that are specifically involved in the acquisition of a skill, while subsequent decreases may occur later during the maintenance or the retrieval of memory traces. A sequence learning study with recordings of intracranial field potentials from electrodes implanted within temporal and frontal cortical areas reinforces this conclusion. That study showed that power in the gamma frequency first increased with the encoding of sequences and then decayed with their retrieval, with a direct correlation between gamma decrease and sequence recall (Madhavan et al., 2014).
In the present study, we found a progressive decrement of gamma ERS during both movement planning and execution. Many factors could have contributed to this finding, including the characteristics of the implemented motor test (mov) and the preceding practice. For what concerns the mov characteristics, as this test involves simple arm reaching movements without any adaptation components, only a few trials are required to achieve expertise for young subjects. It is thus possible that the marginal learning involved in mov was not enough to trigger an evident increase of the amplitude of movement-relate gamma ERS. The fast-achieved proficiency in the mov test might have been a determining factor in the gamma ERS decrease, as also suggested by the positive relationship between gamma activity, task difficulty, and executive control in motor responses reported in recent studies (Isabella et al., 2015, 2021; Wiesman et al., 2021). Accordingly, when movements become highly predictable, the necessity of cognitive control processes and focused attention for proper performance might wane. On the other hand, attention and executive control may have diminished because of fatigue related to the extended visuo-motor adaptation (ROT) practice and a steady encoding and retrieval of visual sequences (VSEQ). While the two tasks differ in terms of motor demands, they share attention and executive control processes. As the gamma ERS similarly decreases after both learning tasks, it is plausible that there were no specific effects related to the type of preceding practice. Indeed, despite different cognitive requirements, the two tasks shared general mechanisms related to learning as well as to the processing of visual information. Thus, in both tasks, a progressive decline in attentional capacity and increased perceived fatigue may explain the observed effects. Indeed, the decrease of movement-related gamma ERS during planning was correlated, at least partially, with the changes in subjective fatigue scores both at the end of the morning and in the afternoon block. Accordingly, attention waning and mental fatigue have been associated with gamma power decrement, although the directionality and the causality of this association cannot be currently established (Fries et al., 2001; Gregoriou et al., 2009). Nevertheless, in the present study, we could not find any direct relationship between perceived fatigue and the subtle changes in movement extent specification that were likely due to the simplicity of the test.
Despite the partial correlations between the gamma ERS decrease during planning with the changes in subjective fatigue scores, fatigue might have been only one of the contributing factors to gamma ERS decrement after the morning training. Indeed, the amplitude of movement-related gamma ERS was still decreasing after an interval of 90 min spent either napping or in quiet wake resting. Based upon these considerations, it is possible that decreased attention because of fast-achieved proficiency or attention waning due to mental fatigue may have contributed to the gamma ERS decrease. In other words, it is plausible that the decrement of movement-related gamma ERS in mov mostly reflects decreased energetic demands due to diminished use of attentional, working memory, and other resources for movement planning and execution.
Support for this conclusion comes from experimental work in animals that reported local reductions of gamma power in repeated stimulation trials (Boorman et al., 2015). Most importantly, such changes were coupled with decreased hemodynamic response in that same region, suggesting that gamma decrease likely reflects decreased oxygen consumption in response to reduced metabolic demands (Boorman et al., 2015). The association of gamma power with energetic metabolism is also supported by other studies showing that gamma oscillations are susceptible to metabolic and oxidative stress since a quick requisition for mitochondria is necessary to meet the energy requirements imposed by neuronal activities (Kann et al., 2011). Also, it has been shown that mitochondrial failure induces a lack of activity-dependent pyruvate dehydrogenase dephosphorylation together, with more than a 40 % decrease of gamma power (Bas-Orth et al., 2020).
4.3. Changes of attention and connectivity patterns in the gamma range during movement
The possible role played by changes of attention and related functions on gamma ERS decreases are also supported by our findings of decreased connectivity patterns and a parallel decrement of strength and local efficiency in gamma oscillatory activity, a frequency range involved in the binding of low-level inputs within sensory systems, in particular the visual ones (Cheyne and Ferrari, 2013). In previous work, we found that, compared to planning, movement execution in the baseline mov0 was associated with a subnetwork of increased connectivity in the gamma range that linked occipital, parietal, and frontal electrodes (Tatti et al., 2022). Here we further found that during movement execution gamma connectivity decreased in the subnetwork linking parieto-occipital and the frontal regions. We could explain these findings with the role of vision in motor control. Indeed, in normal subjects, vision provides essential information about target and limb position for successful movement planning. Vision is further used to assess the movement outcome in order to update the plan of successive movements. Indeed, a previous motor control study (Blohm et al., 2019) demonstrated a gamma burst at 75 Hz after cue onset in both primary and associative visual areas as well as in primary and premotor cortices. In addition, electrophysiological data obtained from macaques demonstrated that artificially induced gamma synchronization between the primary (V1) and higher visual cortices (V4) enhanced the transmission of sensory information to motor regions, resulting in a shortened reaction time (Rohenkohl et al., 2018), thus supporting the “communication through coherence” hypothesis (Fries, 2015).
Besides its participation in these feedforward mechanisms, visual signal can be employed to monitor and correct the movement during its execution, a strategy mostly employed in the first exposures to a novel motor task. However, with practice, normal subjects improve movement planning, thus diminishing or turning off the need for online visual feedback (Ghilardi et al., 2000a, 2000b). These visually-based mechanisms require the cooperation of occipital, parietal, and frontal areas, as demonstrated by the occurrence of functional links during imaging studies (Blohm et al., 2019; Ghilardi et al., 2000a, 2000b). In particular, frontal regions are active during tasks demanding attention and executive functions and their activation diminishes with training and learning. Therefore, the decreased gamma connectivity we found during movement execution in subnetwork linking parieto-occipital and frontal regions is likely related to the decreased visual processing during the movement, and thus to the automatization of motor performance.
We also found brain network topological changes during movement execution compared to the premovement phase. The average local efficiency is a measure of network segregation that quantifies the ability of fault tolerance of the network assessing the information exchange of the subnetwork consisting of itself and its neighbors. Our findings are in line with the hypothesis that sensorimotor tasks can be managed by a highly segregated brain organization (Dehaene et al., 1998). Therefore, the greater values of average local efficiency and strength found in the movement execution than during planning suggest that the functional brain networks of healthy subjects are topologically organized in a way that maximizes the segregation of neural processing while performing a planar reaching movement test. While network segregation levels are associated with successful motion execution and faster processing (Wang et al., 2021), more intricate and mentally demanding tasks require the brain to shift from a segregated to a more integrated and interconnected network organization (Finc et al., 2020). In this regard, the reduced strength and local efficiency in mov3 compared to mov0 during execution together with the correlation between the changes in network measures and the subjective fatigue scores from mov3 to mov4 during the execution window may reflect an aberrant brain network reorganization due to decreased attention working memory, and other resources for movement planning and execution.
5. Conclusions
While confirming the prokinetic role of movement-related gamma ERS and its maintenance with practice, the present results showed that, with practice, movement-related gamma ERS, as well as the connectivity profile, strength, and local efficiency measures in the gamma range decrease with practice. These changes are specific to the motor practice, as they occur without major changes in the average gamma power. It is likely that they reflect decreased metabolic demands due to diminished attention and other executive resources needed for proper motor function, thus signaling a switch from controlled motor performance toward automatization. In addition, attentional and executive disengagement during motor performance may be related to a transient state of mental fatigue. Therefore, these findings may have important implications for defining the neural dynamics and the role of visual processing in motor control and learning in patients with sensorimotor deficits. For example, such understanding is crucial to devise rehabilitation strategies to facilitate motor performance in conditions where increased dependence on real-time visual cues could hinder movement (Ghilardi et al., 2000a, 2000b) as it can happen during freezing of gait in Parkinson’s disease (Vanegas et al., 2019).
Supplementary Material
Acknowledgments
This work was supported by NIH P01 NS083514 (MFG), DOD W81XWH-19–1–0810 (AQ, MFG), and Current Research Funds 2022, Ministry of Health, Italy (AQ). Kinematic data were collected with custom-designed software, MotorTaskManager, produced by ETT s.r.l.. We thank Dr. Aaron Bruce Nelson and Dr. Serena Ricci for data collection; Martina Bossini Baroggi, Giorgia Marchesi, and Giulia Aurora Albanese for the development of the kinematic analysis program (Marky).
Footnotes
Declaration of Competing Interest
The authors declare that the study was conducted in the absence of any commercial or financial relationships that could be construed as a potential conflict of interest.
CRediT authorship contribution statement
Elisa Tatti: Conceptualization, Methodology, Software, Validation, Investigation, Formal analysis, Visualization, Writing – original draft, Writing – review & editing, Project administration, Supervision. Alberto Cacciola: Methodology, Software, Validation, Formal analysis, Visualization, Writing – original draft, Writing – review & editing. Federico Carrara: Methodology, Formal analysis. Adalgisa Luciani: Visualization, Writing – original draft, Writing – review & editing. Angelo Quartarone: Conceptualization, Validation, Writing – review & editing, Project administration, Supervision, Funding acquisition. M.Felice Ghilardi: Conceptualization, Methodology, Validation, Investigation, Formal analysis, Visualization, Writing – original draft, Writing – review & editing, Project administration, Supervision, Funding acquisition.
Supplementary materials
Supplementary material associated with this article can be found, in the online version, at doi:10.1016/j.neuroimage.2023.120444.
Data availability
The data used to support the findings of this study are available upon reasonable request. Interested researchers can contact Dr. Elisa Tatti (etatti@ccny.cuny.edu) or Dr. M. Felice Ghilardi (lice.mg79@gmail.com) to request access to the data. Data availability is subject to the restrictions imposed by the institutional review board on the use of human subjects’ data.
References
- Akimoto Y, Nozawa T, Kanno A, Ihara M, Goto T, Ogawa T, Kambara T, Sugiura M, Okumura E, Kawashima R, 2014. High-gamma activity in an attention network predicts individual differences in elderly adults’ behavioral performance. Neuroimage 100, 290–300. 10.1016/j.neuroimage.2014.06.037. [DOI] [PubMed] [Google Scholar]
- Ball T, Demandt E, Mutschler I, Neitzel E, Mehring C, Vogt K, Aertsen A, Schulze-Bonhage A, 2008. Movement related activity in the high gamma range of the human EEG. Neuroimage 41, 302–310. 10.1016/j.neuroimage.2008.02.032. [DOI] [PubMed] [Google Scholar]
- Bas-Orth C, Schneider J, Lewen A, McQueen J, Hasenpusch-Theil K, Theil T, Hardingham GE, Bading H, Kann O, 2020. The mitochondrial calcium uniporter is crucial for the generation of fast cortical network rhythms. J. Cereb. Blood Flow Metab. 40, 2225–2239. 10.1177/0271678X19887777. [DOI] [PMC free article] [PubMed] [Google Scholar]
- Berry RB, Brooks R, Gamaldo C, Harding SM, Lloyd RM, Quan SF, Troester MT, Vaughn BV, 2017. AASM scoring manual updates for 2017 (Version 2.4). J. Clin. Sleep Med. 13, 665–666. 10.5664/jcsm.6576. [DOI] [PMC free article] [PubMed] [Google Scholar]
- Blohm G, Alikhanian H, Gaetz W, Goltz HC, DeSouza JFX, Cheyne DO, Crawford JD, 2019. Neuromagnetic signatures of the spatiotemporal transformation for manual pointing. Neuroimage 197, 306–319. 10.1016/j.neuroimage.2019.04.074. [DOI] [PubMed] [Google Scholar]
- Boorman L, Harris S, Bruyns-Haylett M, Kennerley A, Zheng Y, Martin C, Jones M, Redgrave P, Berwick J, 2015. Long-latency reductions in gamma power predict hemodynamic changes that underlie the negative BOLD signal. J. Neurosci. 35, 4641–4656. 10.1523/JNEUROSCI.2339-14.2015. [DOI] [PMC free article] [PubMed] [Google Scholar]
- Brücke C, Huebl J, Schönecker T, Neumann WJ, Yarrow K, Kupsch A, Blahak C, Lütjens G, Brown P, Krauss JK, Schneider GH, Kühn AA, 2012. Scaling of movement is related to pallidal γ oscillations in patients with dystonia. J. Neurosci. 32, 1008–1019. 10.1523/JNEUROSCI.3860-11.2012. [DOI] [PMC free article] [PubMed] [Google Scholar]
- Cacciola A, Naro A, Milardi D, Bramanti A, Malatacca L, Spitaleri M, Leo A, Muscoloni A, Cannistraci C, Bramanti P, Calabro R, Anastasi G, 2019. ` Functional brain network topology discriminates between patients with minimally conscious state and unresponsive wakefulness syndrome. J. Clin. Med. 8, 306. 10.3390/jcm8030306. [DOI] [PMC free article] [PubMed] [Google Scholar]
- Cheyne D, Bells S, Ferrari P, Gaetz W, Bostan AC, 2008. Self-paced movements induce high-frequency gamma oscillations in primary motor cortex. Neuroimage 42, 332–342. 10.1016/j.neuroimage.2008.04.178. [DOI] [PubMed] [Google Scholar]
- Cheyne D, Ferrari P, 2013. MEG studies of motor cortex gamma oscillations: evidence for a gamma “fingerprint” in the brain? Front. Hum. Neurosci. 7, 575. 10.3389/fnhum.2013.00575. [DOI] [PMC free article] [PubMed] [Google Scholar]
- Cremoux S, Tallet J, Berton E, Dal Maso F, Amarantini D, 2013. Does the force level modulate the cortical activity during isometric contractions after a cervical spinal cord injury? Clin. Neurophysiol. 124, 1005–1012. 10.1016/j.clinph.2012.11.007. [DOI] [PubMed] [Google Scholar]
- Crone NE, Miglioretti DL, Gordon B, Sieracki JM, Wilson MT, Uematsu S, Lesser RP, 1998. Functional mapping of human sensorimotor cortex with electrocorticographic spectral analysis. I. Alpha and beta event-related desynchronization. Brain 121 (Pt 12), 2271–2299. 10.1093/brain/121.12.2271. [DOI] [PubMed] [Google Scholar]
- Dehaene S, Kerszberg M, Changeux JP, 1998. A neuronal model of a global workspace in effortful cognitive tasks. Proc. Natl. Acad. Sci. U.S.A. 95, 14529–14534. 10.1073/pnas.95.24.14529. [DOI] [PMC free article] [PubMed] [Google Scholar]
- Delorme A, Makeig S, 2004. EEGLAB: an open source toolbox for analysis of single-trial EEG dynamics including independent component analysis. J. Neurosci. Methods 134, 9–21. [DOI] [PubMed] [Google Scholar]
- Finc K, Bonna K, He X, Lydon-Staley DM, Kühn S, Duch W, Bassett DS, 2020. Dynamic reconfiguration of functional brain networks during working memory training. Nat. Commun. 11, 2435. 10.1038/s41467-020-15631-z. [DOI] [PMC free article] [PubMed] [Google Scholar]
- Fries P, 2015. Rhythms for cognition: communication through coherence. Neuron 88, 220–235. 10.1016/j.neuron.2015.09.034. [DOI] [PMC free article] [PubMed] [Google Scholar]
- Fries P, Reynolds JH, Rorie AE, Desimone R, 2001. Modulation of oscillatory neuronal synchronization by selective visual attention. Science 291, 1560–1563. 10.1126/science.1055465. [DOI] [PubMed] [Google Scholar]
- Ghilardi MF, Alberoni M, Rossi M, Franceschi M, Mariani C, Fazio F, 2000a. Visual feedback has differential effects on reaching movements in Parkinson’s and Alzheimer’s disease. Brain Res. 876, 112–123. 10.1016/s0006-8993(00)02635-4. [DOI] [PubMed] [Google Scholar]
- Ghilardi MF, Eidelberg D, Silvestri G, Ghez C, 2003. The differential effect of PD and normal aging on early explicit sequence learning. Neurology 60, 1313–1319. [DOI] [PubMed] [Google Scholar]
- Ghilardi MF, Ghez C, Dhawan V, Moeller J, Mentis M, Nakamura T, Antonini A, Eidelberg D, 2000b. Patterns of regional brain activation associated with different forms of motor learning. Brain Res. 871, 127–145. 10.1016/S0006-8993(00)02365-9. [DOI] [PubMed] [Google Scholar]
- Ghilardi MF, Moisello C, Silvestri G, Ghez C, Krakauer JW, 2009. Learning of a sequential motor skill comprises explicit and implicit components that consolidate differently. J. Neurophysiol. 101, 2218–2229. 10.1152/jn.01138.2007. [DOI] [PMC free article] [PubMed] [Google Scholar]
- Ghilardi MF, Tatti E, Quartarone A, 2021. Beta power and movement-related beta modulation as hallmarks of energy for plasticity induction: implications for Parkinson’s disease. Parkinsonism Relat. Disord. 88, 136–139. 10.1016/j.parkreldis.2021.05.018. [DOI] [PubMed] [Google Scholar]
- Gregoriou GG, Gotts SJ, Zhou H, Desimone R, 2009. High-frequency, long-range coupling between prefrontal and visual cortex during attention. Science 324, 1207–1210. 10.1126/science.1171402. [DOI] [PMC free article] [PubMed] [Google Scholar]
- Gunduz A, Brunner P, Sharma M, Leuthardt EC, Ritaccio AL, Pesaran B, Schalk G, 2016. Differential roles of high gamma and local motor potentials for movement preparation and execution. Brain-Comput. Interfaces 3, 88–102. 10.1080/2326263X.2016.1179087. [DOI] [Google Scholar]
- Gwin JT, Ferris DP, 2012. Beta- and gamma-range human lower limb corticomuscular coherence. Front. Hum. Neurosci. 6, 258. 10.3389/fnhum.2012.00258. [DOI] [PMC free article] [PubMed] [Google Scholar]
- Gwin JT, Gramann K, Makeig S, Ferris DP, 2011. Electrocortical activity is coupled to gait cycle phase during treadmill walking. Neuroimage 54, 1289–1296. 10.1016/j.neuroimage.2010.08.066. [DOI] [PubMed] [Google Scholar]
- Howard MW, Rizzuto DS, Caplan JB, Madsen JR, Lisman J, Aschenbrenner-Scheibe R, Schulze-Bonhage A, Kahana MJ, 2003. Gamma oscillations correlate with working memory load in humans. Cereb. Cortex 13, 1369–1374. 10.1093/cercor/bhg084. [DOI] [PubMed] [Google Scholar]
- Huber R, Ghilardi MF, Massimini M, Tononi G, 2004. Local sleep and learning. Nature 430, 78–81. 10.1038/nature02663. [DOI] [PubMed] [Google Scholar]
- Isabella S, Ferrari P, Jobst C, Cheyne JA, Cheyne D, 2015. Complementary roles of cortical oscillations in automatic and controlled processing during rapid serial tasks. Neuroimage 118, 268–281. 10.1016/j.neuroimage.2015.05.081. [DOI] [PubMed] [Google Scholar]
- Isabella SL, Cheyne JA, Cheyne D, 2021. Inhibitory control in the absence of awareness: interactions between frontal and motor cortex oscillations mediate implicitly learned responses. Front. Hum. Neurosci. 15, 786035 10.3389/fnhum.2021.786035. [DOI] [PMC free article] [PubMed] [Google Scholar]
- Joundi RA, Jenkinson N, Brittain JS, Aziz TZ, Brown P, 2012. Driving oscillatory activity in the human cortex enhances motor performance. Curr. Biol. 22, 403–407. 10.1016/j.cub.2012.01.024. [DOI] [PMC free article] [PubMed] [Google Scholar]
- Kann O, Huchzermeyer C, Kovacs R, Wirtz S, Schuelke M, 2011. Gamma ´ oscillations in the hippocampus require high complex I gene expression and strong functional performance of mitochondria. Brain 134, 345–358. 10.1093/brain/awq333. [DOI] [PubMed] [Google Scholar]
- Klinzing JG, Niethard N, Born J, 2019. Mechanisms of systems memory consolidation during sleep. Nat. Neurosci. 22, 1598–1610. 10.1038/s41593-019-0467-3. [DOI] [PubMed] [Google Scholar]
- Latora V, Marchiori M, 2001. Efficient behavior of small-world networks. Phys. Rev. Lett. 87, 198701 10.1103/PhysRevLett.87.198701. [DOI] [PubMed] [Google Scholar]
- Leunissen I, Van Steenkiste M, Heise KF, Monteiro TS, Dunovan K, Mantini D, Coxon JP, Swinnen SP, 2022. Effects of beta-band and gamma-band rhythmic stimulation on motor inhibition. iScience 25, 104338. 10.1016/j.isci.2022.104338. [DOI] [PMC free article] [PubMed] [Google Scholar]
- Lofredi R, Neumann WJ, Bock A, Horn A, Huebl J, Siegert S, Schneider GH, Krauss JK, Kühn AA, 2018. Dopamine-dependent scaling of subthalamic gamma bursts with movement velocity in patients with Parkinson’s disease. eLife 7, e31895. 10.7554/eLife.31895. [DOI] [PMC free article] [PubMed] [Google Scholar]
- Madhavan R, Joel SE, Mullick R, Cogsil T, Niogi SN, Tsiouris AJ, Mukherjee P, Masdeu JC, Marinelli L, Shetty T, 2019. Longitudinal resting state functional connectivity predicts clinical outcome in mild traumatic brain injury. J. Neurotrauma 36, 650–660. 10.1089/neu.2018.5739. [DOI] [PubMed] [Google Scholar]
- Madhavan R, Millman D, Tang H, Crone NE, Lenz FA, Tierney TS, Madsen JR, Kreiman G, Anderson WS, 2014. Decrease in gamma-band activity tracks sequence learning. Front. Syst. Neurosci. 8, 222. 10.3389/fnsys.2014.00222. [DOI] [PMC free article] [PubMed] [Google Scholar]
- Marinelli L, Trompetto C, Canneva S, Mori L, Nobili F, Fattapposta F, Currà A, Abbruzzese G, Ghilardi MF, 2017. Learning “how to learn”: super declarative motor learning is impaired in Parkinson’s disease. Neural Plast. 2017, 3162087 10.1155/2017/3162087. [DOI] [PMC free article] [PubMed] [Google Scholar]
- Maris E, Oostenveld R, 2007. Nonparametric statistical testing of EEG- and MEG-data. J. Neurosci. Methods 164, 177–190. 10.1016/j.jneumeth.2007.03.024. [DOI] [PubMed] [Google Scholar]
- Miller KJ, Leuthardt EC, Schalk G, Rao RPN, Anderson NR, Moran DW, Miller JW, Ojemann JG, 2007. Spectral changes in cortical surface potentials during motor movement. J. Neurosci. 27, 2424–2432. 10.1523/JNEUROSCI.3886-06.2007. [DOI] [PMC free article] [PubMed] [Google Scholar]
- Moisello C, Meziane HB, Kelly S, Perfetti B, Kvint S, Voutsinas N, Blanco D, Quartarone A, Tononi G, Ghilardi MF, 2013. Neural activations during visual sequence learning leave a trace in post-training spontaneous EEG. PLoS One 8, e65882. 10.1371/journal.pone.0065882. [DOI] [PMC free article] [PubMed] [Google Scholar]
- Muthukumaraswamy SD, 2010. Functional properties of human primary motor cortex gamma oscillations. J. Neurophysiol. 104, 2873–2885. 10.1152/jn.00607.2010. [DOI] [PubMed] [Google Scholar]
- Muthukumaraswamy SD, Johnson BW, 2004. Primary motor cortex activation during action observation revealed by wavelet analysis of the EEG. Clin. Neurophysiol. 115, 1760–1766. 10.1016/j.clinph.2004.03.004. [DOI] [PubMed] [Google Scholar]
- Nelson AB, Ricci S, Tatti E, Panday P, Girau E, Lin J, Thomson BO, Chen H, Marshall W, Tononi G, Cirelli C, Ghilardi MF, 2021. Neural fatigue due to intensive learning is reversed by a nap but not by quiet waking. Sleep 44. 10.1093/sleep/zsaa143 zsaa143. [DOI] [PMC free article] [PubMed] [Google Scholar]
- Neuper C, Wörtz M, Pfurtscheller G, 2006. ERD/ERS patterns reflecting sensorimotor activation and deactivation. Prog. Brain Res. 159, 211–222. 10.1016/S0079-6123(06)59014-4. [DOI] [PubMed] [Google Scholar]
- Nolte G, Holroyd T, Carver F, Coppola R, Hallett M, 2004. Localizing brain interactions from rhythmic EEG/MEG data. Conf. Proc. IEEE Eng. Med. Biol. Soc. 2004, 998–1001. 10.1109/IEMBS.2004.1403330. [DOI] [PubMed] [Google Scholar]
- Nowak M, Zich C, Stagg CJ, 2018. Motor cortical gamma oscillations: what have we learnt and where are we headed? Curr. Behav. Neurosci. Rep. 5, 136–142. 10.1007/s40473-018-0151-z. [DOI] [PMC free article] [PubMed] [Google Scholar]
- Oostenveld R, Fries P, Maris E, Schoffelen JM, 2011. FieldTrip: open source software for advanced analysis of MEG, EEG, and invasive electrophysiological data. Comput. Intell. Neurosci. 2011, 156869 10.1155/2011/156869. [DOI] [PMC free article] [PubMed] [Google Scholar]
- Papo D, Buldú JM, Boccaletti S, Bullmore ET, 2014. Complex network theory and the brain. Philos. Trans. R. Soc. Lond. B Biol. Sci. 369, 20130520 10.1098/rstb.2013.0520. [DOI] [PMC free article] [PubMed] [Google Scholar]
- Perfetti B, Moisello C, Landsness EC, Kvint S, Lanzafame S, Onofrj M, Di Rocco A, Tononi G, Ghilardi MF, 2011. Modulation of gamma and theta spectral amplitude and phase synchronization is associated with the development of visuo-motor learning. J. Neurosci. 31, 14810–14819. 10.1523/JNEUROSCI.1319-11.2011. [DOI] [PMC free article] [PubMed] [Google Scholar]
- Pfurtscheller G, 1981. Central beta rhythm during sensorimotor activities in man. Electroencephalogr. Clin. Neurophysiol. 51, 253–264. 10.1016/0013-4694(81)90139-5. [DOI] [PubMed] [Google Scholar]
- Pfurtscheller G, Graimann B, Huggins JE, Levine SP, Schuh LA, 2003. Spatiotemporal patterns of beta desynchronization and gamma synchronization in corticographic data during self-paced movement. Clin. Neurophysiol. 114, 1226–1236. 10.1016/s1388-2457(03)00067-1. [DOI] [PubMed] [Google Scholar]
- Pfurtscheller G, Lopes da Silva FH, 1999. Event-related EEG/MEG synchronization and desynchronization: basic principles. Clin. Neurophysiol. 110, 1842–1857. 10.1016/S1388-2457(99)00141-8. [DOI] [PubMed] [Google Scholar]
- Pfurtscheller G, Neuper C, 1992. Simultaneous EEG 10Hz desynchronization and 40Hz synchronization during finger movements. Neuroreport 3, 1057–1060. 10.1097/00001756-199212000-00006. [DOI] [PubMed] [Google Scholar]
- Popov T, Steffen A, Weisz N, Miller GA, Rockstroh B, 2012. Cross-frequency dynamics of neuromagnetic oscillatory activity: two mechanisms of emotion regulation. Psychophysiology 49, 1545–1557. 10.1111/j.1469-8986.2012.01484.x. [DOI] [PubMed] [Google Scholar]
- Ricci S, Tatti E, Mehraram R, Panday P, Ghilardi MF, 2019. Beta band frequency differences between motor and frontal cortices in reaching movements. IEEE Int. Conf. Rehabil. Robot. 2019, 1254–1259. 10.1109/ICORR.2019.8779373. [DOI] [PMC free article] [PubMed] [Google Scholar]
- Rohenkohl G, Bosman CA, Fries P, 2018. Gamma synchronization between V1 and V4 improves behavioral performance. Neuron 100, 953–963. 10.1016/j.neuron.2018.09.019. e3. [DOI] [PMC free article] [PubMed] [Google Scholar]
- Rubinov M, Sporns O, 2010. Complex network measures of brain connectivity: uses and interpretations. Neuroimage 52, 1059–1069. 10.1016/j.neuroimage.2009.10.003. [DOI] [PubMed] [Google Scholar]
- Salmelin R, Forss N, Knuutila J, Hari R, 1995. Bilateral activation of the human somatomotor cortex by distal hand movements. Electroencephalogr. Clin. Neurophysiol. 95, 444–452. 10.1016/0013-4694(95)00193-x. [DOI] [PubMed] [Google Scholar]
- Seeber M, Scherer R, Müller-Putz GR, 2016. EEG Oscillations are modulated in different behavior-related networks during rhythmic finger movements. J. Neurosci. 36, 11671–11681. 10.1523/JNEUROSCI.1739-16.2016. [DOI] [PMC free article] [PubMed] [Google Scholar]
- Seeber M, Scherer R, Wagner J, Solis-Escalante T, Müller-Putz GR, 2015. High and low gamma EEG oscillations in central sensorimotor areas are conversely modulated during the human gait cycle. Neuroimage 112, 318–326. 10.1016/j.neuroimage.2015.03.045. [DOI] [PubMed] [Google Scholar]
- Shahin AJ, Roberts LE, Chau W, Trainor LJ, Miller LM, 2008. Music training leads to the development of timbre-specific gamma band activity. Neuroimage 41, 113–122. 10.1016/j.neuroimage.2008.01.067. [DOI] [PMC free article] [PubMed] [Google Scholar]
- Stam CJ, Nolte G, Daffertshofer A, 2007. Phase lag index: assessment of functional connectivity from multi channel EEG and MEG with diminished bias from common sources. Hum. Brain Mapp. 28, 1178–1193. 10.1002/hbm.20346. [DOI] [PMC free article] [PubMed] [Google Scholar]
- Stancák A, Pfurtscheller G, 1995. Desynchronization and recovery of beta rhythms during brisk and slow self-paced finger movements in man. Neurosci. Lett. 196, 21–24. 10.1016/0304-3940(95)11827-j. [DOI] [PubMed] [Google Scholar]
- Steinemann NA, Moisello C, Ghilardi MF, Kelly SP, 2016. Tracking neural correlates of successful learning over repeated sequence observations. Neuroimage 137, 152–164. 10.1016/j.neuroimage.2016.05.001. [DOI] [PMC free article] [PubMed] [Google Scholar]
- Tallon-Baudry C, Kreiter A, Bertrand O, 1999. Sustained and transient oscillatory responses in the gamma and beta bands in a visual short-term memory task in humans. Vis. Neurosci. 16, 449–459. 10.1017/s0952523899163065. [DOI] [PubMed] [Google Scholar]
- Tatti E, Ferraioli F, Cacciola A, Chan C, Quartarone A, Ghilardi MF, 2022. Modulation of gamma spectral amplitude and connectivity during reaching predicts peak velocity and movement duration. Front. Neurosci. 16, 836703 10.3389/fnins.2022.836703. [DOI] [PMC free article] [PubMed] [Google Scholar]
- Tatti E, Ferraioli F, Peter J, Alalade T, Nelson AB, Ricci S, Quartarone A, Ghilardi MF, 2021a. Frontal increase of beta modulation during the practice of a motor task is enhanced by visuomotor learning. Sci. Rep. 11, 17441. 10.1038/s41598-021-97004-0. [DOI] [PMC free article] [PubMed] [Google Scholar]
- Tatti E, Ricci S, Mehraram R, Lin N, George S, Nelson AB, Ghilardi MF, 2019. Beta modulation depth is not linked to movement features. Front. Behav. Neurosci. 13, 49. 10.3389/fnbeh.2019.00049. [DOI] [PMC free article] [PubMed] [Google Scholar]
- Tatti E, Ricci S, Nelson AB, Mathew D, Chen H, Quartarone A, Cirelli C, Tononi G, Ghilardi MF, 2020a. Prior practice affects movement-related beta modulation and quiet wake restores it to baseline. Front. Syst. Neurosci. 14, 61. 10.3389/fnsys.2020.00061. [DOI] [PMC free article] [PubMed] [Google Scholar]
- Tononi G, Cirelli C, 2014. Sleep and the price of plasticity: from synaptic and cellular homeostasis to memory consolidation and integration. Neuron 81, 12–34. 10.1016/j.neuron.2013.12.025. [DOI] [PMC free article] [PubMed] [Google Scholar]
- Ulloa JL, 2022. The Control of Movements via Motor Gamma Oscillations. Front. Hum. Neurosci. 15 10.3389/fnhum.2021.787157. [DOI] [PMC free article] [PubMed] [Google Scholar]
- Vanegas MI, Blangero A, Galvin JE, Di Rocco A, Quartarone A, Ghilardi MF, Kelly SP, 2019. Altered dynamics of visual contextual interactions in Parkinson’s disease. NPJ Parkinsons Dis. 5, 13. 10.1038/s41531-019-0085-5. [DOI] [PMC free article] [PubMed] [Google Scholar]
- Vinck M, Oostenveld R, van Wingerden M, Battaglia F, Pennartz CMA, 2011. An improved index of phase-synchronization for electrophysiological data in the presence of volume-conduction, noise and sample-size bias. NeuroImage 55, 1548–1565. 10.1016/j.neuroimage.2011.01.055. [DOI] [PubMed] [Google Scholar]
- Wang J, Fang Y, Wang X, Yang H, Yu X, Wang H, 2017a. Enhanced Gamma activity and cross-frequency interaction of resting-state electroencephalographic oscillations in patients with Alzheimer’s. Front. Aging Neurosci. 9, 243. 10.3389/fnagi.2017.00243. [DOI] [PMC free article] [PubMed] [Google Scholar]
- Wang R, Liu M, Cheng X, Wu Y, Hildebrandt A, Zhou C, 2021. Segregation, integration, and balance of large-scale resting brain networks configure different cognitive abilities. Proc. Natl. Acad. Sci. U.S.A. 118, e2022288118 10.1073/pnas.2022288118. [DOI] [PMC free article] [PubMed] [Google Scholar]
- Wang Y, Ghumare E, Vandenberghe R, Dupont P, 2017b. Comparison of different generalizations of clustering coefficient and local efficiency for weighted undirected graphs. Neural Comput. 29, 313–331. 10.1162/NECO_a_00914. [DOI] [PubMed] [Google Scholar]
- Wiesman AI, Christopher-Hayes NJ, Eastman JA, Heinrichs-Graham E, Wilson TW, 2021. Response certainty during bimanual movements reduces gamma oscillations in primary motor cortex. Neuroimage 224, 117448. 10.1016/j.neuroimage.2020.117448. [DOI] [PMC free article] [PubMed] [Google Scholar]
- Zalesky A, Fornito A, Bullmore ET, 2010. Network-based statistic: identifying differences in brain networks. Neuroimage 53, 1197–1207. 10.1016/j.neuroimage.2010.06.041. [DOI] [PubMed] [Google Scholar]
Associated Data
This section collects any data citations, data availability statements, or supplementary materials included in this article.
Supplementary Materials
Data Availability Statement
The data used to support the findings of this study are available upon reasonable request. Interested researchers can contact Dr. Elisa Tatti (etatti@ccny.cuny.edu) or Dr. M. Felice Ghilardi (lice.mg79@gmail.com) to request access to the data. Data availability is subject to the restrictions imposed by the institutional review board on the use of human subjects’ data.