

Abstract
Fluid shear stress is an important mediator of vascular permeability, yet the molecular mechanisms underlying the effect of shear on the blood-brain barrier (BBB) have yet to be clarified in cerebral vasculature despite its importance for brain homeostasis. The goal of this study is to probe components of shear mechanotransduction within the BBB to gain a better understanding of pathologies associated with changes in cerebral perfusion including ischemic stroke. Interrogating the effects of shear stress in vivo is complicated by the complexity of factors in the brain parenchyma and the difficulty associated with modulating blood flow regimes. The in vitro model used in this study is compatible with real-time measurement of barrier function using a transendothelial electrical resistance as well as immunocytochemistry and dextran permeability assays. These experiments reveal that there is a threshold level of shear stress required for barrier formation and that the composition of the extracellular matrix, specifically the presence of high molecular weight hyaluronan, dictates the flow response. Gene editing to modulate the expression of CD44, a mechanosensitive receptor for hyaluronan, demonstrates that the receptor is required for the endothelial response to shear stress. Manipulation of small GTPase activity reveals CD44 activates Rac1 while inhibiting RhoA activation. Additionally, adducin-γ localizes to tight junctions in response to shear stress and RhoA inhibition and is required to maintain the barrier. This study identifies specific components of the mechanosensing complex associated with the BBB response to fluid shear stress and, therefore, illuminates potential targets for barrier manipulation in vivo.
Keywords: biophysics, blood-brain barrier, hyaluronic acid
1 |. INTRODUCTION
Recent studies have established that the integrity of the blood-brain barrier (BBB) is regulated by the mechanical stress exerted by blood flow; both fluid shear stress1 and cyclic strain2 decrease the permeability of in vitro models of the cerebral vasculature. These findings mirror the results in systemic vasculature, yet blood vessels in the central nervous system (CNS) are substantially different in both structure and function compared to vasculature found elsewhere in the body. The primary difference is the formation of endothelial tight junctions: complexes of claudins, and occludin stabilized by scaffolding proteins including zonula occludens-1 that give rise to the BBB.3 Moreover, the extracellular matrix (ECM) of the CNS is also drastically different than other organ systems.4 The CNS ECM features high concentrations of proteoglycans and glycosaminoglycans, specifically high molecular weight hyaluronan (HMW-HA),5 and a lack of fibrillar collagens that are common elsewhere in the body. The differences in structure and function of vasculature and the surrounding ECM in the CNS suggest the possibility of unique mechanotransduction mechanisms in the BBB.
Although several mechanosensing mechanisms of fluid shear stress have previously been identified in endothelial cells in systemic vasculature6–10 including pathways involving the glycocalyx,11 the PECAM-VEGFR2-VE-cadherin complex,12 and Notch signaling,13 mechanotransduction within tight junction-forming endothelial cells remain unclear. However, there is substantial evidence that the integrity of the barrier is mediated by the composition of the surrounding ECM. Previous studies have shown that elevated concentrations of low molecular weight hyaluronic acid, <20 monosaccharide units in length (oHA)14 disrupt barrier function15 and promote cytoskeleton remodeling16 and angiogenic sprouting.17,18 Conversely, HMW-HA (>1 MDa)14 has been shown to be anti-angiogenic18 and anti-inflammatory19 and promote vascular barrier integrity.20 These processes are likely mediated in part by HA receptor CD44, which regulates the activity of small GTPases RhoA and Rac1.16,20,21 Previous studies have demonstrated that increased RhoA activity leads to disassembly of the complexes within cell-cell junctions and subsequent barrier disruption.8,22,23 Another small GTPase, Rac1, has been associated with stabilization of the BBB,24,25 and recent studies have also identified Rac1 activation as a downstream response to fluid shear stress in systemic vasculature.13 The connection between hyaluronan, small GTPase signaling, and barrier integrity insinuates a potential role of CD44 as a mechanosensor in the BBB.
However, studying BBB mechanotransduction in animal models is complicated by multiple time and spatial-varying factors present in vivo. Therefore, the results described here use a previously described 3D BBB.2 Despite several differences compared to in vivo vasculature, including the lack of a tortuous and branched morphology, absence of immune cells including microglia, and use of culture medium for perfusion instead of blood, the in vitro model provides a controlled setting to interrogate the molecular mechanisms underlying the response to shear stress. Moreover, cells can be genetically or transcriptionally altered prior to incorporation into the device to determine the effects of specific components of the signaling pathway. The device is compatible with dextran-FITC permeability assays as well as immunocytochemistry. A (TEER) device has also been developed for this microfluidic system, allowing non-invasive measurements of barrier integrity. Taken together, the device provides a robust platform to study BBB mechanotransduction.
2 |. METHODS
2.1 |. Microfabrication
Polydimethylsiloxane (PDMS) microfluidic devices were manufactured as described previously.2 Briefly, positive master molds of the devices manufactured using stereoithography (Protolabs) were used to cast negative and positive PDMS master molds which were then used to fabricate the microfluidic device for the 3D model. For monolayer flow experiments, 5-g of PDMS was added to a p100 culture dish and leveled prior to curing. The hydrogel reservoir was etched with 5 M sulfuric acid for 90 min, thoroughly washed with deionized water, and subsequently coated with 20 μg/ml collagen for 60 min. For monolayer plates, a 40-mm glass coverslip was used to constrain the fluids on the dish. All steps were performed at room temperature. Devices were sterilized under shortwave length ultraviolet light prior to cell seeding.
2.2 |. Cell culture
All cell experiments were performed with p21-24 hCMEC/D3 (gifted from Dr. Robert Nagele’s lab at the Rowan School of Osteopathic Medicine, P21-P24 represents passages since original immortalization in the laboratory of Prof. Pierre Olivier Couraud) 3–5 days after thawing and feeding with modified EGM-2 on 1% gelatin-coated tissue culture plates.26 Normal human astrocytes (NHA) (Lonza) were thawed at P5 and cultured for 5–10 days prior to cell seeding. Cell cultures were maintained at 37°C with 5% CO2 and 95% relative humidity.
2.3 |. In vitro BBB models
Three-dimensional models of the blood-brain barrier (3D BBB) were fabricated as described previously.2 Briefly, a hydrogel composed of 5 mg/ml type I collagen, 1 mg/ml HA (>1 MDa), 1 mg/ml Matrigel27 was used to fabricate the scaffold. When incorporated into the hydrogel, NHA were seeded at 1 million cells per ml. The gel was injected into the hydrogel reservoir of the device and 180-μm needles coated in 0.1% BSA for 1 h at room temperature or overnight at 4°C were inserted prior to polymerization of the hydrogel. The needles were removed after the gel was polymerized leaving two voids in the hydrogel in which hCMEC/D3 was injected into one channel at a density of 10 million per ml (15 μl per channel). Channels were incubated for 10 min to ensure cell attachment then injected with cells again and inverted for 10 min to coat the entire circumference. Following cell seeding, channels were either exposed to flow using a linear syringe pump (Kent Scientific) or incubated in static conditions in a 6-well plate. For GTPase activity assays, a larger diameter (1-mm) model was used28 due to insufficient protein yields from the smaller model. For both models, cell seeding is considered day 0 for experimental timelines. A 2D model was employed for pulldown and immunoprecipitation assays, the same hydrogel formulation was polymerized on the treated PDMS coated plates under a sterile 40-mm glass coverslip to create a uniform circular hydrogel. Following removal of the coverslip, hCMEC/D3 were seeded on the gel at a density of 4 k/cm2 and allowed to adhere for 30 min prior to the addition of EGM-2. Monolayers were incubated for 4 days in static culture to ensure confluency, then exposed to fluid shear stress. Fluid shear stress was applied using a 40-mm 1-degree cone plate on a rheometer (Waters) for 24-h on a Peltier plate set to 37°C. The media was supplemented with HEPES buffer to a final concentration of 10 mM to maintain pH and sterile deionized water was added to the plate during exposure of flow to counteract evaporative loss.29
2.4 |. Immunocytochemistry
Following exposure to experimental conditions, vessels were fixed in 4% paraformaldehyde (Alfa Aesar) for 30 min at room temperature. Following fixation, the top layer of the device was removed with a razor blade, and then the hydrogel was removed from the device and placed in 0.1% Triton X-100 to permeabilize the cell membrane. Gels were blocked in 5% normal donkey serum or 3% BSA for 30 min at room temperature followed by incubation overnight with primary antibodies for either HCAM (CD44) (Santa Cruz, sc-7297), glial fibrillary acidic protein (GFAP) (Santa Cruz, sc-6170), adducin-γ (add-γ) (Santa Cruz, sc-365177), zonula occludin-1 (ZO-1) (CST, #8193), VE-cadherin (CST, #2500), or claudin-5 (Santa Cruz, sc-374221). Following primary incubation, gels were washed three times with PBS for 5 min then incubated with the appropriate secondary antibody conjugated to Alexa 555 (CST, #4413), Alexa 488 (Santa Cruz, sc-362258), or Alexa-Fluor 647 (Thermo Scientific, #A-31573). Gels were counter-stained with DAPI to label nuclei and FITC-phalloidin for actin. All gels were imaged using a Nikon A-1 confocal scanning microscope.
2.5 |. Permeability testing
After exposure to experimental conditions, channels were transferred to the stage of an inverted epifluorescent microscope enclosed by an environmental chamber set to 37°C, 5% CO2, and 95% RH. The channels were perfused with 4-kDa dextran-FITC at a flow rate of 5 μl/min using a syringe pump for 10 min, while submerged within a culture medium to ensure cell viability. This flow rate was selected to assure fully developed flow throughout the channel and to maintain consistency with previous work.2 Images were taken at 30 s intervals for 10 min, and the diffusion coefficients were established using the following equation from the previous work.30
| (1) |
where is the permeability constant, is the rate of change of fluorescence intensity outside the vessels, is the radius, and is the intensity inside the vessel. Sample numbers of were used to determine the mean and standard deviation of diffusion coefficients for each condition.
2.6 |. Impedance spectroscopy and transendothelial electrical resistance (TEER) measurements
Impedance measurements were obtained by a stingray DS1M12 USB oscilloscope adapter (USB Instruments) that measured current across a reference resistor for a range of frequencies. Impendence, defined as , was measured at 15-Hz, where the capacitance of the electrodes dominates, and 15.6-kHz, where the resistance of the culture media dominates31; the difference between these two values yielded the TEER magnitude. These values were normalized to the impedance of an acellular hydrogel within the microfluidic device. Sample numbers of were used to determine the mean and standard deviation of TEER measurements for each condition.
2.7 |. CD44 knockdown
Commercially available CRISPR plasmids (Santa Cruz) were used to alter the expression of CD44 within the hCMEC/D3 cells prior to introduction into the 3D BBB model. To knockout CD44 in the cells, two plasmids encoding a D10A mutated Cas9 nuclease and a CD44-specific 20 nucleotide guide RNA were transfected into cells (Santa Cruz, sc-400209-NIC). The paired guide RNA sequences were offset by approximately 20 base pairs to facilitate Cas9-mediated double nicking of genomic DNA. For scrambled controls, a single plasmid encoding a non-specific guide RNA sequence was transfected into cells (Santa Cruz, sc-418922). Briefly, cells were plated in a six-well plate and grown to 60%–70% confluency. Cells were transfected with KO and control plasmids resuspended in nuclease-free water at 0.1 μg/μl. Both solutions were incubated for 5 min at room temperature. Following incubation, solutions were mixed, vortexed, and incubated for 20 min at room temperature. 300 μl of the plasmid complex in 3 ml of culture medium was then added to each well. Media was replaced after 48 h with complete EGM-2 containing puromycin to select the cells. The plasmids also contained a GFP cassette to assess transfection efficiency. Transfection efficiency was also verified by western blotting: cells were lysed in sample buffer containing DTT and LDS, boiled, and loaded onto a gel, and separated with electrophoresis. Proteins were transferred to a 0.45-μm PVDF membrane. Blots were quantified by measuring band intensity using ImageJ and normalizing relative expression to control conditions. Membranes were incubated with anti-CD44 (1:50) (Santa Cruz, sc-7297) or anti-Beta actin (1:400) (Santa Cruz, sc-47778) and visualized with HRP-conjugated secondary antibodies (1:4000) (CST, #7074). Sample numbers of at least were used to determine the mean and standard deviation of CD44 expression for each condition.
2.8 |. Adducin-γ knockdown
DsiRNA directed against adducin-γ (add-γ) (IDT)32 was used to knock down protein expression in hCMEC/D3 cells (sense: GGA GCA GGA CCA CAU CAU AAU CAC; anti-sense: GAU GAU UAU GAU GUG GUC CUG CUC CUU). Cells were plated in a 6-well plate at 250 k per well. When cells reached 60%–70% confluency, DsiRNA was added using protocols adapted from IDT. Briefly, DsiRNA and negative control DsiRNA were resuspended in nuclease-free water at 100 μM. The stock solutions were diluted to a 5 μM working solution consisting of 5× siRNA buffer and nuclease-free water. The working solution was diluted with transfection media to a 250 nM concentration and incubated for 5 min at room temperature. Concurrently, Dharmafect was mixed with transfection medium and incubated for 5 min at room temperature. The solutions were mixed and incubated for 20 min prior to adding the complex to complete EGM-2 to yield a final DsiRNA concentration of 25 nM. 2 ml were added per well of cells and incubated for 24 h before replacing with complete EGM-2. DsiRNA-mediated knockdown efficiency was verified using western blotting. Cells cultured in a well plate for 5 days following plating were lysed for the western blots since this period matched the timing of permeability testing.
2.9 |. RhoA activation and inactivation
In order to constitutively activate RhoA, vessels at day 4 were perfused with Rho Activator II (Cytoskeleton) at a concentration of 2 μg/ml for 4 h prior to use in permeability tests or fixation for immunocytochemistry. To assess the effects of RhoA inactivation, vessels were perfused with Rho Inhibitor I (C3 Transferase) (Cytoskeleton) at a concentration of 2 μg/ml for 4 h prior to taking permeability measurements at 20, 60, 120, and 240-min. Following 4 h of static conditions, vessels not used for permeability measurements were fixed for immunocytochemistry.
2.10 |. ELISA-based quantification of small GTPase activity
Commercial ELISA kits were purchased from Cytoskeleton (G-LISA) to quantify RhoA and Rac1 activation (Cytoskeleton). For both cases, cell lysates were prepared using Cytoskeleton’s protocols. Following exposure to flow or static conditions, the collagen/hyaluronan hydrogel was removed from the device and washed in ice-cold 1× PBS for 30 s. 50 μl of ice-cold cell lysis buffer with 1× protease inhibitor were injected into vessels and collected in a microcentrifuge tube. The cell lysate solution was spun at 10 000 g for 1 min at 4°C to pellet cell debris. The supernatant was collected and snap-frozen in liquid nitrogen, reserving a small amount for protein quantification using Precision Red (Cytoskeleton). Prior to measuring GTPase activity, samples were thawed in a room temperature water bath and equilibrated to 0.5–1 mg/ml for RhoA and 0.5 mg/ml for Rac1 samples. Sample numbers of were used to determine the mean and standard deviation of GTPase activation for each condition.
2.11 |. Activated RhoA pulldown
Activated RhoA pulldown kits were purchased from Cytoskeleton. Sample lysates were prepared similar to the protocol used for G-LISAs. Samples were processed using Rhotekin-conjugated beads provided in the kit. 200 μg of protein was incubated with 15 μl of the beads, with 50 μg reserved for quantifying total RhoA present in the sample. Following pulldown, samples were denatured in Lamelli buffer and separated using electrophoresis. 10 μl of each sample was loaded per well on a 4%–12% tris glycine gel in MOPS buffer. The gel was transferred onto a 0.2-μm PVDF membrane. Following the transfer, the membrane was probed using the iBind flex kit and a primary anti-RhoA antibody (Cytoskeleton) at 1:200 and HRP-conjugated secondary (1:4000) (CST #7074). Blots were quantified by measuring band intensity with ImageJ and normalizing relative expression to control conditions. Sample numbers of were used to determine the mean and standard deviation of permeability coefficients for each condition.
2.12 |. ZO-1 immunoprecipitation
Immunoprecipitation of ZO-1 was performed using cell lysates extracted from cell monolayers cultured on the collagen/HA hydrogels exposed to 24-h of fluid shear stress applied by a cone and plate rheometer. The gels were removed from the rheometer and washed immediately in ice-cold PBS. The gels were then submerged in ice-cold lysis buffer (CST) and sonicated. Gels were then spun down at 14 000 g for 10 min at 4°C. Supernatants were removed and snap-frozen reserving a small aliquot for protein quantification. Samples were equilibrated at 0.5 mg/ml protein concentration using ice-cold lysis buffer after thawing in a room temperature water bath. Samples were then loaded on a tris-acetate gel and separated using electrophoresis in tris-acetate buffer. Protein was transferred to a 0.45-μm PVDF membrane. The membrane was incubated overnight with ZO-1 (CST, #8193) (1:2000), add-γ (Santa Cruz, sc-365177) (1:400), or Spectrin-αII (Santa Cruz, sc-53444) (1:1000) antibodies and visualized with HRP-conjugated secondary antibodies (1:4000). Sample numbers of at least were used to determine the mean and standard deviation of isolated protein for each condition.
2.13 |. Quantitative reverse transcription-polymerase chain reaction
Quantitative reverse transcription-polymerase chain reaction (qRT-PCR) was used to measure the difference in message levels of CD44. mRNA was isolated from hydrogels using the RNEasy spin columns (Thermo Scientific) and quantified using a Nanodrop spectrophotometer. qScript reagent was used to reverse transcribe the isolated mRNA, and PCR was conducted with SYBR Green. Message levels were double normalized to non-POU domain-containing octamer-binding protein (NONO) and the control condition (flow or untreated with RhoA activator). Relative expression was quantified as where CT is cycles to threshold. The forward and reverse sequences for NONO are GTGTAGCGTCGCCGTTACTC and CCTTCATTTTGGCTGCTGGC respectively, and for CD44 are GAAGAAAGCCAGTGCGTCTC and GTGCTCTGCTGAGGCTGTAA. Samples were measured in triplicate.
2.14 |. Proliferation assay
The proliferation of CRISPR-transformed cells was measured by studying the uptake of thymine analog Bromodeoxyuridine (BrdU) (Alfa Aesar) for 12 h during the exponential growth phase. Following fixation in 4% paraformaldehyde, cells were permeabilized in 0.1% Triton X100. DNA hydrolysis was performed by treating the cells with 1 N HCl (Fisher Scientific) for 15 min at 37°C. HCl was neutralized by incubating cells in 0.1 M sodium borate buffer (ThermoFisher) for 10 min at room temperature. Cells were then washed thoroughly with PBS then incubated overnight at 4°C with 1:50 PE-labeled anti-BrdU (Biolegend) and 1% BSA in PBST. Gels were then counter-stained with Hoechst 33324 (1 μg/ml) (ThermoFisher) for 45 min at 37°C. ImageJ was used to calculate the number of dead cells and total cells in three different regions per plate ( plates per condition).
2.15 |. Viability assay
The viability of CRISPR transformed cells was using cell impermeable nuclear stain propidium iodide (2 μg/ml) (ThermoFisher) to identify dead cells and counter-stained with cell-permeant nuclear stain Hoechst 33324 (1 μg/ml) (ThermoFisher). Cells were grown to 60%–80% confluency in EGM-2 then incubated for 45 min in PBS containing the staining medium prior to imaging. ImageJ was used to calculate the number of dead cells and total cells in three different regions per plate ( plates per condition).
2.16 |. Statistical analysis
The open-source statistics package, R, was used to perform all statistical calculations. Data sets were tested for normality with Shapiro-Wilk tests prior to testing for significance. One- and two-way anova tests followed by Tukey HSD post hoc comparisons were used to evaluate significant differences between multiple conditions. Paired t tests were used to compare the fold change of Adducin/ZO1 and Spectrin/ZO1 with shear stress in the immunoprecipitation experiments. All other two-sample comparisons were made using Student’s t tests. Each statistical test used sample numbers greater than or equal to 3 unless otherwise noted and p < .05 was considered significant. All error bars indicate the standard deviation of the mean.
3 |. RESULTS
3.1 |. A threshold of shear stress is required for barrier function
In order to gain a more complete understanding of the effect of shear stress on barrier function, a range of shear stress levels was applied to the 3D BBB model for a period of 4 days. Four different levels of shear stress (static control, 0.18, 0.35, 0.7, and 2.1 dyn/cm2) were exerted by altering the volumetric flow rate of culture medium perfusing through the 3D vessels, which are depicted in Figure 1A(i–iii). This range of shear stress was chosen to represent the lower end of the shear stress range present in the brain vasculature,33 which previous measurements have shown is substantially heterogeneous.34,35 Each vessel was submerged in the culture medium during these experiments to assure equal access to nutrients and oxygen regardless of perfusion rate. Three separate assays evaluated barrier integrity: immunocytochemistry, FITC-dextran permeability assays, and TEER measurements. The former two assays were conducted at the end of the perfusion period, but TEER measurements could be performed daily without disrupting the vessels. Figure 1B–F show the effect of varying magnitudes of fluid shear stress on the morphology of the endothelial cells lining the in vitro vessel and localization of ZO-1, a tight-junction associated scaffolding protein.36 Figure S1 shows that tight junction formation in the 0.7 dyn/cm2 condition also exhibits localization of claudin-5 and vascular-endothelial cadherin to cell-cell junctions, validating the use of ZO-1 to assess barrier integrity with immunocytochemistry. After 4 days in culture, static vessels (Figure 1B) exhibited a substantial amount of perinuclear ZO-1 staining, with irregular localization to the junctions. Vessels exposed to low levels of shear stress (0.18 and 0.35 dyn/cm2) had a similar response, as evidenced in Figure 1C,D, respectively. In contrast, the vessels exposed to 0.7 and 2.1 dyn/cm2, indicated increased localization of ZO-1 to the cell-cell junctions (Figure 1E,F).
FIGURE 1.
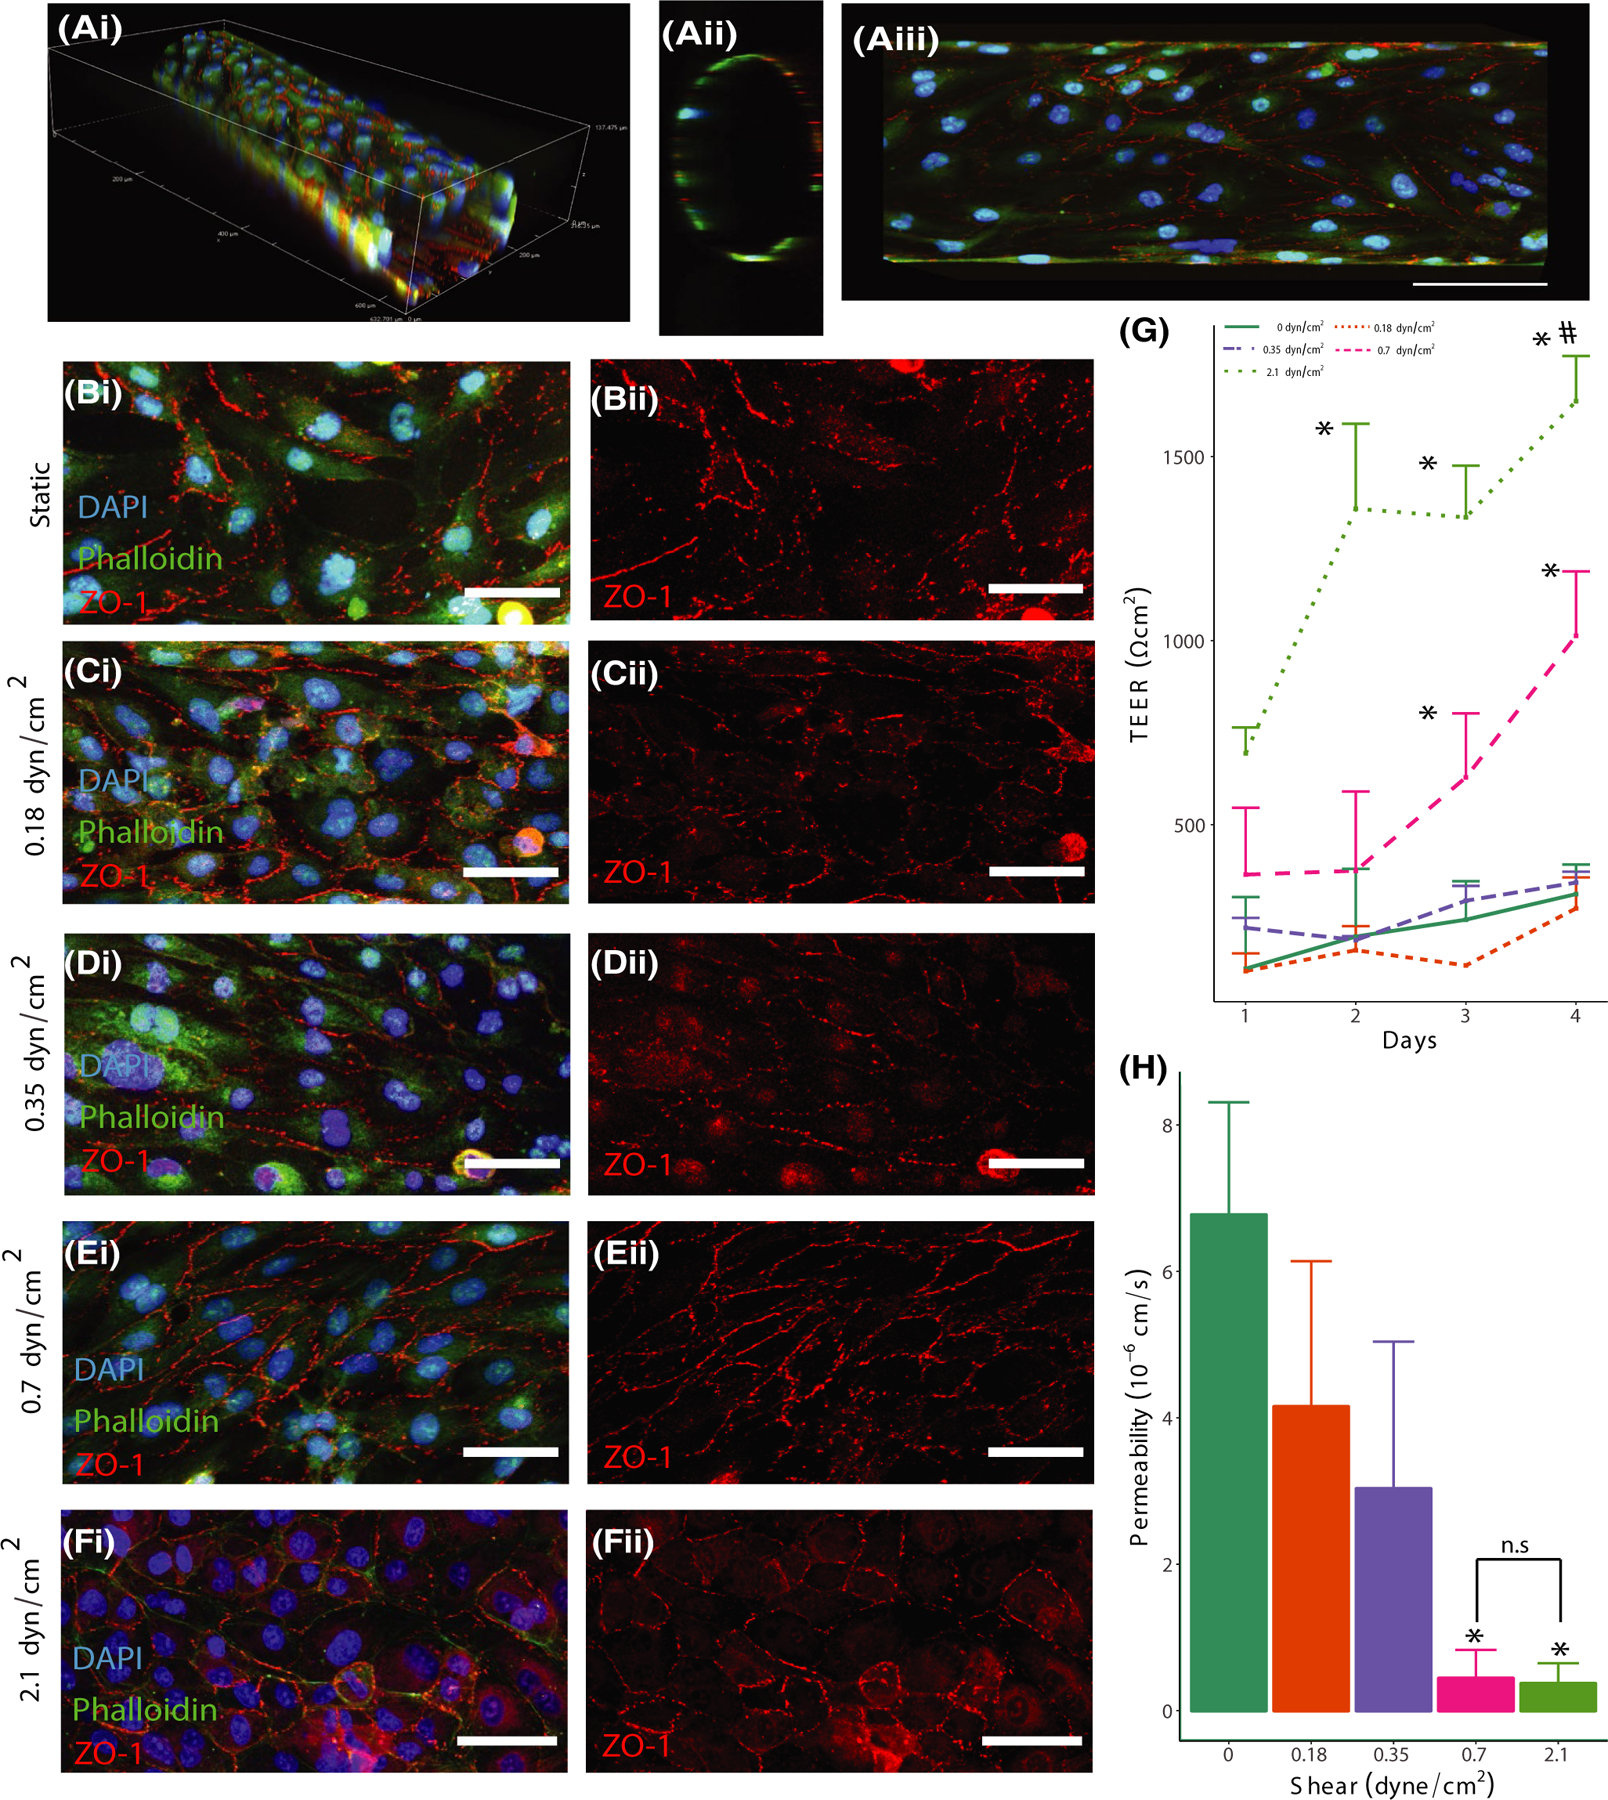
Fluid Shear stress affects tight junctions and barrier integrity. (A) Fluorescent images of hCMEC/D3-seeded channels cultured for 4 days in 3D (i), cross-section (ii), and maximum projection in the x and y plane (iii) scale = 100 μm. (B) Static, (C) 0.18 dyn/cm2, (D) 0.35 dyn/cm2, (E) 0.7 dyn/cm2, (F) 2.1 dyn/cm2 images showing DAPI (blue), phalloidin (green), and ZO-1 (red) (isolated in ii) staining of the vessel wall. Scale = 50 μm. (G) TEER measurements for channels exposed to static or shear conditions for 4 days, *denotes p < .05 compared to Day 1 value for the static condition. (H) Permeability coefficient of channels exposed to static or shear conditions for 4 days measured with 4 kDa dextran, *denotes p < .05 compared to static condition
The TEER measurements validated the presence of a shear stress threshold, exhibiting a significant increase in barrier integrity in vessels exposed to 0.7 and 2.1 dyn/cm2 at days 3 and 4 following seeding of the cells within the hydrogel (Figure 1G), with the 2.1 dyn/cm2 condition exhibiting significantly increased barrier at day 2. The permeability measurements also found that vessels exposed to 0.7 and 2.1 dyn/cm2 shear stress resulted in a significantly lower permeability compared to the static control at day 4 (Figure 1H). Although our previous studies indicated that the presence of astrocytes in the outer hydrogel was not required for barrier function in response to shear stress,2 TEER and permeability assays were conducted in astrocyte-seeded hydrogels at a sub-threshold level of shear stress (0.18 dyn/cm2) to determine if glial cells could alter the level of shear stress required for barrier formation. Figure S2A,B indicates no significant difference in FITC-dextran permeability and TEER values in hydrogels containing astrocytes after exposure to 0.18 dyn/cm2. These findings further emphasize the importance of fluid shear stress in barrier regulation in the cerebral vasculature.
3.2 |. HMW-HA bolsters barrier integrity
Experiments were conducted to determine the dynamics of barrier integrity following cessation of fluid shear stress to mimic the occlusion of cerebral blood flow during acute ischemic stroke. Vessels were exposed to 0.7 dyn/cm2, the minimum level of shear stress required for barrier formation, for 4 days prior to stopping flow (at time = 0) and evaluating permeability at 20, 60, 120, and 240 min. As Figure 2A indicates, the permeability of the 3D vessels significantly increased at the 120 and 240-min timepoints following removal from the flow. These experiments were also conducted in hydrogels without HMW-HA to determine the importance of matrix formulation on flow-mediated barrier integrity. As Figure 2A,B demonstrate, vessels fabricated in collagen-only hydrogels exhibited a significantly higher permeability at the initial measurement time, and there was no significant change in permeability in the 4 h that followed. These results suggested the presence of HA contributed to flow-mediated barrier formation and maintenance.
FIGURE 2.

ECM composition affects barrier integrity and CD44 localization. (A) Permeability measurements taken after 4 days of perfusion and 4 h after flow stoppage. (B) Permeability coefficients measured using 4 kDa dextran after 4 days of perfusion for channels in collagen or collagen/HA hydrogel. (C) Localization of CD44 in vessels patterned in a collagen-only hydrogel and stained for DAPI (blue), phalloidin (green), anti-ZO-1 (red), and anti-CD44 (magenta) (isolated in ii) in the vessel wall (i and ii) and in cross-section (iii). Scale: 20 μm. (D) Localization of CD44 in vessels patterned in a collagen/HA hydrogel exposed to static conditions. Scale: 20 μm. (E) Localization of CD44 in vessels patterned in a collagen/HA hydrogel exposed to flow. Scale: 20 μm. *Indicates p < .05 between collagen and collagen/HA scaffolds at each time point, and # indicates p < .05 compared to the 20-min time-point
Because CD44 is one of the main transmembrane receptors for HA, immunocytochemistry was performed on vessels patterned in both collagen/HA and collagen-only scaffolds and exposed to 4 days of 0.7 dyn/cm2 shear stress. Figures 2C–E provide images of these vessels, and show increased CD44 localization to cell-cell junctions in vessels patterned in collagen/HA scaffolds, whereas the receptor is diffuse throughout the cytoplasm and does not localize as strongly to cell-cell junctions in collagen-only hydrogels. Side views of the vessels in collagen-only hydrogels reveal positive CD44 staining on the apical side of the endothelium where there is likely a robust glycocalyx layer (Figure 2C(iii)). Conversely, positive staining is observed in both apical and basal sides in collagen/HA hydrogels, suggesting that the location of the receptor is crucial for the observed flow response (Figure 2Diii, Eiii). Quantification of message levels of CD44 exhibited no significant difference in expression between flow and static conditions in the collagen/HA hydrogels (Figure S3).
3.3 |. CD44 expression and downstream signaling mediates shear mechanotransduction
In order to further interrogate the role of CD44 in flow mechanotransduction, hCMEC/D3 cells were genetically modified using the CRISPR/Cas9 system to knockout expression of the receptor. A CRISPR/Cas9 plasmid containing a scrambled guide sequence was used as a control for these experiments. Double nickase plasmids were used to knockout CD44 to mitigate non-specific effects.37 Western blotting validated the effect of gene editing on CD44 expression (Figure 3A). Live/dead and BrdU assays were also conducted to assess the effect of CD44 knockout on viability and proliferation. Figure S4 shows that knockout did not significantly affect viability, but the number of cells in the S phase was significantly less than the scrambled condition, suggesting a reduced rate of proliferation. Both FITC-dextran permeability assays (Figure 3B) and daily TEER measurements (Figure 3C) indicated that reduced CD44 expression mitigated barrier formation in response to 0.7 dyn/cm2 of shear stress. In both assays, the scrambled control had a significantly higher barrier function compared to the other conditions. Vessels treated with scrambled guide sequences exhibited ZO-1 localization to the cell-cell junctions with minimal perinuclear localization (Figure 3D(ii)). The transformed cells did not exhibit different barrier integrity compared to normal cells determined by permeability and TEER measurements (Figure S5). Vessels seeded with CD44-knockdown cells and exposed to flow exhibited reduced localization to the cell-cell junctions of both ZO-1 and adducin-γ, an actin-capping protein38 associated with linking actin to the cell membrane (Figure 3D,E).
FIGURE 3.

Expression of CD44 regulates barrier formation. (A) Western blot of CD44 and beta-actin in CRISPR-modified cells. The ratio of intensities of CD44 and beta-actin signals normalized to scrambled levels. *Indicates p < .05 compared to scrambled and upregulated conditions. (B) Permeability coefficients of the channels seeded with transfected cells after 4 days of culture * denotes p < .05 compared to all conditions. (C) TEER measurements taken over the course of 4 days for different conditions, * indicates p < .05 compared to Day 1 timepoint for all conditions. (D,E) Fluorescent images of channels stained with DAPI (blue), anti-ZO-1 (red) (isolated in ii), and anti-adducin-γ (isolated in iii) for two conditions: scrambled control cells in collagen/HA hydrogels exposed to flow (D) and knockout cells in collagen/HA hydrogels exposed to flow (E). Scale: 50 μm. (F) Relative intensity (RQ) of RhoA activation in channels measured with ELISA. (G) Relative intensity (RQ) of Rac1 activation in channels measured with ELISA. *Indicates p < .05
Given that previous studies have found CD44 activation affects small GTPases associated with cell mechanotransduction,21 GTPase activity was examined using ELISA assays for both scrambled and knockout conditions in vessels exposed to shear stress. In order to produce a sufficient protein yield to use the ELISA assay, a larger diameter vessel (1-mm), which has been previously used for high Reynolds number studies,28 was endothelialized and exposed to 2.1 dyn/cm2 of shear stress, the minimum level of steady shear stress capable of being applied to the cells in this configuration. Figure S6A provides a confocal stack of the larger vessel, and Figure S6B verifies the localization of ZO-1 to the cell-cell junctions in response to shear stress in this geometry. Significantly elevated levels of RhoA-GTP were detected in CD44 KO vessels compared to scrambled controls (Figure 3F). Conversely, Rac1-GTP levels were reduced in CD44 KO vessels (Figure 3G). These results demonstrate that CD44 expression differentially regulates RhoA and Rac1 activation in endothelial cells exposed to fluid shear stress. Moreover, the combination of CD44 expression, HA in the ECM, and fluid shear stress are required for barrier formation in the 3D BBB model.
3.4 |. RhoA inactivation and Rac1 activation increase barrier integrity in response to flow
Having demonstrated that CD44 expression alters RhoA and Rac1 activation in the presence of fluid shear stress, studies were conducted to directly assess the effect of shear stress on small GTPase activation. The consequences of RhoA activation on BBB integrity have been extensively studied,8,23,39–43 but flow-mediated regulation of RhoA and Rac1 activity in cerebral endothelial cells has not been clarified. Both pulldown and ELISA assays were used to evaluate RhoA and Rac1 activity in vessels exposed to fluid shear stress. In order to generate sufficient protein for a pulldown assay, cells were seeded on the surface of the collagen/HA formulation used in the 3D model and placed in a cone and plate rheometer to apply shear stress (Figure S6C). In the 2D configuration, ZO-1 exhibited reduced localization to cell-cell junctions in static conditions (Figure S6D) compared to 2.1 dyn/cm2 shear stress (Figure S6E). The application of 2.1 dyn/cm2 significantly reduced the level of RhoA activity (Figure 4A). This result was confirmed using the large diameter 3D vessels and ELISA assays used previously (Figure 4B). Both assays indicated a reduction of nearly 50% compared to static controls. An ELISA was also conducted for Rac1 and found that Rac1 activation was significantly increased at both the 6- and 24-h time points following the start of perfusion (Figure 4C). These assays indicate that shear stress causes differential expression of RhoA and Rac1, significantly reducing RhoA activation while increasing Rac1 activation.
FIGURE 4.

Fluid shear stress mediates Rac1 and RhoA activation. (A) RQ of activated RhoA to total RhoA isolated using Rhotekin-mediated pulldown. (B) Relative intensity (RQ) of RhoA activation in channels exposed to flow measured with ELISA. (C) Relative intensity (RQ) of Rac1 activation in channels exposed to flow measured with ELISA. *Indicates p < .05 compared to the static condition. (D,E) Fluorescent images of vessels stained with DAPI (blue), ZO-1(red) (isolated in ii), and adducin (magenta) (isolated in iii) for C3 Transferase (D) and Rho Activator (E). Scale: 50 μm. (F) Permeability coefficients of channels perfused for 4 days then incubated with C3 Transferase for 4 h prior to flow stoppage. *Indicates p < .05 compared to the control condition for each time point. (G) Permeability coefficients of channels perfused for 4 days then exposed to a Rho Activator for 4 h prior to flow stoppage. *Indicates p < .05
In order to verify the importance of small GTPase activation for regulating barrier integrity in the 180-μm geometry, vessels were treated with a Rho inhibitor (C3 transferase) for 4 h prior to stopping the flow or treated with a Rho activator in the last 4 h of the 4-day perfusion with 0.7 dyn/cm2 of shear stress. Immunocytochemistry showed that modulating RhoA activation had a substantial effect on the morphology of the endothelial cells. Figure 4D shows strong ZO-1 localization to the junction following 240 min of no flow in the presence of C3 transferase. Additionally, adducin-γ, which previous studies have identified as a downstream target of small GTPase signaling,44 also exhibited increased localization to the junction in this condition (Figure 4D(iii)). In contrast, exposure to Rho activator resulted in barrier disruption and increased perinuclear staining of ZO-1 and adducin-γ at the end of the 4-day perfusion period (Figure 4E). FITC-dextran permeability testing with vessels perfused with the Rho inhibitor exhibited no significant increase in permeability, as shown in Figure 4F. In contrast, the permeability at the end of the 4-day perfusion was significantly higher in vessels treated with the Rho activator (Figure 4G). hCMEC/D3 cells in culture were treated with RhoA activator for 4 h to determine whether RhoA activation affected CD44 expression. Figure S7 indicates that treatment with RhoA activator significantly reduced message levels of CD44, suggesting potential feedback between CD44 and RhoA activation. An additional experiment was conducted to determine whether RhoA inhibition could recover permeability in vessels seeded with CD44 knockout cells. Vessels were perfused for 4 days, and then C3 transferase was added to the culture medium. Figure S8 shows that inhibiting RhoA in knockout vessels did not produce a functional barrier, which highlights potential differences in the effect of small GTPase signaling in barrier formation versus barrier maintenance.
3.5 |. Adducin-γ localization is a downstream effect of Rac1 activation
Given that adducin-γ localization to cell-cell junctions was affected by both CD44 expression and RhoA inhibition, experiments were conducted to determine the importance of this actin-capping protein to flow-mediated barrier formation. Previous studies have shown that adducin contributes to tight junction stability in human epithelial cells,38 but the effect of fluid shear stress on adducin-γ has not been studied. As Figure 5A,B indicate, the localization of adducin-γ to the junctions was altered in vessels exposed to 0.7 dyn/cm2 shear stress compared to static controls. In order to determine whether a tight junction-associated complex incorporating adducin-γ formed in response to flow, ZO-1 immunoprecipitation was performed. To produce sufficient protein for the immunoprecipitation, hCMEC/D3 cells were seeded on the surface of collagen/HA hydrogels and placed in a cone and plate rheometer to apply steady shear stress of 0.7 or 2.1 dyn/cm2. Figure 5C shows that the application of shear stress resulted in significantly higher levels of adducin-γ in the ZO-1 immunoprecipitation compared to static controls. Significantly increased levels of spectrin-α II bound to the ZO-1 complex were also measured in response to shear (Figure S9), consistent with previous findings that spectrin binds to adducin.45
FIGURE 5.

Adducin-γ regulates tight junctional stability through association with ZO-1. (A,B) Fluorescent images of vessels stained with DAPI (blue), phalloidin (green), ZO-1 (red), and add-γ (magenta) (isolated in ii) for flow (A) and static (B) conditions. (C) Immunoprecipitation of the ZO-1 complex from cells exposed to static and flow conditions. The relative intensity of add-γ bound to ZO-1 isolated using IP and measured with western blot. Scale: 25 μm, * indicates p < .05 compared to static condition. (D) Western blot of cells treated with DsiRNA targeting add-γ. (E) Relative intensity of add-γ in DsiRNA and control cells normalized to beta-actin. (F) Permeability coefficients measured in channels seeded with add-γ knockdown (KD) hCMEC/D3 cells * indicates p < .05 compared to control
To interrogate the importance of adducin-γ expression during BBB formation, siRNA was used to knockdown message levels of the protein in the hCMEC/D3 cells prior to seeding within the vessels (Figure 5D,E). Knockdown efficiency was measured 5 days after transfection to ensure that in vitro vessels seeded with treated endothelial cells would express reduced levels of adducin-γ throughout the perfusion period. Permeability testing of vessels containing the knockdown cells exhibited significantly higher permeability compared to scrambled controls (Figure 5F). Taken together, these results suggest that recruitment of adducin-γ to cell-cell junctions is an integral downstream result of fluid shear stress application to cerebral endothelial cells and that both CD44 expression and small GTPase activity alter its localization.
4 |. DISCUSSION
Our results identify components of a previously unreported signaling transduction pathway that mediates BBB formation in response to fluid shear stress. These findings identify CD44 as a mechanosensor that localizes to cell-cell junctions in response to shear stress and the presence of HMW-HA in the ECM. Shear stress results in activation of Rac1 and inhibition of RhoA, and induces a complex including ZO-1, adducin-γ, and spectrin-αII at the junctions (summarized in Figure 6). Our findings suggest that a threshold level of shear stress is needed to activate this pathway, given that levels of shear stress <0.7 dyn/cm2 were unable to significantly increase barrier formation and maintenance during perfusion. Moreover, CRISPR-mediated alteration to CD44 levels suggests that all three components: hyaluronan, CD44, and shear stress are required for barrier formation in the 3D BBB model. Our study concludes that this mechanism is integral to BBB mechanotransduction, identifying an alternative mechanosensory complex of shear stress exerted by cerebral blood flow.10
FIGURE 6.

Mechanosensitive CD44 helps stabilize tight junctions through activation of Rac1 and inactivation of RhoA. (A) CD44 bound to HA transduces fluid flow. (B) The application of shear stress activates Rac1 while inactivating RhoA. (C) Activation of Rac1 leads to the recruitment of add-γ and ZO-1 to the cell-cell junction. (D) add-γ and ZO-1 form a binding complex with spectrin-αII that stabilizes tight junctions required for the blood-brain barrier
The role of CD44 in mechanotransduction has been well-studied,46 but its importance for sensing shear stress has yet to be investigated in detail. A previous study using bovine aortic endothelial cells found that inhibiting hyaluronan synthesis negated flow-mediated cell spreading on soft (100 Pa) two-dimensional substrates,47 suggesting that CD44 may mediate cytoskeletal processes in response to shear stress. Here, the importance of CD44 was initially revealed due to the difference between vessels fabricated in collagen-only and collagen/HA hydrogels. There was a significantly lower permeability in collagen/HA hydrogels where CD44 was present on both apical and basal sides, compared to collagen-only hydrogels where CD44 was only present on the apical side, likely due to the presence of the glycocalyx. Previous studies have demonstrated the importance of the glycocalyx in flow mechanotransduction, and vessels fabricated in collagen-only hydrogels still have a significantly lower permeability than static controls after perfusion. Yet, our results demonstrate that the presence of HA in the ECM yields a significantly lower permeability, demonstrating the importance of cell-matrix adhesions for mediating the flow response.
The CD44 knockout studies show that the cell surface receptor differentially regulates RhoA and Rac1 when exposed to fluid shear stress. Furthermore, the ELISA and pulldown experiments confirmed that fluid shear stress significantly increased the activation of Rac1 while attenuating the activation of RhoA, providing further evidence that the activity of these small GTPases is affected by shear stress. The activation of RhoA has been shown to induce cell contractility and cytoskeleton restructuring, resulting in enhanced cell motility and disrupted barrier integrity. Conversely, Rac1 has been identified as a key mediator of vascular integrity in systemic vasculature.13,48 Previous studies have shown that CD44 can activate these small GTPases,16,21 but the results presented here are the first to demonstrate that this signaling is mechanosensitive.
Another crucial component of the signaling mechanism involves adducin-γ localization to tight junctions in the presence of shear stress. Adducin-γ has been shown in previous work to stabilize the cytoskeleton44 and cell-cell junctions,38 and is a ROCK substrate.45,49 Studies have found that adducin-γ is an important component of both adherens and tight junctions within endothelial cells and that it mediates cAMP signaling.50 Additionally, the increase in spectrin-αII bound to the tight junction complex in response to flow indicates a potential role in the stabilization of the tight-junction complex. Previous studies have identified the ankyrin-adducin-spectrin complex, which binds to transmembrane proteins bridging the gap to the cytoskeleton.51 Specifically, spectrin-αII is associated with the brain and its cleavage products are a potential biomarker for neurodegenerative disorders.52 These findings indicate that the association of adducin-γ and spectrin-αII may contribute to barrier function, yet additional studies are required to explicitly determine how the activity of RhoA and Rac1 affects the localization of these proteins in cell-cell junctions. Nonetheless, the knockdown studies suggest that adducin-γ is required to maintain BBB integrity, since reducing its expression resulted in increased permeability and barrier disruption. Clinical studies have identified adducin-γ as a factor that can contribute to altered cerebral vascular function,53 providing further evidence of its importance in the maintenance of the BBB.
Taken together, these results demonstrate a new mechanism by which fluid shear stress is transduced by endothelial cells within the BBB. Future work is required to investigate crosstalk between this pathway and previously studied mechanosensitive mediators of vascular integrity,6,12,13,54 given recent studies showing that PECAM also affects BBB integrity,55 and to determine ways in which this mechanism can be manipulated in vivo. Moreover, although this study focuses on paracellular transport, additional studies can interrogate the effect of this mechanosensitive pathway on transcellular transport56 in the BBB. Furthermore, a limitation of the 3D BBB model is its difficulty in assessing how certain factors affect barrier formation and maintenance distinctly. For example, although we can evaluate whether shear stress is needed to both form and maintain the barrier by tuning the flow rate, the matrix composition can only be tuned at the time of fabrication, not after 4 days of perfusion culture. The inability to evaluate formation and maintenance distinctly was apparent in the finding that inhibition of RhoA with C3 transferase treatment for 4 h did not recover barrier function in vessels consisting of CD44-KO cells: knocking out CD44 prevents the initial barrier formation that RhoA inhibition is able to maintain in scrambled controls. Finally, an additional limitation of the current study is its use of the immortalized hCMEC/D3 cell line; further studies are required to determine whether this CD44-small GTPase-adducin mechanism is present in primary cells or induced pluripotent stem cell-derived endothelial cells exposed to fluid shear stress.
Supplementary Material
ACKNOWLEDGMENTS
We express gratitude to Kiet Tran for his invaluable assistance in helping to fabricate 3D vessels used in our experiments. We would also like to thank Dr. Robert Nagele of Rowan’s School of Osteopathic Medicine for providing the hCMEC/D3 cell line used for these experiments. This work was supported by an American Heart Association Scientist Development Grant awarded to P.A.G. (17SDG33460432), National Institute of Health grant awarded to F.F. (RO1AG057842), and National Science Foundation Graduate Research Fellowship (2019287762) awarded to B.J.D.
Funding information
American Heart Association (AHA), Grant/Award Number: 17SDG33460432; National Science Foundation (NSF), Grant/Award Number: 2019287762; National Institute of Health, Grant/Award Number: RO1AG057842
Abbreviations:
- add-γ
gamma-adducin
- BBB
blood-brain barrier
- CD44
cluster of differentiation 44
- CNS
central nervous system
- DsiRNA
dicer-substrate short interfering RNA
- DTT
dithiothreitol
- ECM
extracellular matrix
- EGM-2
endothelial growth media
- FITC
fluorescein isocyanate
- GFAP
glial fibrillary acidic protein
- GTP
guanosine triphosphate
- HCAM
homing cell adhesion molecule
- hCMEC/D3
human cerebral microvascular endothelial cells
- HMW-HA
high molecular weight hyaluronic acid
- LDS
lithium dodecyl sulfate
- NHA
normal human astrocyte
- oHA
oligomeric hyaluronic acid
- PDMS
polydimethylsiloxane
- PECAM
platelet endothelial cell adhesion molecule
- ROCK
rho-associated kinase
- TEER
trans-endothelial electrical resistance
- VE
cadherin vascular endothelial cadherin
- VEGFR2
vascular endothelial growth factor receptor 2
Footnotes
DISCLOSURES
The authors have no relevant conflicts of interest.
SUPPORTING INFORMATION
Additional supporting information may be found in the online version of the article at the publisher’s website.
DATA AVAILABILITY STATEMENT
All raw data, images from confocal microscopy, permeability measurements, blots, and any other forms of data used to generate figures and supplemental figures are available upon request to the corresponding author.
REFERENCES
- 1.Cucullo L, Hossain M, Puvenna V, Marchi N, Janigro D. The role of shear stress in blood-brain barrier endothelial physiology. BMC Neurosci 2011;12:40. [DOI] [PMC free article] [PubMed] [Google Scholar]
- 2.Partyka PP, Godsey GA, Galie JR, et al. Mechanical stress regulates transport in a compliant 3D model of the blood-brain barrier. Biomaterials 2017;115:30–39. [DOI] [PubMed] [Google Scholar]
- 3.Abbott NJ, Ronnback L, Hansson E. Astrocyte-endothelial interactions at the blood-brain barrier. Nat Rev Neurosci 2006;7(1):41–53. [DOI] [PubMed] [Google Scholar]
- 4.Reed MJ, Damodarasamy M, Banks WA. The extracellular matrix of the blood-brain barrier: structural and functional roles in health, aging, and Alzheimer’s disease. Tissue Barriers 2019;7(4):1651157. [DOI] [PMC free article] [PubMed] [Google Scholar]
- 5.Sherman LS, Struve JN, Rangwala R, Wallingford NM, Tuohy TM, Kuntz C. Hyaluronate-based extracellular matrix: keeping glia in their place. Glia 2002;38(2):93–102. [DOI] [PubMed] [Google Scholar]
- 6.Dorland YL, Huveneers S. Cell-cell junctional mechanotransduction in endothelial remodeling. Cell Mol Life Sci 2017;74(2):279–292. [DOI] [PMC free article] [PubMed] [Google Scholar]
- 7.Li YS, Haga JH, Chien S. Molecular basis of the effects of shear stress on vascular endothelial cells. J Biomech 2005;38(10):1949–1971. [DOI] [PubMed] [Google Scholar]
- 8.Radeva MY, Waschke J. Mind the gap: mechanisms regulating the endothelial barrier. Acta Physiol 2018;222(1):e12860. [DOI] [PubMed] [Google Scholar]
- 9.Davies PF. Flow-mediated endothelial mechanotransduction. Physiol Rev 1995;75(3):519–560. [DOI] [PMC free article] [PubMed] [Google Scholar]
- 10.Givens C, Tzima E. Endothelial mechanosignaling: does one sensor fit all? Antioxid Redox Signal 2016;25(7):373–388. [DOI] [PMC free article] [PubMed] [Google Scholar]
- 11.Pahakis MY, Kosky JR, Dull RO, Tarbell JM. The role of endothelial glycocalyx components in mechanotransduction of fluid shear stress. Biochem Biophys Res Commun 2007;355(1):228–233. [DOI] [PMC free article] [PubMed] [Google Scholar]
- 12.Tzima E, Irani-Tehrani M, Kiosses WB, et al. A mechanosensory complex that mediates the endothelial cell response to fluid shear stress. Nature 2005;437(7057):426–431. [DOI] [PubMed] [Google Scholar]
- 13.Polacheck WJ, Kutys ML, Yang J, et al. A non-canonical Notch complex regulates adherens junctions and vascular barrier function. Nature 2017;552(7684):258–262. [DOI] [PMC free article] [PubMed] [Google Scholar]
- 14.Cyphert JM, Trempus CS, Garantziotis S. Size matters: molecular weight specificity of hyaluronan effects in cell biology. Int J Cell Biol 2015;2015:563818. [DOI] [PMC free article] [PubMed] [Google Scholar]
- 15.Al-Ahmad AJ, Patel R, Palecek SP, Shusta EV. Hyaluronan impairs the barrier integrity of brain microvascular endothelial cells through a CD44-dependent pathway. J Cereb Blood Flow Metab 2019;39(9):1759–1775. [DOI] [PMC free article] [PubMed] [Google Scholar]
- 16.Bourguignon LY. Hyaluronan-mediated CD44 activation of RhoGTPase signaling and cytoskeleton function promotes tumor progression. Semin Cancer Biol 2008;18(4):251–259. [DOI] [PMC free article] [PubMed] [Google Scholar]
- 17.Matou-Nasri S, Gaffney J, Kumar S, Slevin M. Oligosaccharides of hyaluronan induce angiogenesis through distinct CD44 and RHAMM-mediated signalling pathways involving Cdc2 and gamma-adducin. Int J Oncol 2009;35(4):761–773. [DOI] [PubMed] [Google Scholar]
- 18.Deed R, Rooney P, Kumar P, et al. Early-response gene signalling is induced by angiogenic oligosaccharides of hyaluronan in endothelial cells. Inhibition by non-angiogenic, high-molecular-weight hyaluronan. Int J Cancer 1997;71(2):251–256. [DOI] [PubMed] [Google Scholar]
- 19.Jiang D, Liang J, Noble PW. Hyaluronan as an immune regulator in human diseases. Physiol Rev 2011;91(1):221–264. [DOI] [PMC free article] [PubMed] [Google Scholar]
- 20.Singleton PA, Dudek SM, Ma SF, Garcia JG. Transactivation of sphingosine 1-phosphate receptors is essential for vascular barrier regulation. Novel role for hyaluronan and CD44 receptor family. J Biol Chem 2006;281(45):34381–34393. [DOI] [PubMed] [Google Scholar]
- 21.Bourguignon LY. Matrix hyaluronan-activated CD44 signaling promotes keratinocyte activities and improves abnormal epidermal functions. Am J Pathol 2014;184(7):1912–1919. [DOI] [PMC free article] [PubMed] [Google Scholar]
- 22.Kugelmann D, Rotkopf LT, Radeva MY, Garcia-Ponce A, Walter E, Waschke J. Histamine causes endothelial barrier disruption via Ca(2+)-mediated RhoA activation and tension at adherens junctions. Sci Rep 2018;8(1):13229. [DOI] [PMC free article] [PubMed] [Google Scholar]
- 23.Mikelis CM, Simaan M, Ando K, et al. RhoA and ROCK mediate histamine-induced vascular leakage and anaphylactic shock. Nat Commun 2015;6:6725. [DOI] [PMC free article] [PubMed] [Google Scholar]
- 24.Wojciak-Stothard B, Ridley AJ. Rho GTPases and the regulation of endothelial permeability. Vascul Pharmacol 2002;39(4–5):187–199. [DOI] [PubMed] [Google Scholar]
- 25.Wang Z-G, Cheng YI, Yu X-C, et al. bFGF protects against blood-brain barrier damage through junction protein regulation via PI3K-Akt-Rac1 pathway following traumatic brain injury. Mol Neurobiol 2016;53(10):7298–7311. [DOI] [PMC free article] [PubMed] [Google Scholar]
- 26.Weksler BB, Subileau EA, Perrière N, et al. Blood-brain barrier-specific properties of a human adult brain endothelial cell line. FASEB J 2005;19(13):1872–1874. [DOI] [PubMed] [Google Scholar]
- 27.Placone AL, McGuiggan PM, Bergles DE, Guerrero-Cazares H, Quinones-Hinojosa A, Searson PC. Human astrocytes develop physiological morphology and remain quiescent in a novel 3D matrix. Biomaterials 2015;42:134–143. [DOI] [PMC free article] [PubMed] [Google Scholar]
- 28.Bouhrira N, DeOre BJ, Sazer DW, Chiaradia Z, Miller JS, Galie PA. Disturbed flow disrupts the blood-brain barrier in a 3D bifurcation model. Biofabrication 2020;12(2):025020. 10.1088/1758-5090/ab5898 [DOI] [PubMed] [Google Scholar]
- 29.Bowers HC, Fiori ML, Khadela JB, Janmey PA, Galie PA. Cell-matrix tension contributes to hypoxia in astrocyte-seeded viscoelastic hydrogels composed of collagen and hyaluronan. Exp Cell Res 2019;376(1):49–57. [DOI] [PubMed] [Google Scholar]
- 30.Adamson RH, Lenz JF, Curry FE. Quantitative laser scanning confocal microscopy on single capillaries: permeability measurement. Microcirculation 1994;1(4):251–265. [DOI] [PubMed] [Google Scholar]
- 31.Benson K, Cramer S, Galla HJ. Impedance-based cell monitoring: barrier properties and beyond. Fluids Barriers CNS 2013;10(1):5. [DOI] [PMC free article] [PubMed] [Google Scholar]
- 32.Fan F, Pabbidi MR, Ge Y, et al. Knockdown of Add3 impairs the myogenic response of renal afferent arterioles and middle cerebral arteries. Am J Physiol Renal Physiol 2017;312(6):F971–F981. [DOI] [PMC free article] [PubMed] [Google Scholar]
- 33.Mairey E, Genovesio A, Donnadieu E, et al. Cerebral microcirculation shear stress levels determine Neisseria meningitidis attachment sites along the blood-brain barrier. J Exp Med 2006;203(8):1939–1950. [DOI] [PMC free article] [PubMed] [Google Scholar]
- 34.Villringer A, Them A, Lindauer U, Einhaupl K, Dirnagl U. Capillary perfusion of the rat brain cortex. An in vivo confocal microscopy study. Circ Res 1994;75(1):55–62. [DOI] [PubMed] [Google Scholar]
- 35.Hudetz AG, Feher G, Knuese DE, Kampine JP. Erythrocyte flow heterogeneity in the cerebrocortical capillary network. Adv Exp Med Biol 1994;345:633–642. [DOI] [PubMed] [Google Scholar]
- 36.Dejana E Endothelial cell-cell junctions: happy together. Nat Rev Mol Cell Biol 2004;5(4):261–270. [DOI] [PubMed] [Google Scholar]
- 37.Ran F, Hsu P, Lin C-Y, et al. Double nicking by RNA-guided CRISPR Cas9 for enhanced genome editing specificity. Cell 2013;154(6):1380–1389. [DOI] [PMC free article] [PubMed] [Google Scholar]
- 38.Naydenov NG, Ivanov AI. Adducins regulate remodeling of apical junctions in human epithelial cells. Mol Biol Cell 2010;21(20):3506–3517. [DOI] [PMC free article] [PubMed] [Google Scholar]
- 39.Sladojevic N, Yu B, Liao JK. ROCK as a therapeutic target for ischemic stroke. Expert Rev Neurother 2017;17(12):1167–1177. [DOI] [PMC free article] [PubMed] [Google Scholar]
- 40.Lai AY, McLaurin J. Rho-associated protein kinases as therapeutic targets for both vascular and parenchymal pathologies in Alzheimer’s disease. J Neurochem 2018;144(5):659–668. [DOI] [PubMed] [Google Scholar]
- 41.Ramirez SH, Heilman D, Morsey B, Potula R, Haorah J, Persidsky Y. Activation of peroxisome proliferator-activated receptor gamma (PPARgamma) suppresses Rho GTPases in human brain microvascular endothelial cells and inhibits adhesion and transendothelial migration of HIV-1 infected monocytes. J Immunol 2008;180(3):1854–1865. [DOI] [PMC free article] [PubMed] [Google Scholar]
- 42.Baumer Y, Burger S, Curry FE, Golenhofen N, Drenckhahn D, Waschke J. Differential role of Rho GTPases in endothelial barrier regulation dependent on endothelial cell origin. Histochem Cell Biol 2008;129(2):179–191. [DOI] [PubMed] [Google Scholar]
- 43.Stamatovic SM, Dimitrijevic OB, Keep RF, Andjelkovic AV. Protein kinase Calpha-RhoA cross-talk in CCL2-induced alterations in brain endothelial permeability. J Biol Chem 2006;281(13):8379–8388. [DOI] [PubMed] [Google Scholar]
- 44.Gao W, Liu Y, Fan L, et al. Role of γ-adducin in actin cytoskeleton rearrangements in podocyte pathophysiology. Am J Physiol Renal Physiol 2021;320(1):F97–F113. [DOI] [PMC free article] [PubMed] [Google Scholar]
- 45.Matsuoka Y, Li X, Bennett V. Adducin: structure, function and regulation. Cell Mol Life Sci 2000;57(6):884–895. [DOI] [PMC free article] [PubMed] [Google Scholar]
- 46.Razinia Z, Castagnino P, Xu T, Vazquez-Salgado A, Pure E, Assoian RK. Stiffness-dependent motility and proliferation uncoupled by deletion of CD44. Sci Rep 2017;7(1):16499. [DOI] [PMC free article] [PubMed] [Google Scholar]
- 47.Galie PA, van Oosten A, Chen CS, Janmey PA. Application of multiple levels of fluid shear stress to endothelial cells plated on polyacrylamide gels. Lab Chip 2015;15(4):1205–1212. [DOI] [PMC free article] [PubMed] [Google Scholar]
- 48.Waschke J, Baumgartner W, Adamson RH, et al. Requirement of Rac activity for maintenance of capillary endothelial barrier properties. Am J Physiol Heart Circ Physiol 2004;286(1):H394–H401. [DOI] [PubMed] [Google Scholar]
- 49.Kugelmann D, Waschke J, Radeva MY. Adducin is involved in endothelial barrier stabilization. PLoS One 2015;10(5):e0126213. [DOI] [PMC free article] [PubMed] [Google Scholar]
- 50.Ponce AG, Radeva MY, Waschke J. α-Adducin is crucial for endothelial tight junction integrity. FASEB J 2019;33(1_supplement):686.3-.3. 10.1096/fasebj.2019.33.1_supplement.686.3 [DOI] [Google Scholar]
- 51.Baines AJ, Lu HC, Bennett PM. The Protein 4.1 family: hub proteins in animals for organizing membrane proteins. Biochim Biophys Acta 2014;1838(2):605–619. [DOI] [PubMed] [Google Scholar]
- 52.Yan XX, Jeromin A, Jeromin A. Spectrin breakdown products (SBDPs) as potential biomarkers for neurodegenerative diseases. Curr Transl Geriatr Exp Gerontol Rep 2012;1(2):85–93. [DOI] [PMC free article] [PubMed] [Google Scholar]
- 53.Shekhar S, Liu R, Travis OK, Roman RJ, Fan F. Cerebral autoregulation in hypertension and ischemic stroke: a mini review. J Pharm Sci Exp Pharmacol 2017;2017(1):21–27. [PMC free article] [PubMed] [Google Scholar]
- 54.Hahn C, Schwartz MA. Mechanotransduction in vascular physiology and atherogenesis. Nat Rev Mol Cell Biol 2009;10(1):53–62. [DOI] [PMC free article] [PubMed] [Google Scholar]
- 55.Wimmer I, Tietz S, Nishihara H, et al. PECAM-1 stabilizes blood-brain barrier integrity and favors paracellular T-cell diapedesis across the blood-brain barrier during neuroinflammation. Front Immunol 2019;10:711. [DOI] [PMC free article] [PubMed] [Google Scholar]
- 56.Knowland D, Arac A, Sekiguchi K, et al. Stepwise recruitment of transcellular and paracellular pathways underlies blood-brain barrier breakdown in stroke. Neuron 2014;82(3):603–617. [DOI] [PMC free article] [PubMed] [Google Scholar]
Associated Data
This section collects any data citations, data availability statements, or supplementary materials included in this article.
Supplementary Materials
Data Availability Statement
All raw data, images from confocal microscopy, permeability measurements, blots, and any other forms of data used to generate figures and supplemental figures are available upon request to the corresponding author.