

Abstract
In this paper, continuous crystallization of Atorvastatin calcium (ASC) using a continuous oscillatory baffled crystallizer (COBC) has been investigated. Like most API manufacturing, ASC is manufactured batchwise and the pure API is recovered via batch combined cooling and antisolvent crystallization (CCAC) process, which has the challenges of low productivity, wide crystal size distribution (CSD) and sometimes polymorphic form contamination. To overcome the limitations of the batch crystallization, continuous crystallization of ASC was studied in a NiTech (United Kingdom) DN15 COBC, manufactured by Alconbury Weston Ltd. (AWL, United Kingdom), with the aim to improve productivity and CSD of the desired polymorph. The COBC has the advantage of high heat transfer rates and improved mixing that significantly reduces the crystallization time. It also has the advantage of spatial temperature distribution and multiple addition ports to control supersaturation and hence the crystallization process. This work uses an array of process analytical technology (PAT) tools to assess key process parameters that affect the polymorphic outcome and CSD. Two parameters were found to have significant impact on the polymorph, they are ratio of solvent to antisolvent at the point of mixing of the two streams and presence of seeds. The splitting of antisolvent into two addition ports in the COBC was found to give the desired form. The CCAC of ASC in COBC was found to be 100-fold more productive than the batch CCAC process. The cycle time for generating 100 g of desired polymorphic form of ASC also significantly reduced from 22 hours in batch process to 12 minutes in the COBC. The crystals obtained using a CCAC process in a COBC had a narrower CSD compared to that from a batch crystallization process.
Keywords: Atorvastatin calcium, continuous oscillatory baffled crystallizer, combined cooling and antisolvent crystallization, productivity, crystal size distribution
1. Introduction
In recent years, continuous or smart manufacturing has received much interest across academia, pharmaceutical industry and regulatory bodies due to its potential to lower the cost of manufacturing while maintaining consistent quality.1–4 The regulatory bodies, such as the U.S. Food and Drug Administration (FDA), have been encouraging and incentivizing pharmaceutical companies to adopt continuous manufacturing to ensure uninterrupted supply of high-quality drugs to patients.5 Crystallization is an important and a challenging link between drug substance and drug product manufacturing. The manufacturing of over 90% of active pharmaceutical ingredients (APIs) involve crystallization of small molecules.6 The properties of the crystallized material govern the efficiency of downstream operations and the final drug product performance. Despite several publications on control and optimization studies on batch crystallization,7–15 the industry is facing prominent issues such as batch-to-batch variability, low productivity, large equipment footprint, and difficulty in scale up. These issues can be overcome by continuous crystallization, which operates at controlled state and are easy to scale up.16–17
Broadly speaking there are two categories of continuous crystallization platforms, (i) based on mixed suspension mixed product removal (MSMPR) crystallizers, and (ii) tubular / plug flow crystallization systems. The MSMPR crystallizers offer the advantage of simple transfer of existing batch capacity to continuous, however, they produce broader crystal size distribution (CSD) due to their broad residence time distributions.18 One widely used tubular crystallization platform is the continuous oscillatory baffled crystallizer (COBC). The COBC provides narrower product CSD with near plug flow operation. The COBC consists of multiple jacketed tubular sections, which allow the implementation of spatial temperature profiles and/or spatial distribution of antisolvent addition across multiple injection ports. There has been an increasing number of publications on continuous manufacturing equipment, continuous unit operation studies on existing API or model compounds coming both from industry and academia. Various model compounds have been studied in batch OBC. Improved paracetamol crystal quality was obtained by cooling crystallization in batch OBC.19–20 Lawton et al. demonstrated successful operation of continuous crystallization of an API in a COBC and were able to achieve the target crystal size by adjusting operating parameters such as cooling rate, oscillation intensity, supersaturation and seeding21. Polymorphic control of L-glutamic acid was done in seeded batch and continuous cooling crystallization in COBC.22–24 In a study by Briggs et al. it was found that, in the absence of seed, the COBC system could not be operated without significant encrustation.25 Brown et al. studied antisolvent (AS) crystallization of salicylic acid in COBC and were able to produce 1 kg of material by operating continuously for 6.25 h.26 Continuous manufacturing of statins including continuous crystallization of ASC form I was evaluated in flow reactors and that reduced the cycle time from 100 h in batch process to 24 h in continuous process. The continuous crystallization process consisted of dynamic mixing tubular crystallizer and series of MSMPR to obtained the desired form I of ASC.27 Alvarez and Myerson studied continuous AS crystallization of pharmaceutical APIs in a plug flow crystallizer (PFC) with static mixers and found that the crystal size could be increased or decreased with more number of AS addition points in the PF, depending on the kinetics of the system.28 A few cooling and antisolvent crystallization modeling studies have been done by Ridder B. et al. and Su Q et al.29–30
While the purity of the produced crystals is the primary concern in most of the applications, there are secondary properties, such as the polymorphic form and the crystal size distribution (CSD), that can have a major impact on downstream processes (e.g. filtration, drying, milling, storage, etc.) and final drug product performance. The polymorphs differ in physiochemical properties such as solubility, melting point, dissolution rate, which influence the performance of the API such as bioavailability. The traditional cooling only crystallization is not well suited for the crystallization of heat sensitive drug substances. For such systems, antisolvent is typically used to improve the yield of the product. However, the final solvent to antisolvent ratio can impact the polymorphic outcome of the drug substance. Therefore, designing a combined cooling and antisolvent crystallization (CCAC) processes to solve the challenges of active pharmaceutical ingredient (API) crystallization in a highly regulated environment is a complex engineering problem. This problem was somewhat addressed using model-based optimization studies in which batch CCAC process resulted in superior control of the CSD of an API, lovastatin.31 Similarly, a model-based design was proposed and evaluated in continuous CCAC process for a model compound, aspirin in an MSMPR.10 Szilagyi and associates optimized a complex continuous cooling only crystallization network using a model-based digital design framework with to minimize the fine index of the product size distribution.32 Recently, a proof-of-concept of an in situ seed generation technique via a combined MSMPR−COBC system was evaluated for a CCAC of a model compound.33 However, there are no continuous CCAC studies in the COBC for commercial drug substance to achieve the desired crystalline form to the best of our knowledge.
Atorvastatin calcium (ASC) is a statin medication primarily used as a lipid lowering agent and used to prevent cardiovascular diseases. It works by inhibiting 3-hydroxy-3-methyl glutaryl co-enzyme A (HMG-CoA) reductase, rate-limiting step that converts HMG CoA to mevalonate, a precursor in cholesterol biosynthesis.34–36 The empirical formula of ASC is [C33H35FN2O5]2⸱Ca⸱3H2O with molecular weight of 1209.42 g/mol. Atorvastatin calcium has more than 60 polymorphs and pseudo-polymorphs (hydrates and solvates)37–40 of which form I is the most stable form and is non-hygroscopic in nature.39 Crystalline ASC form I is a trihydrate. Christensen et al. investigated the effect of temperature on dehydration and melting behavior of ASC form I.41 Atorvastatin may also form unstable amorphous form depending on the crystallization conditions. Atorvastatin is prepared as the calcium salt form I since it is easier to formulate for administration purpose and has longer shelf life without any need for specialized storage conditions.42 Pfizer launched Atorvastatin calcium under the brand name Lipitor in strengths of 10, 20, 40 and 80 mg tablets in market early 1997. Pfizer’s patent on the product expired in November 2011. Since then, a number of generic pharmaceutical companies filed Abbreviated New Drug Application (ANDA) and launched the generic version of the product which made the drug relatively inexpensive. With cardiovascular diseases being the number one cause of death across world, the demand for the statin drugs is quite high,43 making it a high-volume, low-cost drug, a suitable candidate for continuous manufacturing.
ASC form I mostly obtained via batch crystallization, which has challenges in terms of low productivity and wide CSD. With near plug flow operation and efficient mixing in COBC, these challenges can be addressed by designing continuous crystallization process in COBC.22 In this paper we outline the experiments performed to convert a batch CCAC recipe into a continuous CCAC process, assisted by the use of an array of process analytical technology (PAT) tools, which was implemented in a COBC with the aim to increase productivity and obtain narrow CSD of the desired polymorph of ASC.
2. Materials and Experimental Methods
ASC was obtained from Dr. Reddy’s Laboratories (DRL) Ltd. Figure 1 a) shows the structural formula of ASC. A mixture of Isopropyl alcohol (IPA) (99.97%, Fisher Scientific) and deionized (DI) water was used as solvent and antisolvent. The desired polymorphic form (form I) seeds were also obtained from DRL.
Figure 1.

a) Molecular structure of ASC; b) PXRD of ASC form I with characteristic 2-θ peaks at 9.2°, 9.5°, 10.3°, 10.6°, 11.9°, 12.3°, 21.7°.
The seeds were sieved using an Advantech model L3P Sonic Sifter separator between the sieve size 75 and 125 μm. The polymorphic form of the product obtained from the crystallization step was analyzed using a Rigaku PXRD SmartLab X-ray diffractometer with a Cu Kα source at 1.76 W (Rigaku). Diffraction patterns were collected from 4 to 40° with a step size of 0.05° and used to identify polymorphic form of ASC from literature. Figure 1 b) shows the PXRD of ASC form I with characteristic 2-θ peaks at 9.2°, 9.5°, 10.3°, 10.6°, 11.9°, 12.3°, 21.7°, which coincided with literature observations.37 The product PXRD peaks were compared with the standard ASC form I to check if the desired polymorphic form was obtained. Malvern Mastersizer 3000 Aero S, Malvern Morphologi G3 were used to determine the size and JCP 6000 Plus SEM technology was used take images of the product crystal. The solubility of the API was measured at different temperatures and solvent compositions using a gravimetric method in a 500 mL jacketed stirred vessel.
The solvent mixtures of compositions ranging from 0.1 to 0.9 IPA:water (w/w) were prepared and held at temperatures ranging from 25 °C to 65 °C (in increments of 10 °C). ASC form I was added in excess at each temperature and solvent composition and allowed to reach equilibrium for 40–50 minutes. About three to four samples were collected from the equilibrated solution at each solvent composition and temperature point and filtered via syringe filter into pre-weighed empty weigh boats (). The filtered sample was weighed () before it was kept for drying at 65 °C for 12–14 hours. The solids that left behind in the weigh boats were weighed (). The solubility () was calculated using the formula given in equation (1). The excess solids from the slurry in the reactor at the end of 65 °C were filtered and analyzed using PXRD to confirm whether any polymorphic transformation had occurred.
| (1) |
Figure 2 shows the crystallization setup for ASC in a batch stirred crystallizer. A PT-100 temperature sensor connected to Huber ministat 125 thermoregulator was used to monitor and control the process temperature. All the temperatures mentioned in the paper are process temperatures unless otherwise mentioned that it is jacket temperature. Process analytical technology (PAT) tools, including focused beam reflectance measurement (FBRM) probe (G400, Mettler Toledo) and Particle View and Measurement (PVM) probe (ParticleView V19, Mettler Toledo) were used to monitor the process.
Figure 2.

Batch crystallizer setup with PAT tools used for the batch crystallization studies. The saturated API solution is added into seeded water via peristaltic pump in reverse antisolvent crystallization, whereas seeded water is added into saturated API solution in direct antisolvent crystallization.
Three different batch crystallization processes were implemented using different operating modes to study the effect of order of addition of AS and API solution in the batch process. First, a reverse antisolvent crystallization of ASC was performed in which a seeded (5% seed) DI water mixture was prepared in a crystallizer and maintained at 45–50 °C under stirring. A hot saturated ASC solution was prepared in a separate vessel in 0.6 IPA:water (w/w) solvent mixture at 65 °C which was added in the crystallizer containing the seeded water in 40–50 minutes via peristaltic pump and maintained at 45 °C for 60 minutes. The slurry was then cooled to 25 °C at 0.25 °C/min and then maintained at that temperature for 2 hours. In the second mode, direct antisolvent crystallization was carried out by adding antisolvent in saturated seeded API solution, followed by cooling as done in the first mode. In the third mode, the total antisolvent was split into two halves (AS-1 and AS-2). Seeded AS-1 was prepared in a jacketed vessel maintained at 65°C. The saturated API solution was added into the AS-1 solution via peristaltic pump. The remaining antisolvent AS-2 was then added in the slurry solution at 65 °C and the slurry was cooled from 65 to 25 °C at 0.25 °C/min to avoid undesired amorphous form generation. It was then maintained at 25 °C for 2 hours. The slurry obtained at the end of the three modes, were filtered via buckner funnel, followed by drying in an air tray dryer (ATD) at 65 °C for 10–12 hours. Table 1 summarizes the three batch crystallization modes and process conditions
Table 1.
Summary of batch crystallization experiments
| Batch process – 1 | Batch process – 2 | Batch process – 3 | |
|---|---|---|---|
| Mode of crystallization | Reverse AS | Direct AS | AS split into two halves, first reverse with AS-1, followed by direct AS-2 addition |
| Temperature during addition of AS/saturated API (°C) | 45 | 45 | 65 |
| Cooling rate (°C/min) | 0.25 | 0.25 | 0.1 |
| Batch time (min) | 310 | 310 | 330 |
The continuous CCAC experiments of ASC were conducted in a NiTech (United Kingdom) DN15 OBC, manufactured by Alconbury Weston Ltd. (AWL, United Kingdom), which consisted of a jacketed glass tubular structure with inner diameter of 15 mm and equally spaced baffles. Different sections of the COBC can be maintained at different temperatures by connecting it to different external heat exchanger (Huber ministat 125). The total antisolvent was split into two halves streams (AS-1 and AS-2) and fed at two different inlet points in the COBC to avoid undesired amorphous form generation and fouling due to very high local supersaturation in a narrow tube. Seeds of the desired polymorph (form I) was added in either the saturated API solution or in the AS-1 solution. The seed percentage was calculated as the ratio of the seed mass to the final anticipated product mass, which was calculated from the solubility at the initial point (saturated API solution) and the solubility at the end of the COBC. Figure 3 shows two configurations of continuous CCAC experiments with different spatial temperature profile and different seed addition modes in DN15 COBC. In the first configuration, a cooling antisolvent crystallization process was setup in which the saturated and seeded API solution was added in the second section of the COBC at 65 °C. It was cooled to 55 °C in the following section. The AS-1 and AS-2 solutions were added in section 4 and 6 respectively at 45 °C. Sections 7 and 8 were maintained at 25 °C. In second configuration, antisolvent cooling process was setup such that seeded AS-1 solution was added in the first section of the COBC, the saturated API solution was fed in section 2 and the clear AS-2 solution was fed in section 3. All inlet sections were maintained at 65 °C. The section 4 and 5 were maintained at 45°C and the sections 6 to 8 were maintained at 25°C. In both the configurations, the product was collected from section 8 and the total holdup volume of the COBC was 1250 mL. The amplitude and the frequency of oscillation was kept fixed at 10 mm and 1 Hz respectively through all the experiments.
Figure 3.

Different configurations of saturated API solution and AS inlets into DN15 along with temperature profiles: a) AS cooling configuration, and b) Cooling AS configuration.
The API solution and the two AS solutions were fed into the COBC at the rates such that the desired residence times and the desired final solvent composition was achieved. The flow rates of the API solution and the antisolvent streams were calculated as shown in equations 2 and 3.
| (2) |
| (3) |
where is the volume of each section, is the flowrate of the API solution, is the flowrate of the antisolvent stream, is the desired residence time, is the initial IPA solvent fraction and is the final IPA solvent fraction. The flowrates of the two antisolvent inlets were kept the same. Equation 2 calculates the residence time in the COBC by calculating residence time in each section and summing it up. Equation 3 calculates the final solvent concentration based on the total IPA content in the API solution against the total solution and antisolvent flowrates. The desired residence time was kept between 8 and 15 min.
Table 2 summarizes the experimental conditions of the experiments conducted in the COBC. The ratio of flowrates of the API solution and the AS stream were such that final solvent to antisolvent ratio was maintained at 0.2 IPA:water (w/w). Run 4 was repeated with a lower seed loading (from 5% to 2.5% seed) and was used as a validation experiment (run 5). Figure 4 shows the validation experiment setup with the PAT tools such as FBRMs and PVM, a six-screen control computer station to monitor the continuous AS cooling crystallization process. The saturated API solution was prepared in a 5 L vessel at 65 °C and fed into the COBC via a peristaltic pump. The tubes of the peristaltic pump were heated using heating pads set at 70 °C and insulated using glass wool to avoid API precipitation in the feeding tube. Pre-heated seeded AS-1 and clear AS-2 were fed in the COBC. An additional FBRM (S400 from Lasentec) was placed on the COBC to monitor counts of the crystal and estimate when the system reaches stead state. PVM is used in the feed and in the product vessel to monitor crystal morphology.
Table 2.
Continuous CCAC process experiments with different conditions conducted in DN15 COBC.
| Run # | Process | Step 1 | Step 2 | Seed load | F1 (mL/min) | F2 (mL/min) | (min) |
|---|---|---|---|---|---|---|---|
| 1 | Cooling AS | Cooling | AS | 5% | 48 | 28.9 | 9.7 |
| 2 | AS Cooling | AS | Cooling | 5% | 32.1 | 20.3 | 15 |
| 3 | Cooling AS | Cooling | AS | 5% | 58.3 | 36 | 8 |
| 4 | AS Cooling | AS | Cooling | 5% | 60.2 | 38 | 8 |
| 5 | AS Cooling | AS | Cooling | 2.5% | 60.2 | 38 | 8 |
Figure 4.

Experimental setup for the validation experiment run in DN15 COBC.
The productivity () of batch and continuous crystallization was calculated using formula given in equation (4)
| (4) |
where is the amount of ASC form I produced in Batch process-1 and in continuous run 5. is batch processing time in case of batch process and residence time in case of continuous process. is the total slurry volume in case of batch process and total hold up volume in case of continuous process.
3. Results and Discussions
The solubility of ASC was found to increase with increase in IPA content in the solvent mixture until 0.6 IPA:water (w/w) ratio and beyond that ratio the solubility dropped rapidly. Figure 5 shows the solubility of ASC across 0 to 0.9 IPA:water (w/w) solvent compositions at different temperatures. The PXRD analysis of the solids obtained from the slurry at different IPA:water ratios showed that form I remained unchanged. As the desired polymorphic form, form I is a trihydrate, higher water content was desired at the end of the process. Thus, the left half of the solubility diagram was the desired region of operation. The desired solubility () region was identified, and a semi-empirical equation (expressed in g/ g solvent), Eq. (5) was used to fit to the data.
| (5) |
where , b, c and d are solubility constants, is temperature in °C and is the IPA mass fraction in the solvent mixture. The solubility constants were found using the curvefit tool (cftool) in Matlab 2017b and are listed in Table 3. Figure 6 shows the experimental and model predicted solubility of ASC form I with respect to temperaure at different solvent compositions in the desired region of the solubility map.
Figure 5.

Experimental solubility of ASC form I at different temperatures and solvent compositions.
Table 3.
Solubility parameters of ASC with 95% confidence intervals.
| Parameters | Value | 95% confidence interval |
|---|---|---|
| −79.01 | (−82.02, −75.99) | |
| 15.72 | (15.28, 16.17) | |
| 37.08 | (34.24, 39.92) | |
| −20.73 | (−22.47, −18.98) |
Figure 6.

Solubility of ASC form I at different temperatures and between 0.2 to 0.6 IPA:water raito. Experimental data and solubility model prediction
The polymorphic outcome of the batch crystallization processes was found via PXRD. Batch process-1 and Batch process-3 yielded the desired polymorph, form I, whereas Batch process-2 yielded an undesired polymorph. The undesired polymorph was formed in Batch process-2 may be due to the competing effects of dilution and decrease in solubility upon addition of poor solvent, under certain conditions dilution may prevail and can lead to some dissolution of seed. In the absence of enough form I seed, the undesired polymorph was nucleated. Whereas in Batch process-1 and Batch process-3, the seed remained undissolved in solvent-antisolvent mixture even with the addition of saturated API solution. Although very high supersaturation is created in these modes, the presence of the seeds favors crystallization of the desired form.
In case of continuous crystallization, the direct or reverse AS crystallization modes are similar as the two streams mix in the COBC tubes irrespective of which is added first. However, the ratio of IPA:water at the point of mixing of saturated API in COBC might have an impact on the polymorphic outcome. Addition of the total AS ( F2) into the COBC at a single point was found to cause fouling in the COBC at the addition point and bends. This was due to high water: IPA ratio at the point of mixing of saturated API and AS in the COBC that caused rapid desaturation in a very small region compared to that in the batch reactor. Hence, the antisolvent was split into two halves, AS-1 and AS-2 (F1 each) and fed in the COBC at different inlet points in the COBC. In AS cooling mode, AS-1 was added in the first section of the COBC and AS-2 was added in the 3/8th section of the total length of COBC. In cooling AS mode, AS-1 was added in the half of the total length of the COBC and AS-2 was added in 3/4th section of the total length of the COBC. Table 4 shows the results of continuous CCAC experimental runs in the COBC. Cooling followed by AS addition yielded the amorphous form, whereas the AS cooling process yielded the desired form I even at lower seed loading (run 5). Thus, the order of cooling and AS addition had an impact on the polymorphic outcome.
Table 4.
Continuous CCAC experiment runs results
| Run # | Process | Seed load | F1 (mL/min) | F2 (mL/min) | F1/F2 | (min) | Polymorph |
|---|---|---|---|---|---|---|---|
| 1 | Cooling AS | 5% | 48 | 28.9 | 1.7 | 9.7 | Amorphous |
| 2 | AS Cooling | 5% | 32.1 | 20.3 | 1.6 | 15 | form I |
| 3 | Cooling AS | 5% | 58.3 | 36 | 1.6 | 8 | Amorphous |
| 4 | AS Cooling | 5% | 60.2 | 38 | 1.6 | 8 | form I |
| 5 | AS Cooling | 2.5% | 60.2 | 38 | 1.6 | 8 | form I |
Figure 7 shows the concentration mapping for both the processes in COBC on the solubility plot. The dashed green arrows indicate change in concentration in cooling AS process and the solid pink arrows indicate change in concentration in AS cooling process. In cooling AS process, the initial supersaturation is very high which results in the undesired amorphous form, whereas in the AS cooling process relatively lower initial supersaturation is generated which results in the desired form I in presences of even small quantities of seed crystal. The validation experiment (run 5) used the AS cooling process with half the seed loading (2.5%) yielded the desired form, form I. Figure 8 shows the total particle counts of the crystals in the COBC reached steady state around two residence times. Steady state was determined by calculating mean counts/s on a moving average window of ten measurements and when variation was less than 5%.
Figure 7.

Change in concentration in AS cooling process (dashed green arrows) and cooling AS process (solid pink arrows) on the ASC form I solubility plot. Pink arrow indicates change in concentration in cooling AS process, whereas the green arrow indicates change in concentration in AS cooling process.
Figure 8.

Plot of total counts with respect to time obtained from FBRM on the COBC.
Figure 9 shows the PVM images of (a) the seed crystals and the product from (b) Batch process-1 and (c) COBC validation run 5. The product crystals in the batch process can be seen to contain fines as well as agglomerates, whereas the product crystals from the COBC validation run can be seen to form agglomerates. The crystal size distribution (CSD) was characterized using Malvern Morphologi G3. Figure 10 shows the CSD of the product particles obtained from the reverse AS batch crystallization process and continuous crystallization validation run 5. The batch process product had a bimodal distribution, whereas the continuous process yielded a unimodal and a narrower CSD compared to that of the batch process. This can be explained from the SEM images of the product from both batch and continuous processes. Figure 11 a) shows the SEM image of the particles obtained from reverse AS batch process which has fines and aggregates. Figure 11 b) and c) shows the SEM images of the product obtained from the COBC run 4 and validation run 5 respectively. The product from COBC runs had mostly uniform aggregates of needle shaped crystals. Narrow CSD is desired compared to wide CSD as it provides faster filtration and isolation.
Figure 9.
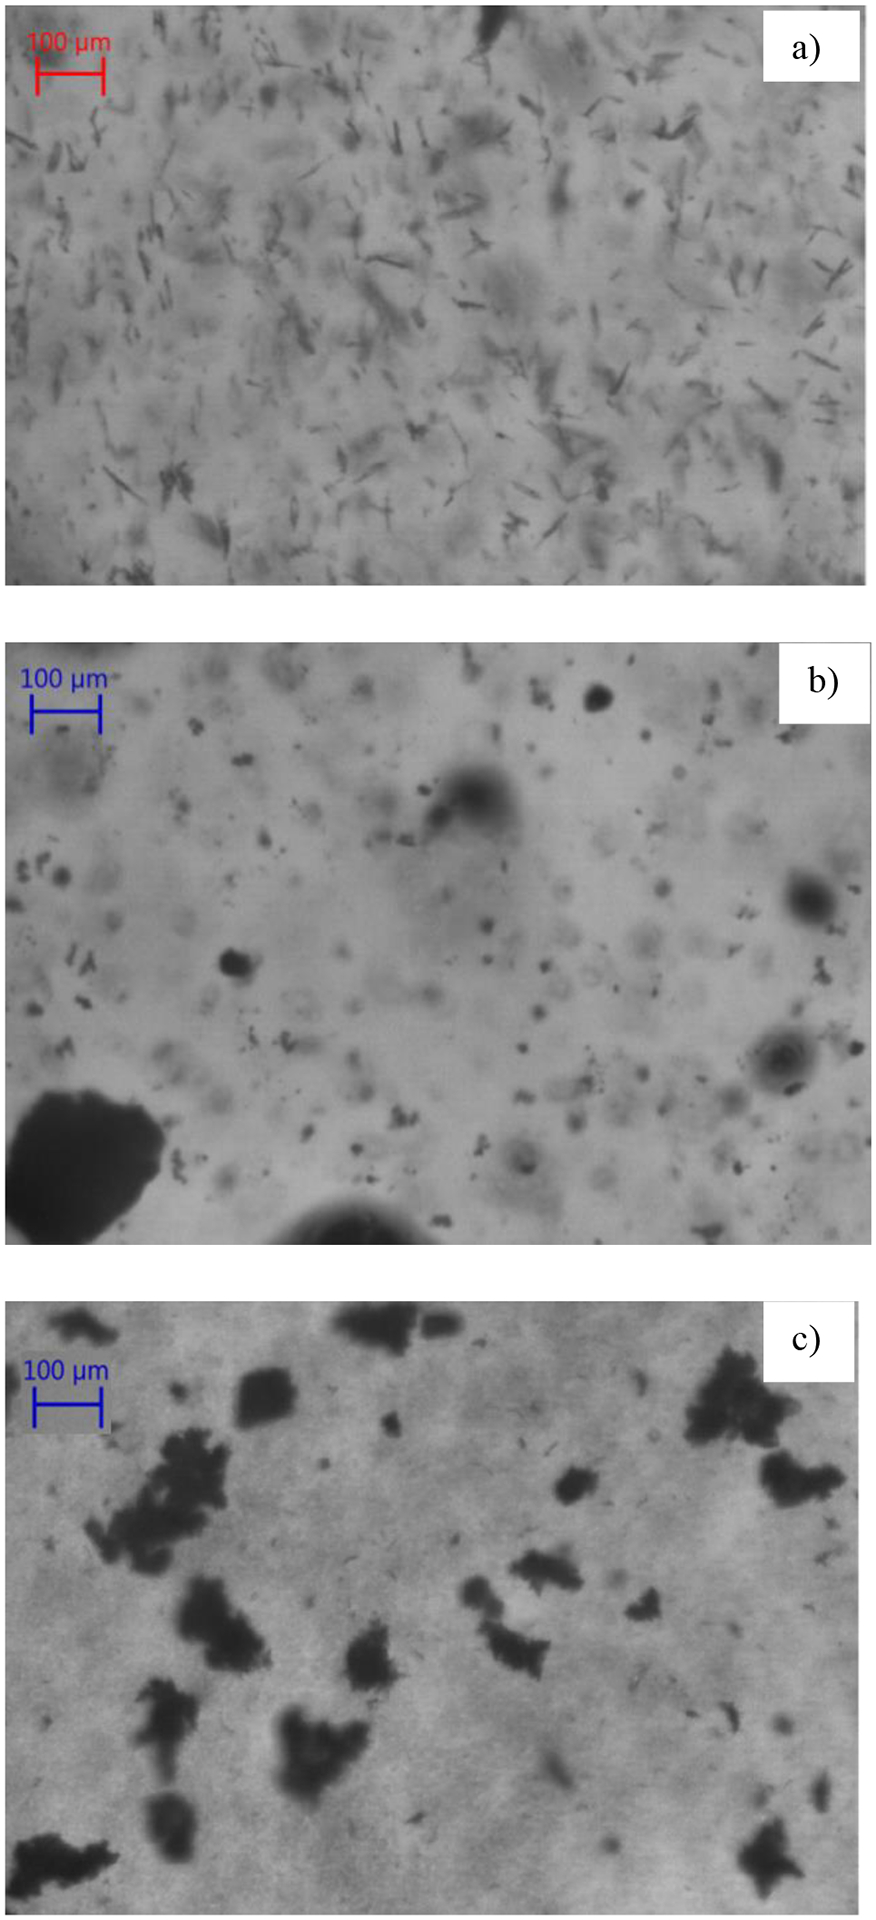
PVM images of the (a) seed crystal, (b) product crystal obtained from Batch process-1, (c) product crystal obtained from in the COBC in validation run 5.
Figure 10.
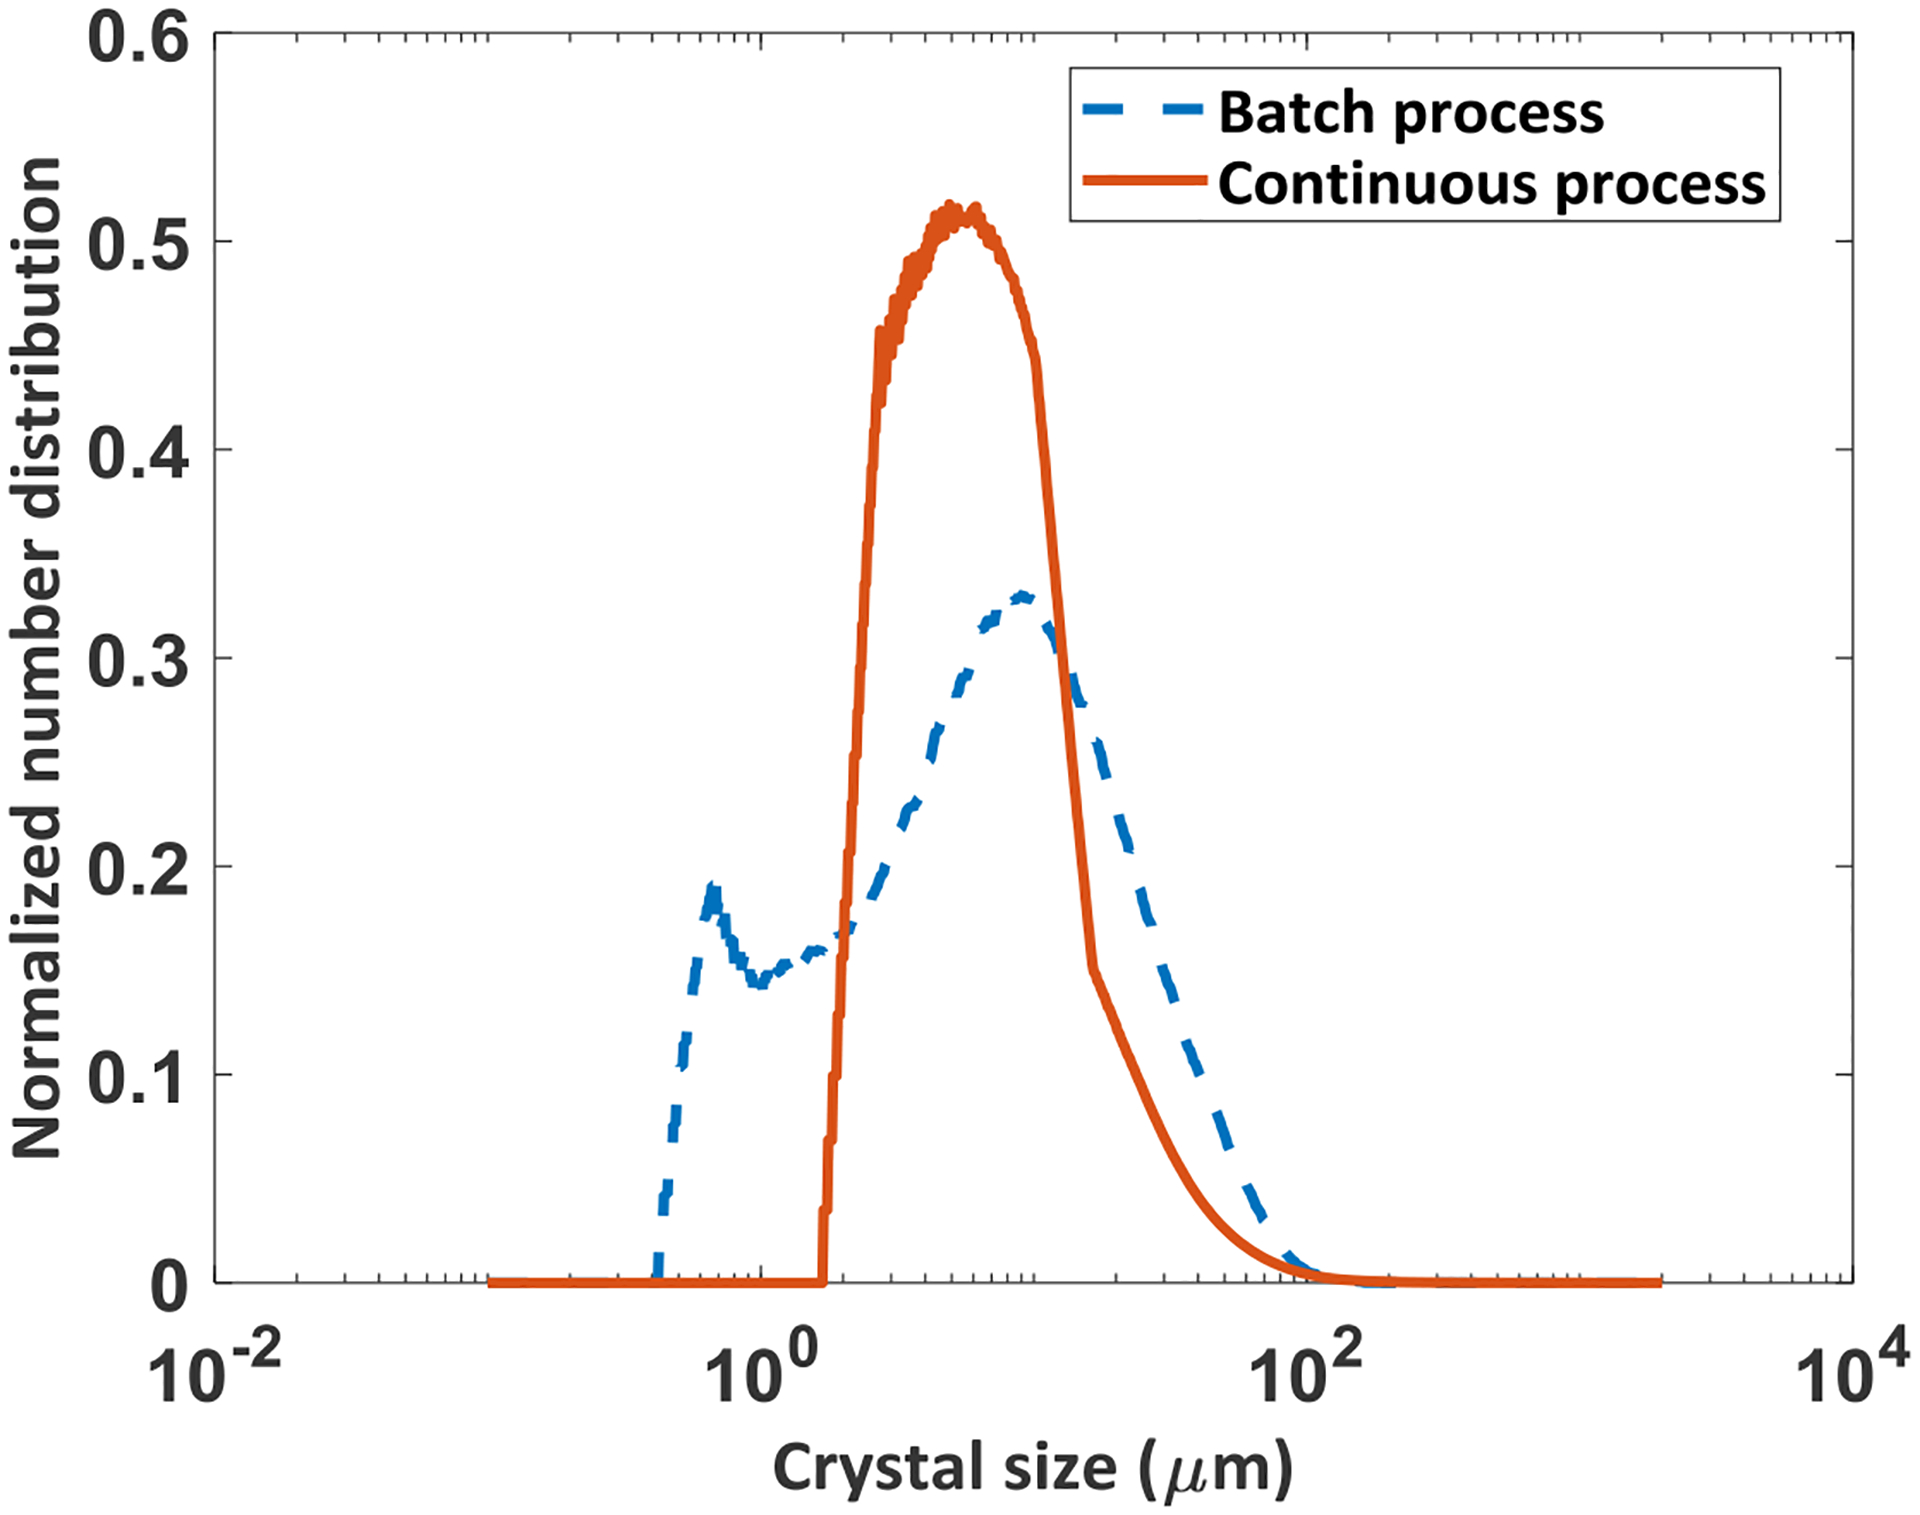
Normalized particle size distribution of the products obtained in Batch process–1 and in continuous crystallization run 5 in COBC.
Figure 11.
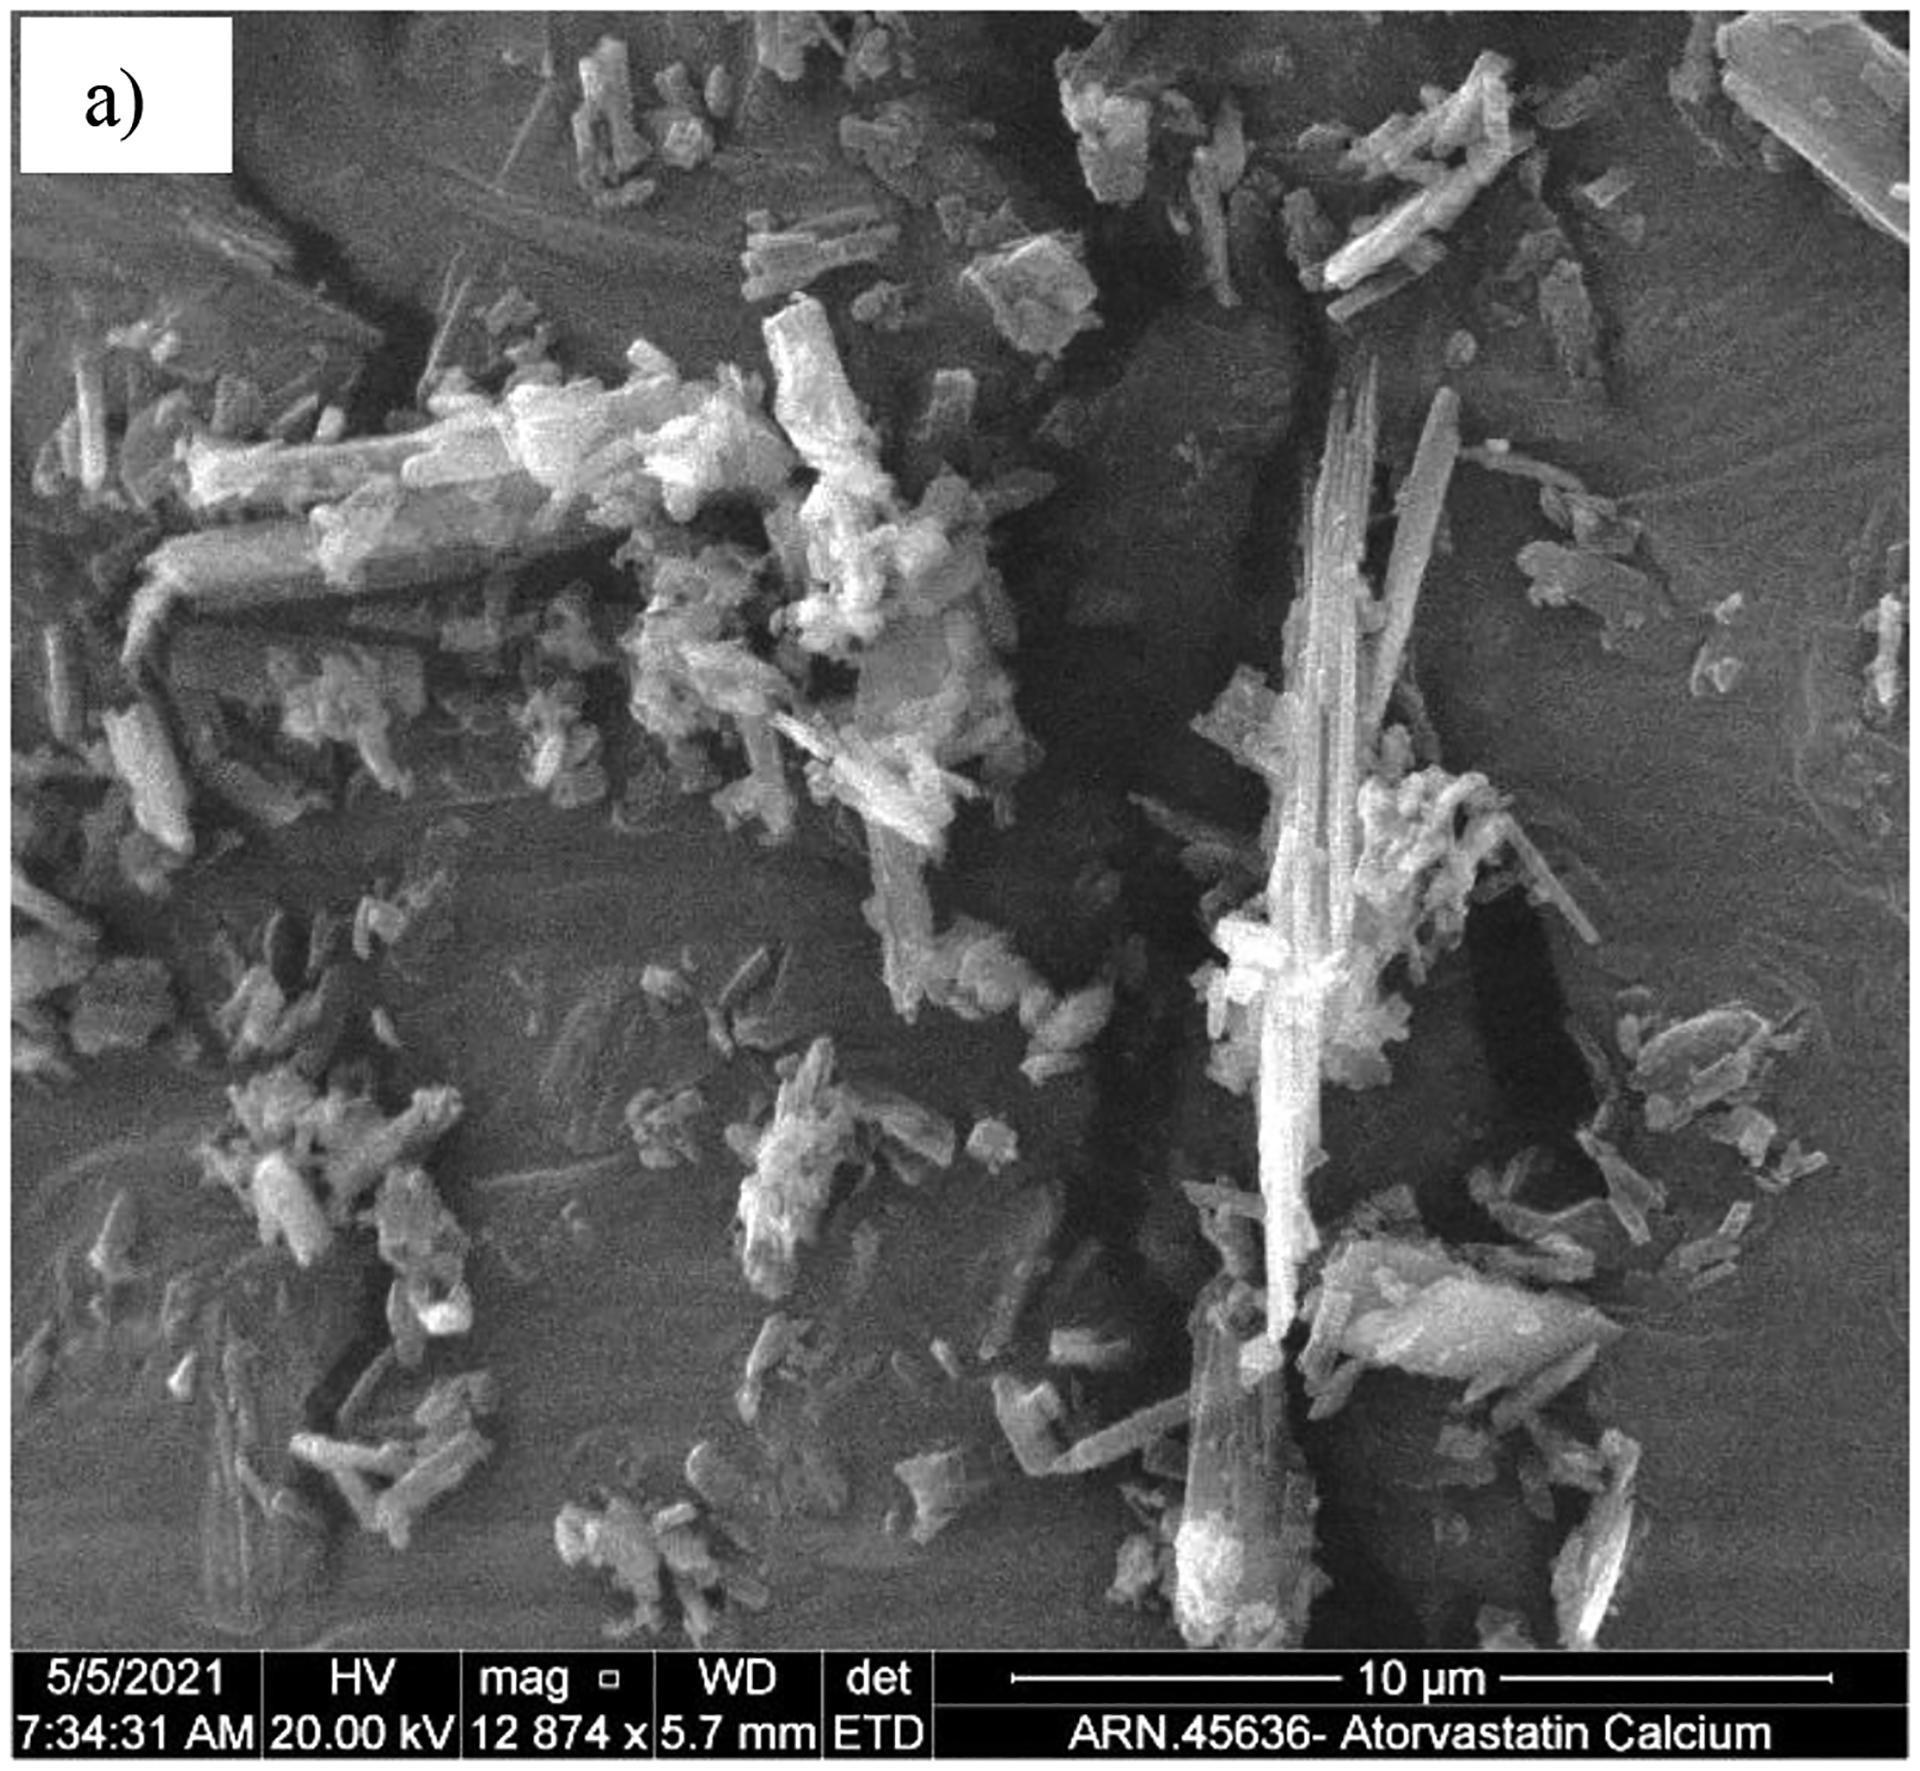

SEM images of the product crystals resulted from the continuous combined cooling and antisolvent experiments in the: a) Batch process-1, b) COBC run 4, b) COBC validation run 5.
All the batch crystallization experiments took about 320 min (Batch process – 1 and 2 took 310 min, whereas Batch process – 3 took about 330 min). Only Batch process 1 & 3 yielded the desired polymorphic form, form I, but it resulted in a broad CSD crystals. Whereas in the continuous validation run (run 5), the processing time was only 8 minutes, due enhanced heat and mass transfer rates in the COBC. The cycle time reduction in the continuous process via COBC was significant compared to the batch process. Table 5 shows the comparison of productivities between batch and continuous processes. About 20 g of product was obtained in Batch process-1 whereas about 66 g of product was obtained in the COBC run 5. For comparison purpose, the 2 hours maintenance time at 25 °C in the Batch process-1 was not considered (since the decrease in yield is relatively small and overall leads to higher productivity), but the cooling rate was used as-is, as the faster cooling rate did not yield the desired form I. The continuous process was found to be about 30-fold more productive than the batch process. The batch process took about 22 hours to produce 100 g of the desired polymorph of ASC as against 12 minutes in the COBC. While neither the batch nor the continuous processes were fully optimized the results show that at least an order of magnitude productivity increase is achievable using the continuous process compared to the batch crystallization. These results demonstrate the great potential of using the continuous oscillatory flow crystallization as a process intensification approach to increase productivity and product quality in terms of more uniform particles.
Table 5.
Productivity comparison between batch and continuous crystallization.
| Batch process | Continuous process | |
|---|---|---|
| (g) | 20 | 66 |
| (L) | 0.5 | 1.25 |
| (h) | 3 | 0.13 |
| Productivity (g/h/L) | 13.33 | 396 |
4. Conclusions
This paper provides an example of process intensification that can be achieved by converting batch crystallization to a continuous crystallization process in a continuous oscillatory baffled crystallizer (COBC), in the manufacturing of a commercial active pharmaceutical ingredient (API), atorvastatin calcium (ASC). Crude ASC is purified via combined cooling and antisolvent crystallization (CCAC) process. Three modes of batch crystallization processes were tested, Batch process-1, Batch process-2 and Batch process-3 in which either the antisolvent (AS) was added in the saturated API solution or vice a verse and the order cooling and AS crystallization were varied. It was found that Batch process-1 and Batch process-3 gave the desired polymorphic form, whereas Batch process-2 did not yield the desired polymorph, which was due to rapid seed depletion in the later process. A COBC was used to address the problem of wide crystal size distribution (CSD) and improve productivity of ASC crystallization process. In the COBC, the IPA:water ratios at the point of contact of saturated API solution and seeded antisolvent in the COBC was found to be critical in terms of operation of the COBC and polymorphic outcome. The antisolvent splitting was found to be helpful in avoiding very high local supersaturation that could foul the narrow tubes of the COBC and additionally helped in avoiding amorphous form generation. Two modes of CCAC were tested in the COBC based on the order of cooling and antisolvent crystallization and it was found that the desired polymorph was obtained consistently via AS cooling process even at low seed loading in OBC, whereas the cooling AS process in COBC resulted in the undesirable amorphous form. This phenomenon was explained via concentration map on the solubility plot. The crystals obtained via continuous crystallization in the COBC had narrower crystal size distribution (CSD) compared to that obtained in the Batch process-1. Due to enhanced micro-mixing and increased heat transfer characteristics of the COBC, the continuous process was found to be 30-fold more productive compared to the batch process. The cycle time for obtaining 100 g of ASC form I reduced from 22 hours in the batch process to 12 minutes in the COBC. As the COBC is made up of multiple similar sections and it offers different temperature profiles and spatial distribution of antisolvent addition, further model-based optimization is possible to identify spatial temperature profiles, number of antisolvent splits, the ratio of the splits and residence time to tailor crystal quality.
Acknowledgements
Funding for this publication was made possible, in part, by the Food & Drug Administration through grant (U01FD006738). Views expressed in written materials or publications and by speakers and moderators do not necessarily reflect the official policies of the Department of Health and Human Services; nor does any mention of trade names, commercial practices, or organization imply endorsement by the United States Government. Partial financial support from Dr. Reddy’s Laboratories Ltd. (DRL) is gratefully acknowledged. DRL publication number IPDO-IPM-00671.
Abbreviations
- API
active pharmaceutical ingredient
- AS
antisolvent
- ASC
atorvastatin calcium
- CCAC
combined cooling and antisolvent crystallization
- COBC
continuous oscillatory baffled crystallizer
- CSD
crystal size distribution
- FBRM
Focused beam reflectance measurement
- FDA
Food and Drug Administration
- IPA
isopropyl alcohol
- MSMPR
mixed suspension mixed product removal
- OFR
oscillatory flow reactor
- OBC
oscillatory baffled crystallizer
- PAT
Process Analytical Technology
- PVM
particle vision and measurement
- PXRD
power x-ray diffraction
References
- 1.McKenzie P; Kiang S; Tom J; Rubin AE; Futran M Can Pharmaceutical Process Development Become High Tech?. AIChE J. 2006. 52, 3990–3994. https://doi-org.ezproxy.lib.purdue.edu/10.1002/aic.11022. [Google Scholar]
- 2.Plumb K Continuous processing in the pharmaceutical industry: Changing the mindset. Chem. Eng. Res. Des 2005. 83, 730–738. 10.1205/cherd.04359. [DOI] [Google Scholar]
- 3.Lee SL; O’Connor TF; Yang X; Cruz CN; Chatterjee S; Madurawe RD; Moore CMV; Yu L,X; Woodcock J Modernizing Pharmaceutical Manufacturing: from Batch to Continuous Production. Journal of Pharmaceutical Innovation. 2015. 10, 191–199. https://doi-org.ezproxy.lib.purdue.edu/10.1007/s12247-015-9215-8. [Google Scholar]
- 4.Poechlauer P; Manley J; Broxterman R; Gregertsen B; Ridemark M Continuous Processing in the Manufacture of Active Pharmaceutical Ingredients and Finished Dosage Forms: An Industry Perspective. Org. Process Res. Dev 2012, 16, 1586 – 1590. https://doi-org.ezproxy.lib.purdue.edu/10.1021/op300159y. [Google Scholar]
- 5.U.S. Food and Drug Administration Center for Drug Evaluation and Research (CDER). Quality Considerations for Continuous Manufacturing. Guidance for Industry. Draft Guidance 2019. https://www.fda.gov/media/121314/download.
- 6.Chen J; Sarma B; Evans JMB; Myerson AS Pharmaceutical Crystallization. Cryst. Growth Des 2011, 11, 4, 887–895. https://doi-org.ezproxy.lib.purdue.edu/10.1021/cg101556s. [Google Scholar]
- 7.Nagy ZK; Braatz RD Advances and New Directions in Crystallization Control. Annu. Rev. Chem. Biomol. Eng. 2012, 3, 55–75. https://doi-org.ezproxy.lib.purdue.edu/10.1146/annurev-chembioeng-062011-081043. [DOI] [PubMed] [Google Scholar]
- 8.Saleemi AN; Rielly CD; Nagy ZK Comparative investigation of supersaturation and automated direct nucleation control of crystal size distributions using ATR-UV/vis spectroscopy and FBRM. Cryst. Growth Des 2012, 12, 1792–1807. https://doi-org.ezproxy.lib.purdue.edu/10.1021/cg201269c. [Google Scholar]
- 9.Nagy ZK; Fevotte G; Kramer H; Simon LL Recent advances in the monitoring, modelling and control of crystallization systems. Chem. Eng. Res. Des 2013, 91, 1903–1922. 10.1016/j.cherd.2013.07.018. [DOI] [Google Scholar]
- 10.Yang Y; Nagy ZK Model-based systematic design and analysis approach for unseeded combined cooling and antisolvent crystallization (CCAC) systems. Cryst. Growth Des 2014, 14, 687–698. https://doi-org.ezproxy.lib.purdue.edu/10.1021/cg401562t. [Google Scholar]
- 11.Cao Y; Acevedo D; Nagy ZK; Laird CD Real-time feasible multi-objective optimization based nonlinear model predictive control of particle size and shape in a batch crystallization process. Control Eng. Pract 2017, 69, 1–8. 10.1016/j.conengprac.2017.08.008. [DOI] [Google Scholar]
- 12.Simone E; Klapwijk AR; Wilson CC; Nagy ZK Investigation of the Evolution of Crystal Size and Shape during Temperature Cycling and in the Presence of a Polymeric Additive Using Combined Process Analytical Technologies. Cryst. Growth Des 2017, 17, 1695–1706. https://doi-org.ezproxy.lib.purdue.edu/10.1021/acs.cgd.6b01683. [DOI] [PMC free article] [PubMed] [Google Scholar]
- 13.Yang Y; Kanjakha P; Koswara A; Sun QQ; Zhang YQ; Quon J; McKeown R; Goss C; Nagy ZK Application of feedback control and in situ milling to improve particle size and shape in the crystallization of a slow growing needle-like active pharmaceutical ingredient. Int. J. Pharm 2017, 533, 49–61. 10.1016/j.ijpharm.2017.09.050. [DOI] [PubMed] [Google Scholar]
- 14.Peña R; Burcham CL; Jarmer DJ; Ramkrishna D; Nagy ZK Modeling and optimization of spherical agglomeration in suspension through a coupled population balance model. Chem. Eng. Sci 2017, 167, 66–77. 10.1016/j.ces.2017.03.055. [DOI] [Google Scholar]
- 15.Hu Y; Liang JK; Myerson AS; Taylor LS Crystallization Monitoring by Raman Spectroscopy: Simultaneous Measurement of Desupersaturation Profile and Polymorphic Form in Flufenamic Acid Systems. Ind. Eng. Chem. Res 2005, 44, 5, 1233–1240. https://doi-org.ezproxy.lib.purdue.edu/10.1021/ie049745u. [Google Scholar]
- 16.Wood B; Girard K; Polster C; Croker DM Progress to date in the design and operation of continuous crystallization processes for pharmaceutical applications. Org. Process Res. Dev 2019, 23, 2, 122–144. https://doi-org.ezproxy.lib.purdue.edu/10.1021/acs.oprd.8b00319. [Google Scholar]
- 17.Zhang D; Xu S; Du S; Wang J; Gong J Progress of Pharmaceutical Continuous Crystallization. Engineering. 2017, 3 (3), 354–364. 10.1016/J.ENG.2017.03.023. [DOI] [Google Scholar]
- 18.Randolph AD; White ET Modeling size dispersion in the prediction of crystal-size distribution. Chem. Eng. Sci 1977, 32(9), 1067–1076. [Google Scholar]
- 19.Chew CM; Ristic RI; Dennehy RD; De Yoreo JJ Crystallization of paracetamol under oscillatory flow mixing conditions. Cryst. Growth Des 2004, 4(5), 1045–1052. https://doi-org.ezproxy.lib.purdue.edu/10.1021/cg049913l. [Google Scholar]
- 20.Ristic RI Oscillatory mixing for crystallization of high crystal perfection pharmaceuticals. Chem. Eng. Res. Des 2007, 85(7), 937–944. 10.1205/cherd06235. [DOI] [Google Scholar]
- 21.Lawton S; Steele G; Shering P; Zhao L; Laird I; Ni XW Continuous Crystallization of Pharmaceuticals Using a Continuous Oscillatory Baffled Crystallizer. Org. Process Res. Dev 2009, 13, 6, 1357–1363. https://doi-org.ezproxy.lib.purdue.edu/10.1021/op900237x. [Google Scholar]
- 22.Ni XW; Liao A Effects of mixing, seeding, material of baffles and final temperature on solution crystallization of L-glutamic acid in an oscillatory baffled crystallizer. Chem. Eng. J 2010, 156(1), 226–233. 10.1016/j.cej.2009.10.045. [DOI] [Google Scholar]
- 23.Ni XW; Liao A Effects of cooling rate and solution concentration on solution crystallization of L-glutamic acid in an oscillatory baffled crystallizer. Cryst. Growth Des 2008, 8(8), 2875–2881. https://doi-org.ezproxy.lib.purdue.edu/10.1021/cg7012039. [Google Scholar]
- 24.Ni XW; Valentine A; Liao A; Sermage SB; Thomson GB; Roberts KJ On the crystal polymorphic forms of L-glutamic acid following temperature programmed crystallization in a batch oscillatory baffled crystallizer. Cryst. Growth Des 2004, 4(6), 1129–1135. https://doi-org.ezproxy.lib.purdue.edu/10.1021/cg049827l. [Google Scholar]
- 25.Briggs NEB; Schacht U; Raval V; McGlone T; Sefcik J; Florence AJ Seeded Crystallization of β- L -Glutamic Acid in a Continuous Oscillatory Baffled Crystallizer. Org. Process Res. Dev 2015, 19(12), 1903–1911. https://doi-org.ezproxy.lib.purdue.edu/10.1021/acs.oprd.5b00206. [Google Scholar]
- 26.Brown CJ; Adelakun JA; Ni XW Characterization and modelling of antisolvent crystallization of salicylic acid in a continuous oscillatory baffled crystallizer. Chem. Eng. Processing: Process Intensification 2015, 97, 180–186. 10.1016/j.cep.2015.04.012. [DOI] [Google Scholar]
- 27.Velaga JR; Gupta S; Venkatachalam M; Jawlekar S; Ramakrishnan S; Susarla NLR; Budhdev RR; Bandichhor R; Sardar MY; Gnanaprakasam J; G RV Process for Continuous Manufacture of Statins. WO2021105934A1, 2021.
- 28.Alvarez AJ; Myerson AS Continuous Plug Flow Crystallization of Pharmaceutical Compounds. Cryst. Growth Des 2010, 10, 2219–2228. 10.1021/cg901496s. [DOI] [Google Scholar]
- 29.Ridder BJ; Majumder A; Nagy ZK Population Balance Model-Based Multiobjective Optimization of a Multisegment Multiaddition (MSMA) Continuous Plug-Flow Antisolvent Crystallizer. Ind. Eng. Chem. Res 2014, 53, 11, 4387–4397. https://doi-org.ezproxy.lib.purdue.edu/10.1021/ie402806n. [Google Scholar]
- 30.Su Q; Benyahia B; Nagy ZK; Rielly CD Mathematical Modeling, Design, and Optimization of a Multisegment Multiaddition Plug-Flow Crystallizer for Antisolvent Crystallizations. Org. Process Res. Dev 2015, 19, 12, 1859–1870. https://doi-org.ezproxy.lib.purdue.edu/10.1021/acs.oprd.5b00110. [Google Scholar]
- 31.Nagy ZK; Fujiwara M; Braatz RD Modelling and control of combined cooling and antisolvent crystallization processes. J. Pro. Control 2008, 18, 856–864. 10.1016/j.jprocont.2008.06.002 [DOI] [Google Scholar]
- 32.Szilagyi B; Pal K; Tabar IB; Nagy ZK A novel robust digital design of a network of industrial continuous cooling crystallizers of dextrose monohydrate: From laboratory experiments to industrial application. Ind. Eng. Chem. Res 2020, 59(51), 22231–22246. 10.1021/acs.iecr.0c04870. [DOI] [Google Scholar]
- 33.Wu WL; Oliva JA; Kshirsagar S; Burcham CL; Nagy ZK Continuous in Situ Seed Generation through the Integration of a Mixed Suspension Mixed Product Removal and an Oscillatory Baffled Crystallizer for the Control of Crystal Size Distribution and Polymorphic Form. Cryst. Growth Des 2021. 21(12), 6684–6696. 10.1021/acs.cgd.1c00301. [DOI] [Google Scholar]
- 34.Graul A; Castaner J; Atorvastatin calcium. Drugs of the Future. 1997, 22, 9, 956–68. [Google Scholar]
- 35.Roth BD; Blankey CJ; Chucholowski AW; Ferguson E; Hoefle ML; Ortwine DF; Newton RS; Sekerke CS; Sliskovic DR; Stratton CD; Wilson MW Inhibitors of cholesterol biosynthesis. J. Med. Chem 1957, 34, 357–366. 10.1111/j.1753-4887.1957.tb00417.x. [DOI] [PubMed] [Google Scholar]
- 36.Kathawala FG HMG-CoA reductase inhibitors: An exciting development in the treatment of hyperlipoproteinemia. Med. Res. Rev 1991, 11, 121–146. 10.1111/j.1753-4887.1957.tb00417.x. [DOI] [PubMed] [Google Scholar]
- 37.Briggs CA; Wade RA; Ichikawa S; Nakagawa S; Crystalline [R-(R*,R*)]2-(4-Fluorophynyl)-β-δ-dihydroxy-5-(1-methylethyl)-3-phenyl-4-[(phenylamino)carbonyl)-1H-pyrrole-1-heptanoic acid hemi calcium salt (Atorvastatin), WO97/03959, World Intellectual Property Org., International Bureau, 1997. [Google Scholar]
- 38.McKenzie AT Form III crystalline (R-(R*,R*)-2-(4-fluorophenyl)-betadelta- dihydroxy-5-(1-methyl-ethyl)-3-phenyl-4-((phenylamino)carbonyl)-1Hpyrrole-1-heptanoic acid hemi calcium salt (atorvastatin), WO 9703958, 1997.
- 39.Ayalon A; Levinger M; Roytblat S; Niddam V; Lifshitz R; Aronhime J; Polymorphic form of atorvastatin calcium, WO 01036384, 2001.
- 40.Aronhime J; Lidor-Hadas R; Niddam-Hildesheim V; Lifshitz-Liron R; Kovalevski-Ishai E; Samburski G Novel crystal forms of atorvastatin hemicalcium and processes for their preparation as well as novel processes for preparing other forms, WO 02043732, 2002.
- 41.Christensen NPA; Van Eerdenbrugh B; Kwok K; Taylor LS; Bond AD; Rades T; Cornett C Rapid insight into heating-induced phase transformations in the solid state of the calcium salt of atorvastatin using multivariate data analysis. Pharmaceutical Research. 2012. 30(3), 826–835. 10.1007/s11095-012-0923-1. [DOI] [PubMed] [Google Scholar]
- 42.Suri S; Singh J; Grewal MS; Raj B Atorvastatin calcium form IV or hydrates thereof., US 2006/0122403, 2006.
- 43.Global Burden of Disease Collaborative Network. Global Burden of Disease Study 2017 (GBD 2017) Results. Seattle, United States: Institute for Health Metrics and Evaluation (IHME), 2018. [Google Scholar]