ABSTRACT
Aims/Introduction
This study investigated the roles of voltage‐dependent anion channel 1‐related differentially expressed genes (VRDEGs) in diabetic nephropathy (DN).
Materials and Methods
We downloaded two datasets from patients with DN, namely, GSE30122 and GSE30529, from the Gene Expression Omnibus database. VRDEGs associated with DN were obtained from the intersection of voltage‐dependent anion channel 1‐related genes from the GeneCards database, and differentially expressed genes were screened according to group (DN/healthy) in the two datasets. The enriched pathways of the VRDEGs were analyzed. Hub genes were selected using a protein–protein interaction network, and their predictive value was verified through receiver operating characteristic curve analysis. The CIBERSORTx software examined hub genes and immune cell infiltration associations. The protein expression of hub genes was verified through immunohistochemistry in 16‐week‐old db/db mice for experimentation as a model of type 2 DN. Finally, potential drugs targeting hub genes that inhibit DN development were identified.
Results
A total of 57 VRDEGs were identified. The two datasets showed high expression of the PI3K, Notch, transforming growth factor‐β, interleukin‐10 and interleukin‐17 pathways in DN. Five hub genes (ITGAM, B2M, LYZ, C3 and CASP1) associated with DN were identified and verified. Immunohistochemistry showed that the five hub genes were highly expressed in db/db mice, compared with db/m mice. The infiltration of immune cells was significantly correlated with the five hub genes.
Conclusions
Five hub genes were significantly correlated with immune cell infiltration and might be crucial to DN development. This study provides insight into the mechanisms involved in the pathogenesis of DN.
Keywords: Bioinformatics, Biomarkers, Diabetic nephropathy
This study aimed to identify voltage‐dependent anion channel 1‐related genes and investigate their role in immune cell infiltration in diabetic nephropathy. We identified and verified five hub genes (ITGAM, B2M, LYZ, C3 and CASP1) that were significantly associated with diabetic nephropathy and correlated with immune cell infiltration.
INTRODUCTION
Diabetic nephropathy (DN), a serious and common diabetes complication, is the principal cause of end‐stage renal disease in the USA 1 . In 2019, >400 million people had diabetes, and its prevalence has increased 2 . Furthermore, approximately 40% of patients with diabetes develop DN 3 . Therefore, recent research has focused on DN prevention and treatment. Current studies suggest that increased oxidative stress, inflammation, immune responses, autophagy, genetics and other factors cause DN 3 . The complex and multifactorial pathogenesis of DN has prevented breakthroughs in establishing prevention and treatment strategies. Therefore, determining the pathogenesis of DN, and identifying its diagnostic markers and treatment targets is crucial.
Recently, mitochondria have been implicated in metabolism, immunity, apoptosis, cell homeostasis and other biological processes. In particular, DN is caused by mitochondrial dysfunction 4 , 5 . Voltage‐dependent anion channel 1 (VDAC1) is a mitochondrial membrane transporter that participates in the crosstalk between energy and metabolism 6 , 7 . VDAC1 is also a key mitochondrial apoptosis factor and interacts with >100 proteins 8 , and its overexpression or oligomerization is involved in the pathogenesis of type 2 diabetes 8 , 9 , cancer 10 , 11 , inflammatory bowel disease 12 , lupus 13 and cardiac diseases 14 , 15 through mitochondrial dysfunction. However, the role of VDAC1 in renal injury is poorly understood. VDAC1 phosphorylation causes mitochondrial dysfunction and cell apoptosis through phosphorylation in acute kidney injury 16 . Furthermore, the relationship between the multifunctional protein VDAC1 and DN is unknown. Therefore, the purpose of the present study was to use bioanalysis to investigate the role and potential mechanisms of VDAC1 in the pathogenesis of DN, for aiding in determination of DN prevention and treatment strategies.
MATERIALS AND METHODS
Data source and preprocessing
GSE30122 17 and GSE30529 17 datasets from patients with DN were acquired from the Gene Expression Omnibus 18 database by using the “GEOquery (Version 2.68.0, http://seandavi.github.io/GEOquery)” 19 package. The GSE30122 dataset included data from 50 healthy controls and 19 patients with DN, whereas the GSE30529 dataset included data from 12 healthy controls and 10 patients with DN. Both datasets were analyzed using the GPL571 (HG‐U133A_2) Affymetrix Human Genome U133A 2.0 Array (Santa Clara, CA, USA). The details of the two datasets are presented in Table 1.
Table 1.
Diabetic nephropathy datasets information list
| GSE30122 | GSE30529 | |
|---|---|---|
| Platform | GPL571 | GPL571 |
| Species | Homo sapiens | Homo sapiens |
| Tissue | Kidney | Kidney |
| Samples in normal group | 50 | 12 |
| Samples in DN group | 19 | 10 |
DN, diabetic nephropathy.
VDAC1‐related genes (VRGs) were obtained from the GeneCards database 20 using the search keyword “VDAC1,” and 5,747 VRGs were obtained. “VDAC1” was also used as a search keyword to obtain 847 VRGs from the Molecular Signatures Database 21 . After merging and de‐duplication, 6,299 VRGs were obtained.
Differentially expressed gene screening
Differentially expressed genes (DEGs) in cases with and without DN from the GSE30122 and GSE30529 datasets were screened using the “Limma” package. DEGs with a log fold change >1 and a P‐value <0.05 were defined as upregulated genes. Concurrently, DEGs satisfying log fold change <−1 and P < 0.05 were defined as downregulated genes.
To identify VDAC1‐related differentially expressed genes (VRDEGs) associated with DN, the common DEGs (co‐DEGs) of the DN data and VRG sets were intersected, and a Venn map was drawn. The “heatmap” and “ggplot2” packages of R software (The R Foundation for Statistical Computing, Vienna, Austria) were used to draw heat and volcano maps, respectively.
Functional and pathway enrichment analyses
The R package “clusterProfiler” 22 was used for gene ontology analysis of VRDEGs with an adjusted P‐value of <0.05 and a false discovery rate of <0.05. The gene set “h.all.v7.4. symbols.gmt” was obtained from the Molecular Signatures Database and gene set enrichment analysis 23 was carried out to calculate the functional enrichment differences between the healthy and DN groups of the expressed genes in the GSE30122 and GSE30529 datasets using the clusterProfiler package (Version 4.8.3, https://code.bioconductor.org/browse/clusterProfiler/) (adjusted P < 0.05, false discovery rate <0.25). Gene set variation analysis 24 was carried out between the healthy and DN groups in the GSE30122 and GSE30529 datasets to identify commonly activated/suppressed pathways. The gene set “c2.cp.kegg.v6.2. symbols” from the Molecular Signatures Database was used for gene set variation analysis.
Immune cell infiltration analysis
We uploaded the gene expression matrix data to CIBERSORTx (https://cibersortx.stanford.edu/) 25 for immune cell infiltration analysis. Combined with the Homo sapiens characteristic gene matrix, data with an enrichment fraction of immune cells >0 were excluded. Combined with the gene expression matrix of the DN dataset, the correlation between immune cells and VRDEGs was determined, and the correlation heatmap was drawn using the R package “pheatmap.”
Protein–protein interaction network construction
The online database, STRING 26 , was used to analyze the protein–protein interaction (PPI) of the VRDEGs. PPI networks were further visualized using the Cytoscape software (https://cytoscape.org/). The top 12 common VRDEGs were selected as hub genes using five algorithms containing maximum neighborhood component, degree correlation, maximal clique centrality, edge percolated component and density of maximum neighborhood component in cytoHubba 27 .
messenger ribonucleic acid–microribonucleic acid, messenger ribonucleic acid–ribonucleic acid‐binding proteins, messenger ribonucleic acid–transcription factor and messenger ribonucleic acid–drug interaction networks
We used messenger ribonucleic acid (mRNA)–microRNA (miRNA) data from the ENCORI 27 and miRDB 28 databases to forecast interrelated miRNAs associated with the five hub genes by taking the intersection of the two DN databases. RNA‐binding proteins (RBPs) that interacted with the hub genes were predicted using the ENCORI database, and the mRNA–RBP interaction network was mapped. Transcription factor (TF) binding to the hub genes was observed using the CHIPBase 29 (version 3.0) and hTFtarget 30 databases. In addition, the drug–gene interaction database 31 was used to predict potential drugs or small‐molecule compounds interacting with hub genes.
Correlation analysis of VRDEGs and receiver operating characteristic curves
To investigate the mechanism and biological characteristics of VRDEGs in DN and determine hub gene correlations, correlation heatmaps were drawn to show the correlation between gene expression levels in the GSE30122 and GSE30529 databases.
The receiver operating characteristic (ROC) curves of the hub genes in the healthy and DN groups from the two databases were plotted, and the diagnostic effect of hub gene expression on the disease was assessed using the area under the curve (AUC).
Animals and experimental groups
Six 8‐week‐old C57BL/KsJ‐db/db (db/db) mice were used as the experimental group, and six 8‐week‐old C57BL/KsJ‐db+/+m (db/m) mice were used as the control group. All were purchased from Gempharmatech Co., Ltd (Jiangsu, China; No.SCXK 2018‐0008) and reared in an specific‐pathogen‐free barrier environment animal house at Fujian Medical University. All animal care and experimental procedures were approved by the Animal Ethics Committee of Fujian Medical University (Ethics Review Approval Number: FJMU IACUC 2020‐0105). After 2 weeks of adaptive feeding, a fasting blood glucose in tail vein blood ≥16.7 mmol/L was measured for three consecutive days, indicating that the model was successfully prepared. After continued feeding for 8 weeks, the mice were killed by neck removal, and half of the left kidney tissue was removed and fixed in 4% formaldehyde solution for 24 h. After dehydration, transparency and paraffin embedding, sections of 3‐μm thickness were taken for immunohistochemistry.
Immunohistochemistry
Paraffin sections of mice kidney tissue underwent dewaxing, gradient ethanol hydration, double‐steam water washing and microwave antigen repair. Next, endogenous peroxidase was blocked with 3% H2O2, then with 3% bovine serum albumin. Primary antibodies of C3 (1:200; Santa Cruz Biotechnology, Santa Cruz, CA, USA), B2M (1:200; Wanleibio, Shenyang, China), CASP1 (1:1,000; Servicebio, Wuhan, China), LYZ (1:1,000; Servicebio) and ITGAM (1:1,000; Servicebio) were added, and samples were incubated overnight in a 4°C refrigerator. Then, the second antibody was added and another incubation period of 50 min occurred. 3,3′‐Diaminobenzidine was added for color development, and hematoxylin was added for nucleus staining. Samples were observed under an optical microscope and photographed for preservation. The mean optical density of immunohistochemistry was measured by ImageJ software (National Institutes of Health, Bethesda, MD, USA).
Statistical analysis
Statistical analyses were carried out using R software (version 4.1.2). The Student's t‐test and Mann–Whitney U‐test were used to analyze normally and non‐normally distributed continuous variables, respectively. The χ2‐test or Fisher's exact test was used to compare categorical variables. Spearman's correlation analysis was used to calculate the correlation coefficients between the different molecules. A P‐value <0.05 was considered statistically significant.
RESULTS
Data preprocessing
A general flowchart of the analysis is shown in Figure 1. In the GSE30122 and GSE30529 databases, the samples were divided into DN and healthy groups. The GSE30122 (Figure 2a,b) and GSE30529 (Figure 2c,d) datasets were standardized and shown in boxplots. After standardization, the expression levels of different samples in the databases were consistent.
Figure 1.
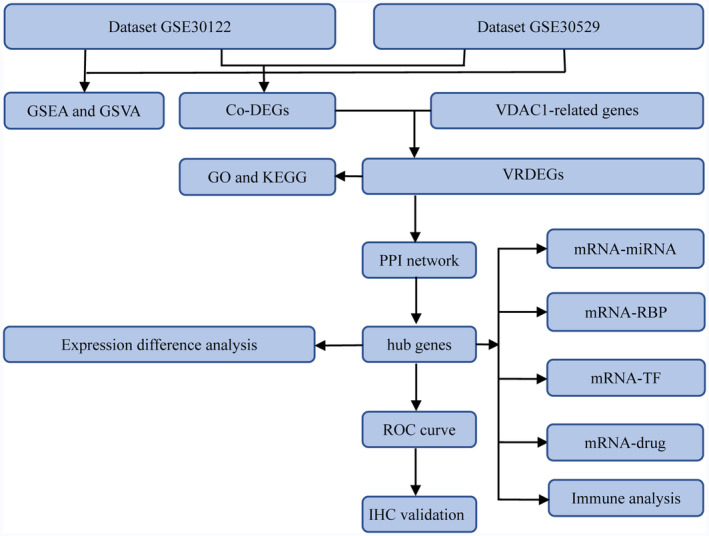
The overall analysis flow chart of this study. co‐DEGs, common differentially expressed genes; GO, gene ontology; GSEA, gene set enrichment analysis; GSVA, gene set variation analysis; KEGG, Kyoto Encyclopedia of Genes and Genomes; mRNA, messenger ribonucleic acid; miRNA, microribonucleic acid; PPI, protein–protein interaction; RBP, ribonucleic acid‐binding protein; ROC, receiver operating characteristic; TF, transcription factor; VDAC1, voltage‐dependent anion channel 1, VRDEGs, voltage‐dependent anion channel 1‐related differentially expressed genes.
Figure 2.
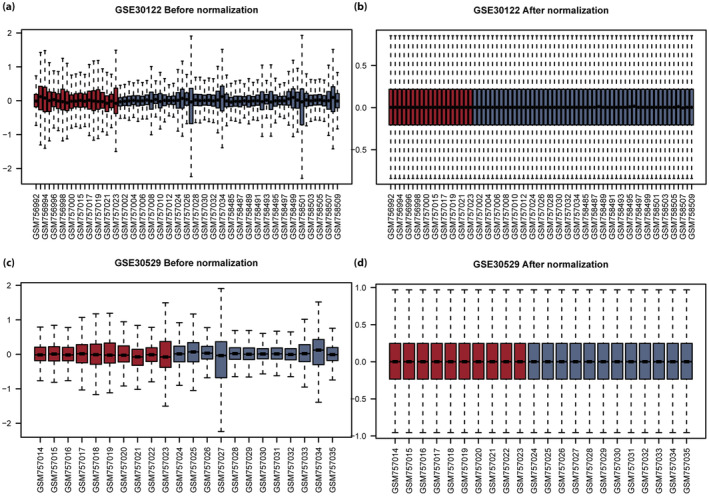
Boxplot of the GSE30122 and GSE30529 datasets before and after correction. (a) Box diagram of intersample gene expression in the GSE30122 dataset before correction. (b) Box diagram of intersample gene expression in the GSE30122 dataset after correction. (c) Box diagram of intersample gene expression in the GSE30529 dataset before correction. (d) Box diagram of intersample gene expression in the GSE30529 dataset after correction. Blue represents the healthy group, and red represents the diabetic nephropathy group.
Analysis of DEGs and VRDEGs associated with DN
In the GSE30122 dataset, 263 DEGs were identified, including 148 upregulated and 115 downregulated genes (Figure 3a). In the GSE30529 dataset, 917 DEGs were identified, including 581 upregulated and 336 downregulated genes (Figure 3b).
Figure 3.
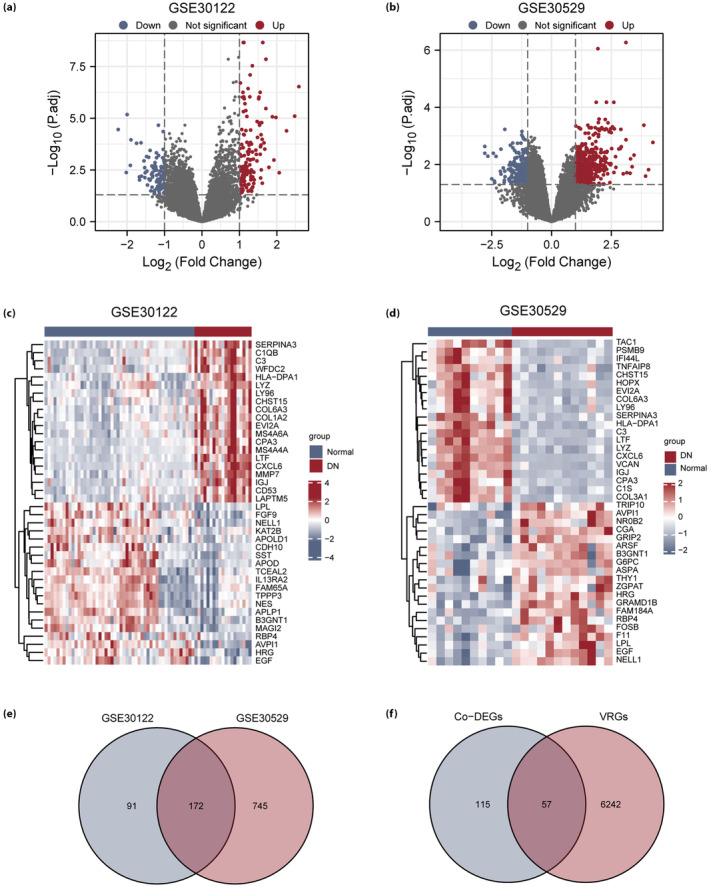
Differentially expressed genes (DEG) analysis of the diabetic nephropathy (DN) dataset. (a) Volcano map of DEGs in the GSE30122 dataset. (b) Volcano map of DEGs in the GSE30529 dataset. (c) Heatmap of DEGs in the GSE30122 dataset. (d) Heatmap of DEGs in the GSE30529 dataset. (e) Venn diagram of DEGs in the GSE30122 and GSE30529 datasets. (f) Venn diagram of common DEGs (Co‐DEGs) and voltage‐dependent anion channel 1‐related genes (VRGs) in the GSE30122 and GSE30529 datasets. Blue represents the healthy group, and red represents the diabetic nephropathy group. co‐DEGs, common differentially expressed genes.
The expression differences among the different sample groups in the GSE30122 dataset and the GSE30529 dataset are shown as heatmaps (Figure 3c,d). The top 20 upregulated DEGs and the top 20 downregulated DEGs in the two datasets were found by selecting the log fold change column in ascending order from the results of the difference analysis (Tables S1 and S2).
To obtain VRDEGs, all DEG intersections in the GSE30122 and GSE30529 datasets were analyzed, and 172 co‐DEGs were obtained (Figure 3e). By considering the intersection of co‐DEGs and VRGs, 57 VRDEGs were obtained (Table S3), and a Venn diagram was drawn (Figure 3f).
Functional and pathway enrichment analysis of VRDEGs
To investigate the biological functions and signaling pathways of the 57 VRDEGs and their relationship with DN, gene ontology and KEGG, enrichment analyses of VRDEGs were carried out (P < 0.05 and false discovery rate <0.05) and shown in a bubble diagram (Figure 4a,b), ring‐network diagram (Figure 4c,d), cyclic graph (Figure 4e) and chord graph (Figure 4f). Pathway maps were drawn to show the pathways in KEGG (Figures S1–S8).
Figure 4.
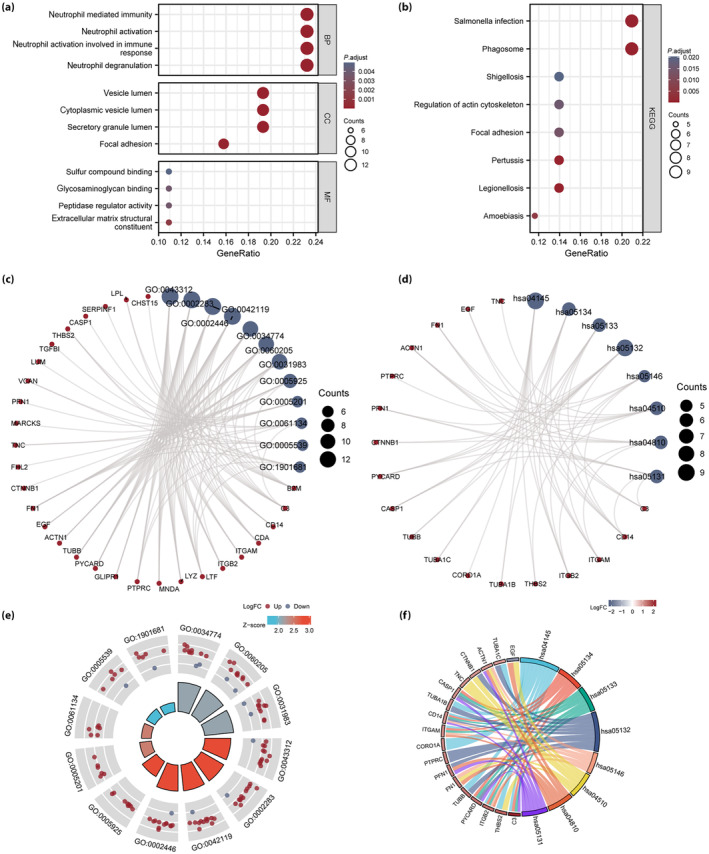
Functional (gene ontology [GO]) and pathway (Kyoto Encyclopedia of Genes and Genomes [KEGG]) enrichment analysis of voltage‐dependent anion channel 1‐related differentially expressed genes (VRDEGs). (a, b) Bubble diagrams of (a) GO functional enrichment analysis and (b) KEGG pathway enrichment analysis of VRDEGs. (c, d) Ring‐network diagram of (c) GO functional enrichment analysis, and (d) KEGG pathway enrichment analysis for VRDEGs. (e) Loop diagram and (f) chord diagram of GO functional enrichment analysis results of VRDEGs. The screening criteria for GO and KEGG enrichment items were a P‐value <0.05 and false discovery rate <0.05. BP, biological process; CC, cellular component; MF, molecular function.
To identify DN‐related signaling pathways, we carried out a gene set enrichment analysis between the healthy and DN groups in the GSE30122 (Figure 5a) and GSE30529 (Figure 6a) datasets. All DEGs in the GSE30122 dataset significantly enriched the phosphoinositide 3‐kinase (PI3K/AKT; Figure 5b), interleukin (IL)‐10 (Figure 5c), Notch (Figure 5d) and IL‐17 (Figure 5e) pathways, among others. The DEGs in the GSE30529 dataset had significantly enriched the PI3K/AKT (Figure 6b), transforming growth factor (TGF)‐β (Figure 6c), Wnt (Figure 6d) and Notch (Figure 6e) pathways, among others.
Figure 5.
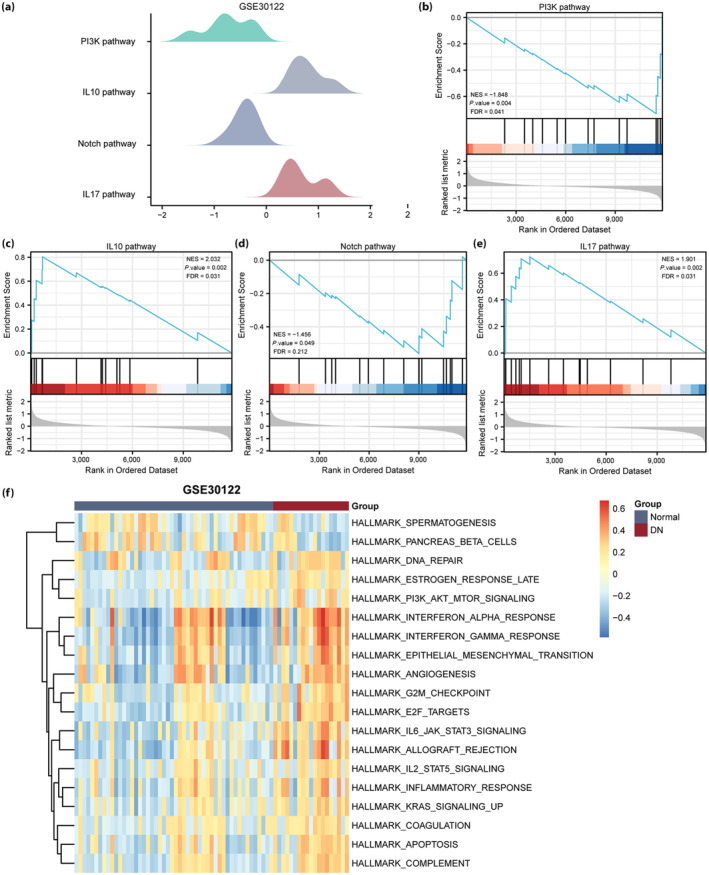
Gene set enrichment analysis and gene set variation analysis of the GSE30122 diabetic nephropathy (DN) dataset. (a) The main gene set enrichment analysis pathway in the GSE30122 dataset. (b–e) The differentially expressed genes in the GSE30122 dataset were significantly enriched in phosphoinositide 3‐kinase (PI3K), interleukin (IL)‐10, Notch and IL‐17 pathways. (f) Gene set variation analysis in the GSE30122 dataset (P < 0.05 and false discovery rate [FDR] <0.25). Blue represents the healthy group, and red represents the DN group. NES, normalized enrichment score.
Figure 6.
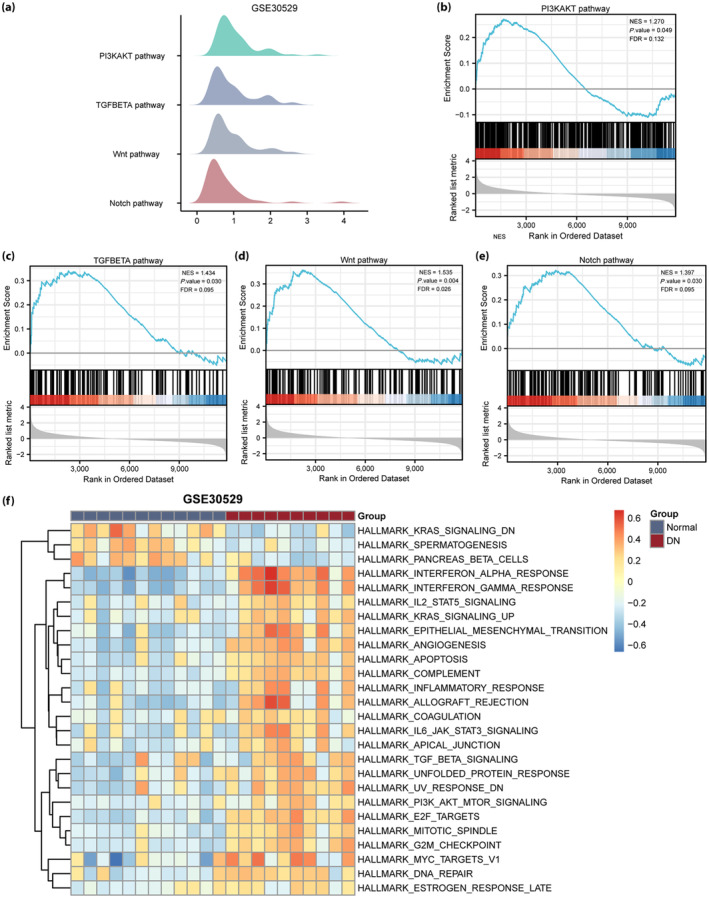
Gene set enrichment analysis and gene set variation analysis of the diabetic nephropathy (DN) GSE30529 dataset. (a) The main gene set enrichment analysis pathway in the GSE30529 dataset. (b–e) The differentially expressed genes in the GSE30122 dataset were significantly enriched in the phosphoinositide 3‐kinase (PI3K/AKT), transforming growth factor (TGF)‐β (Figure 6c), Wnt (Figure 6d) and Notch (Figure 6e) pathways. (f) Gene set variation analysis in the GSE30529 dataset (P < 0.05 and false discovery rate [FDR] <0.25). Blue represents the healthy group, and red represents the DN group. NES, normalized enrichment score.
We further carried out gene set variation analysis between the DN and healthy groups in the GSE30122 and GSE30529 datasets. The PI3K/AKT, IL‐2 and IL‐6 pathways, and other gene sets were associated with DN in the GSE30122 dataset (Figure 5f). PI3K/AKT, TGF‐β and IL‐6 pathways and other gene sets were associated with DN in the GSE30529 dataset (Figure 6f).
PPI network
PPI analysis of the 57 VRDEGs using the STRING database was based on a minimum correlation coefficient of >0.400, and a map of the PPI network is shown in Figure 7a. Subsequently, five types of cytoHubba algorithms were used to select the five common genes (ITGAM, B2M, LYZ, C3 and CASP1) among the top 12 hub genes (Figure 7b), and the PPI network diagram was drawn (Figure 7c).
Figure 7.
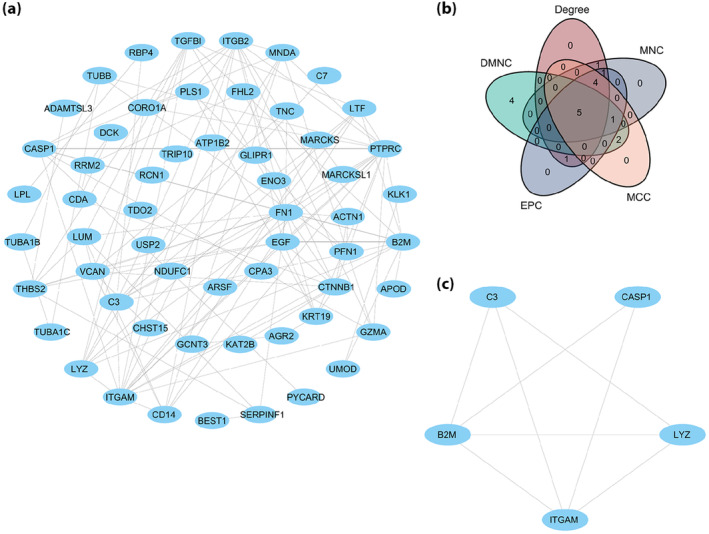
Protein–protein interaction (PPI) network. (a) The PPI network of voltage‐dependent anion channel 1‐related differentially expressed gene. (b) The common gene Venn diagram of the top 12 voltage‐dependent anion channel 1‐related differentially expressed genes was selected under the five algorithms of maximal clique centrality (MCC), maximum neighborhood component (MNC), edge percolated component (EPC), degree correlation (Degree) and density of maximum neighborhood component (DMNC). (c) PPI network of the five hub genes.
Interaction network of hub gene–miRNA, gene–RBP, gene–TF and gene–drug
Our mRNA–miRNA interaction network was composed of three hub genes (mRNA) (B2M, LYZ and CASP1) and 13 miRNA molecules, which constituted 13 mRNA–miRNA interactions (Figure 8a). The mRNA–RBP interaction network was composed of five hub genes (mRNA; ITGAM, B2M, LYZ, C3 and CASP1; Figure 8b). The interaction relationship data between the five hub genes and 162 TFs was obtained and visualized (Figure 8c). A total of 32 molecular compounds or drugs potentially related to the four hub genes (ITGAM, B2M, C3 and CASP1) were identified after excluding genes for which no potential drugs or molecular compounds were found (Figure 8d).
Figure 8.
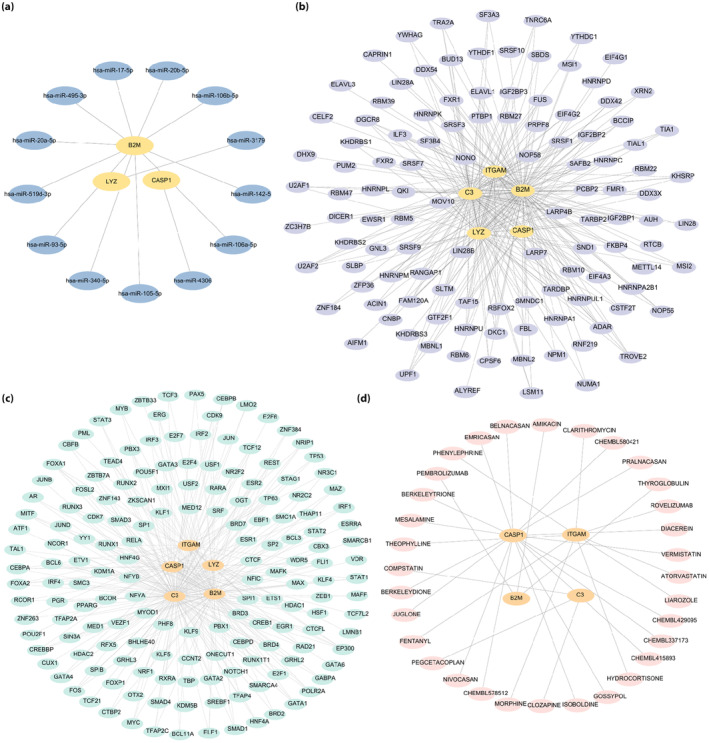
Hub gene interaction networks. (a) Hub gene–microribonucleic acid interaction network. (b) Hub gene–ribonucleic acid‐binding protein interaction network. (c) Hub gene–transcription factors interaction network. (d) Hub gene–drug interaction network. The blue ovals, purple ellipses, green ovals and pink ellipses are microribonucleic acid, ribonucleic acid‐binding protein, transcription factors and drugs, respectively.
Immune infiltration analysis of DN datasets
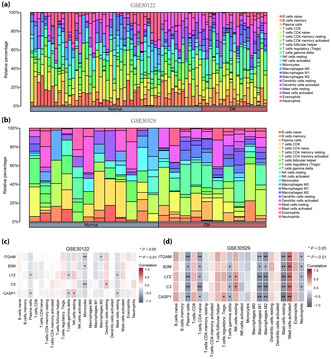
The correlation between immune cells and expression profile data of the healthy and DN groups in the two datasets was calculated, and the infiltration of 22 immune cell types in each sample of the GSE30122 (Figure 9a) and GSE30529 (Figure 9b) datasets were plotted as bar graphs. Correlation heatmaps show the association between the five hub genes (ITGAM, B2M, LYZ, C3 and CASP1) and the number of immune cells in the GSE30122 (Figure 9c) and GSE30529 (Figure 9d) datasets. In the GSE30122 dataset, ITGAM and C3 were significantly correlated with monocyte infiltration (P < 0.01); furthermore, B2M was significantly correlated with monocytes, whereas LYZ was significantly correlated with high levels of plasma cells, T cells and mast cells (P < 0.05). Finally, CASP1 was significantly correlated with the infiltration of plasma cells, T cells, natural killer cells and mast cells (P < 0.05). In the GSE30529 dataset, ITGAM, LYZ, C3 and CASP1 were significantly correlated with a high infiltration of plasma cells, macrophages and mast cells (P < 0.01), whereas ITGAM, B2M, LYZ and C3 levels were significantly correlated with neutrophil concentration (P < 0.05).
Figure 9.
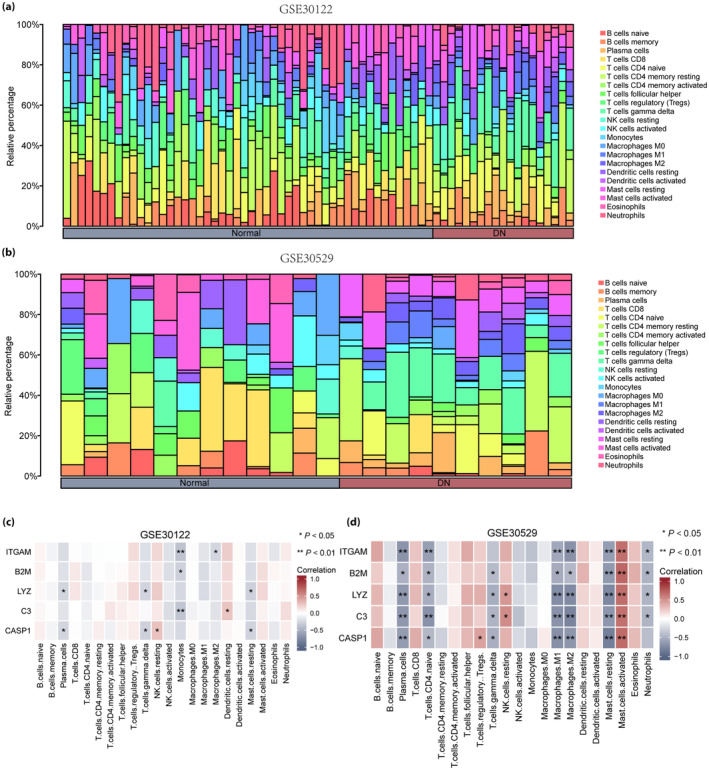
Immune infiltration analysis of the GSE30122 and GSE30529 datasets (CIBERSORTx). (a) Bar graph of immune infiltration results of 22 immune cells in the GSE30122 dataset. (b) Bar graph of immune infiltration results of 22 immune cells in the GSE30529 dataset. (c) Heatmap of correlation analysis between voltage‐dependent anion channel 1‐related differentially expressed genes and immune cell expression in the GSE30122 dataset. (d) Heatmap of correlation analysis between voltage‐dependent anion channel 1‐related differentially expressed genes and immune cell expression in the GSE30529 dataset. Blue represents the healthy group, and red represents the diabetic nephropathy group.
Expression and correlation analysis of hub genes
The expression of hub genes (ITGAM, B2M, LYZ, C3 and CASP1) was significantly different between the healthy and DN groups in the GSE30122 (Figure 10a) and GSE30529 (Figure 10b) datasets (P < 0.001). Significant differences were discovered between the five hub genes (ITGAM, B2M, LYZ, C3 and CASP1) in the GSE30122 and GSE30529 datasets (P < 0.01), as shown in correlation heatmaps (Figure 10c,d, respectively).
Figure 10.
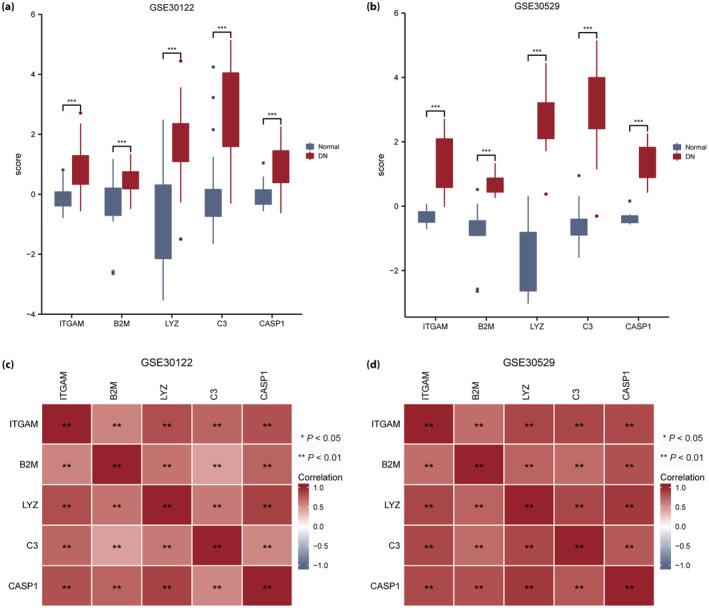
Differential and correlation analysis of hub gene expression in the GSE30122 and GSE30529 datasets. (a) Differences in the expression of hub genes in the GSE30122 dataset. (b) Differences in the expression of hub genes in the GSE30529 dataset. (c) Heatmap of hub gene correlation analysis in the GSE30122 dataset. (d) Heatmap of hub gene correlation analysis in the GSE30529 dataset. The symbol “ns” represents P ≥ 0.05, *P < 0.05 and **P < 0.01. DN, diabetic nephropathy.
ROC curves were used to verify the expression differences of the five hub genes (ITGAM, B2M, LYZ, C3 and CASP1) between the healthy and DN groups in the two datasets. Hub genes C3 (AUC 0.908; Figure 11b) and CASP1 (AUC 0.904; Figure 11c) showed high diagnostic value in the GSE30122 dataset. The hub genes B2M (AUC 0.802; Figure 11a), ITGAM (AUC 0.867; Figure 11d) and LYZ (AUC 0.878; Figure 11e) showed certain diagnostic value in the GSE30122 dataset. ROC verification of hub genes B2M (AUC 0.975; Figure 11f), C3 (AUC 0.983; Figure 11g) and ITGAM (AUC 0.983; Figure 11h) showed high diagnostic value in the GSE30529 dataset.
Figure 11.
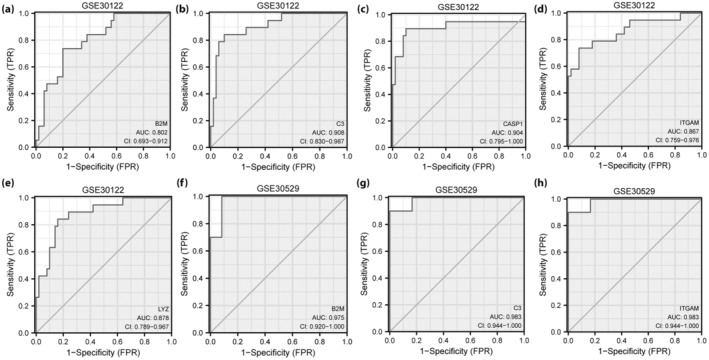
Receiver operating characteristic curve analysis of hub genes. (a–d) Receiver operating characteristic curve analysis of hub genes (a) B2M, (b) C3, CASP1 (c), (d) ITGAM and (e) LYZ in the GSE30122 dataset. (f–h) Receiver operating characteristic curve analysis of hub genes (f) B2M, (g) C3 and (h) ITGAM in the GSE30529 dataset. FPR, false positive rate.
Immunohistochemistry validation of hub genes
C3, B2M, CASP1, ITGAM and LYZ were verified in 16‐week‐old db/db mice using immunohistochemistry, which showed that C3 (P < 0.0001), CASP1 (P < 0.001), B2M (P = 0.0172), LYZ (P = 0.0084) and ITGAM (P < 0.001) were significantly increased in the db/db group compared with the db/m group (Figure 12).
Figure 12.
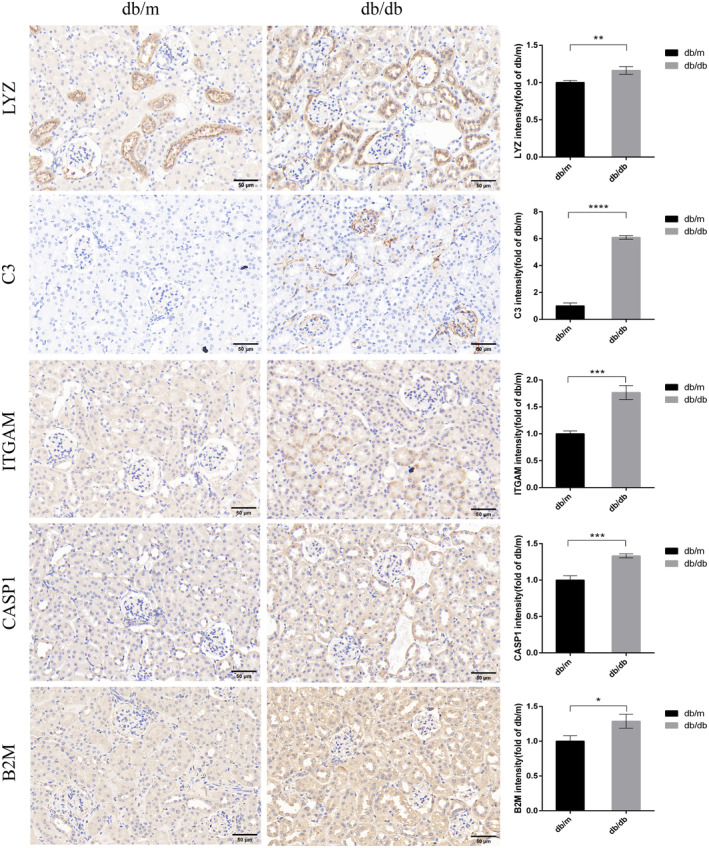
Immunohistochemistry staining examined the expression of five hub biomarkers (LYZ, C3, ITGAM, CASP1 and B2M) in the db/db group compared with the db/m group. Bar, 50 μm. *P < 0.05, **P < 0.01 and ***P < 0.001.
DISCUSSION
DN is a serious public health issue and the principal cause of end‐stage renal disease 32 . Presently, there is no optimal treatment to prevent and control the development of DN 33 . Mitochondrial dysfunction has recently been confirmed to participate in the pathogenesis of DN 4 . VDAC1 is considered a key regulator of mitochondria‐mediated apoptosis 6 , 7 , and it has been shown that VDAC1 is related to multiple diseases 8 , 10 , 12 , 13 , 14 . The present study is the first to combine DN and VDAC1 data, and use bioinformatics to identify potential biomarkers of DN. Five hub genes related to VDAC1 in DN were identified according to the PPI network: ITGAM, B2M, LYZ, C3 and CASP1. The ROC curves confirmed their diagnostic value for DN, and their expression was verified using immunohistochemical analysis of the kidney of 16‐week‐old db/db mice.
Lysozyme (LYZ) has immunomodulatory and antimicrobial activities 34 . A previous study used bioinformatics analysis to show that LYZ expression was upregulated in DN and reported an increase in LYZ mRNA levels in the urine of patients diagnosed with DN by renal biopsy. Through prognostic analysis, it was suggested that urinary LYZ mRNA could predict DN progression 35 . The present study also found that LYZ is one of the upregulated DEGs in DN, and for the first time, used an animal model of DN to verify the increased expression of LYZ in kidney tissue using immunohistochemistry. These outcomes suggest that LYZ is involved in the development of DN, and might be a potential biomarker. A previous study showed that orally administered microencapsulated LYZ could reduce the severity of kidney damage in a diabetic animal model 34 ; however, the study did not verify the expression of LYZ in the DN model. Therefore, understanding the potential mechanism of LYZ in the development of DN is valuable, and needs to be further confirmed in vivo and in vitro.
Integrin subunit alpha M (ITGAM) is a member of the integrin β2 subfamily of leukocyte adhesion molecules 36 . However, very little is known about its role in DN development. A previous study found that ITGAM is one of the hub genes related to iron death in DN 37 . The current study verified the increased expression of ITGAM in the kidney tissue of DN mice using immunohistochemistry, confirming the potential role of ITGAM in the development of DN. A recent study confirmed the high expression of ITGAM in blood and kidney tissue in a diabetic renal rat model using reverse transcription quantitative polymerase chain reaction, which was consistent with the results of the current study 38 .
Complement C3 is a key component of the complement system 39 . A large number of studies have confirmed the role of complement C3 in the development of DN, and it could cause mitochondrial damage and mediate apoptosis of DN podocytes 39 . Previous studies found that rats with type 2 diabetes and kidney disease had high complement C3 expression, which contributes to DN progression 40 . The immunohistochemistry outcomes of the present study showed that C3 was significantly overexpressed in the glomeruli of db/db mice, which indicates the vital role of complement C3 in the pathogenesis of DN.
Caspase‐1 is a member of the cysteine protease family 41 . The role of caspase‐1 in the development of DN has been confirmed by many studies. For instance, Shahzad et al. 42 reported that caspase‐1‐dependent inflammasome activation promotes DN, while in a DN animal model, the kidney expression of caspase‐1 was significantly increased, and inhibition of caspase‐1 reduce the tissue inflammation 43 . The present study also confirmed that CASP1 was highly expressed in the kidney of 16‐week‐old db/db mice, which supports the important role of CASP1 in the development of DN, in line with previous studies.
Previously, DN was considered a non‐immune disease. However, this notion has changed along with the increasing evidence that inflammatory responses are involved in the pathogenesis of DN. In the current study, the DN group had enriched immune response‐regulating signaling pathways. We further explored the correlation between the aforementioned five hub genes and immune cells, and associations were identified between the aforementioned five hub genes and various immune cell type.
Macrophages are essential in the pathogenesis of DN 44 . Several studies involving both animal models and patients with DN have shown macrophage accumulation in diabetic kidneys, leading to kidney injury 45 , 46 , 47 . In the present study, we found that ITGAM, LYZ and C3 were positively correlated with macrophage infiltration. ITGAM has been shown to regulate the polarization of macrophages and participate in osteosarcoma 32 , whereas LYZ reduced the concentration of macrophages in the inflammation site in a cellular model of DN 48 . C3aR deficiency can attenuate diabetic renal damage by influencing macrophage‐secreted cytokines 49 . However, the relationship between these hub genes and immune cell infiltration and the mechanism involved in DN needs to be further explored.
The aggregation of mast cells in the renal interstitium is correlated with renal interstitial injury and DN progression 50 . The present study showed that the hub genes ITGAM, LYZ, C3 and CASP1 were positively correlated with mast cell levels. As an activator of mast cells, complement C3 participates in the inflammatory process of DN by triggering the release inflammatory mediators from mast cells 51 ; however, mast cell‐mediated allergic inflammation can be suppressed through the involvement of caspase‐1 52 . Notably, the involvement of LYZ and ITGAM in the regulation of mast cells has not been reported previously, and further studies are needed.
Very little evidence substantiates the direct role of neutrophils in the pathogenesis of DN. However, a recent study showed that neutrophil extracellular traps could cause glomerular endothelial dysfunction in patients with diabetes 53 . The present study showed that the hub genes C3, ITGAM, B2M and LYZ were significantly associated with neutrophil infiltration. In patients with latent autoimmune diabetes in adults, neutrophils were involved in the activation of degranulation, adhesion and migration at the transcriptional level, and ITGAM was upregulated in the neutrophils of patients with latent autoimmune diabetes in adults 54 . Potential interaction between the aforementioned hub genes and neutrophils might participate in the progression of DN, although this requires further experimental investigation.
The present results showed that the PI3K/AKT, Notch, TGF‐β, Wnt, IL‐10 and IL‐17 pathways were highly expressed in DN. There is an increasing amount of evidence showing that the PI3K/AKT 55 , TGF‐β 56 , Notch 57 and Wnt pathways 58 are activated during DN development. IL‐10 polymorphism was elucidated as a protective factor for DN 59 , as it reduced acute inflammation and fibrosis in the kidneys of diabetic mice 60 . Evidence supports the activation of IL‐17A, which aggravates kidney injury in DN 61 . Similarly, the present study suggests that the IL‐10 and IL‐17 pathways might be related to DN, which should be confirmed in future studies.
The present study had some limitations. First, for the study of DN, clinical information, such as that regarding diabetes type, hypertension and dyslipidemia, is essential, as these factors might affect gene expression profiles and the recognition of hub genes. The datasets analyzed in this study were obtained from the Gene Expression Omnibus, which unfortunately did not provide relevant clinical information. Therefore, further research is needed to explore the relationship between clinical features and hub genes. Second, only bioinformatics analysis was used to investigate the relationship between hub genes and immune cell infiltration, which must be further verified and explored in vivo and in vitro in the future. Finally, only immunohistochemical verification of hub genes was carried out on the kidney tissue of mice with DN; further experiments are needed to explore the actual roles of these hub genes in the development of DN.
In conclusion, we identified and verified five VDAC1‐related hub genes (ITGAM, B2M, LYZ, C3 and CASP1) and enrichment pathways that might be involved in the pathogenesis of DN. Our data show that hub genes are closely related to immune cell infiltration in DN. Furthermore, we identified 32 molecular compounds and drugs related to four hub genes (ITGAM, B2M, C3 and CASP1), which might have the potential to inhibit DN progression. Therefore, the outcomes of the present study might develop an understanding of the mechanisms involved in the pathogenesis of DN.
DISCLOSURE
The authors declare no conflict of interest.
Approval of the research protocol: N/A.
Informed consent: N/A.
Approval date of registry and the registration no. of the study/trial: N/A.
Animal studies: Animal studies were approved by the Animal Ethics Committee of Fujian Medical University (Ethics Review Approval Number: FJMU IACUC 2020–0105).
Supporting information
Figure S1. Pathway enrichment (KEGG) analysis of VRDEGs: Pathway map of the Salmonella infection pathway. VRDEGs, VDAC1‐related differentially expressed genes; KEGG, Kyoto Encyclopedia of Genes and Genomes.
Figure S2. Pathway enrichment (KEGG) analysis of VRDEGs: Pathway map of the phagosome pathway. VRDEGs, VDAC1‐related differentially expressed genes; KEGG, Kyoto Encyclopedia of Genes and Genomes.
Figure S3. Pathway enrichment (KEGG) analysis of VRDEGs: Pathway map of regulation of the actin cytoskeleton pathway. VRDEGs, VDAC1‐related differentially expressed genes; KEGG, Kyoto Encyclopedia of Genes and Genomes.
Figure S4. Pathway enrichment (KEGG) analysis of VRDEGs: Pathway map of the Shigellosis pathway. VRDEGs, VDAC1‐related differentially expressed genes; KEGG, Kyoto Encyclopedia of Genes and Genomes.
Figure S5. Pathway enrichment (KEGG) analysis of VRDEGs: Pathway map of the focal adhesion pathway. VRDEGs, VDAC1‐related differentially expressed genes; KEGG, Kyoto Encyclopedia of Genes and Genomes.
Figure S6. Pathway enrichment (KEGG) analysis of VRDEGs: Pathway map of the pertussis pathway. VRDEGs, VDAC1‐related differentially expressed genes; KEGG, Kyoto Encyclopedia of Genes and Genomes.
Figure S7. Pathway enrichment (KEGG) analysis of VRDEGs: Pathway map of the legionellosis pathway. VRDEGs, VDAC1‐related differentially expressed genes; KEGG, Kyoto Encyclopedia of Genes and Genomes.
Figure S8. Pathway enrichment (KEGG) analysis of VRDEGs: Pathway map of the amoebiasis pathway. VRDEGs, VDAC1‐related differentially expressed genes; KEGG, Kyoto Encyclopedia of Genes and Genomes.
Table S1. The top 20 upregulated and downregulated DEGs in the GSE30122 dataset.
Table S2. The top 20 upregulated and downregulated DEGs in the GSE30529 dataset.
Table S3. VDAC1‐related differentially expressed genes.
ACKNOWLEDGMENTS
This study was funded by the Youth Scientific Research Project of the Fujian Provincial Health Commission (No. 2020QNA049) and the Fujian Provincial Science and Technology Plan Project (No. 2021Y2005).
DATA AVAILABILITY STATEMENT
The data that support the findings of this study are included in the article or supplementary materials. Further inquiries are available from the corresponding author.
REFERENCES
- 1. Han Q, Zhu H, Chen X, et al. Non‐genetic mechanisms of diabetic nephropathy. Front Med 2017; 11: 319–332. [DOI] [PubMed] [Google Scholar]
- 2. Ma Q, Li Y, Li P, et al. Research progress in the relationship between type 2 diabetes mellitus and intestinal flora. Biomed Pharmacother 2019; 117: 109138. [DOI] [PubMed] [Google Scholar]
- 3. A/L B Vasanth Rao VR, Tan SH, Candasamy M, et al. Diabetic nephropathy: An update on pathogenesis and drug development. Diabetes Metab Syndr 2019; 13: 754–762. [DOI] [PubMed] [Google Scholar]
- 4. Yao L, Liang X, Qiao Y, et al. Mitochondrial dysfunction in diabetic tubulopathy. Metabolism 2022; 131: 155195. [DOI] [PubMed] [Google Scholar]
- 5. Ahmad AA, Draves SO, Rosca M. Mitochondria in diabetic kidney disease. Cells 2021; 10(11): 2945. [DOI] [PMC free article] [PubMed] [Google Scholar]
- 6. Shoshan‐Barmatz V, Maldonado EN, Krelin Y. VDAC1 at the crossroads of cell metabolism, apoptosis and cell stress. Cell Stress 2017; 1: 11–36. [DOI] [PMC free article] [PubMed] [Google Scholar]
- 7. Shoshan‐Barmatz V, Ben‐Hail D, Admoni L, et al. The mitochondrial voltage‐dependent anion channel 1 in tumor cells. Biochim Biophys Acta 2015; 1848(10 Pt B): 2547–2575. [DOI] [PubMed] [Google Scholar]
- 8. Pittala S, Levy I, De S, et al. The VDAC1‐based R‐Tf‐D‐LP4 peptide as a potential treatment for diabetes mellitus. Cell 2020; 9: 481. [DOI] [PMC free article] [PubMed] [Google Scholar]
- 9. Gong D, Chen X, Middleditch M, et al. Quantitative proteomic profiling identifies new renal targets of copper(II)‐selective chelation in the reversal of diabetic nephropathy in rats. Proteomics 2009; 9: 4309–4320. [DOI] [PubMed] [Google Scholar]
- 10. Arif T, Krelin Y, Nakdimon I, et al. VDAC1 is a molecular target in glioblastoma, with its depletion leading to reprogrammed metabolism and reversed oncogenic properties. Neuro Oncol 2017; 19: 951–964. [DOI] [PMC free article] [PubMed] [Google Scholar]
- 11. Shoshan‐Barmatz V, De S, Meir A. The mitochondrial voltage‐dependent anion channel 1, Ca(2+) transport, apoptosis, and their regulation. Front Oncol 2017; 7: 60. [DOI] [PMC free article] [PubMed] [Google Scholar]
- 12. Verma A, Pittala S, Alhozeel B, et al. The role of the mitochondrial protein VDAC1 in inflammatory bowel disease: A potential therapeutic target. Mol Ther 2022; 30: 726–744. [DOI] [PMC free article] [PubMed] [Google Scholar]
- 13. Kim J, Gupta R, Blanco LP, et al. VDAC oligomers form mitochondrial pores to release mtDNA fragments and promote lupus‐like disease. Science 2019; 366: 1531–1536. [DOI] [PMC free article] [PubMed] [Google Scholar]
- 14. Klapper‐Goldstein H, Verma A, Elyagon S, et al. VDAC1 in the diseased myocardium and the effect of VDAC1‐interacting compound on atrial fibrosis induced by hyperaldosteronism. Sci Rep 2020; 10: 22101. [DOI] [PMC free article] [PubMed] [Google Scholar]
- 15. Branco AF, Pereira SL, Moreira AC, et al. Isoproterenol cytotoxicity is dependent on the differentiation state of the cardiomyoblast H9c2 cell line. Cardiovasc Toxicol 2011; 11: 191–203. [DOI] [PubMed] [Google Scholar]
- 16. Wang Z, Ge Y, Bao H, et al. Redox‐sensitive glycogen synthase kinase 3β‐directed control of mitochondrial permeability transition: Rheostatic regulation of acute kidney injury. Free Radic Biol Med 2013; 65: 849–858. [DOI] [PMC free article] [PubMed] [Google Scholar]
- 17. Woroniecka KI, Park AS, Mohtat D, et al. Transcriptome analysis of human diabetic kidney disease. Diabetes 2011; 60: 2354–2369. [DOI] [PMC free article] [PubMed] [Google Scholar]
- 18. Barrett T, Wilhite SE, Ledoux P, et al. NCBI GEO: Archive for functional genomics data sets–Update. Nucleic Acids Res 2013; 41(Database issue): D991–D995. [DOI] [PMC free article] [PubMed] [Google Scholar]
- 19. Chodary Khameneh S, Razi S, Shamdani S, et al. Weighted correlation network analysis revealed novel long non‐coding RNAs for colorectal cancer. Sci Rep 2022; 12: 2990. [DOI] [PMC free article] [PubMed] [Google Scholar]
- 20. Fishilevich S, Nudel R, Rappaport N, et al. GeneHancer: Genome‐wide integration of enhancers and target genes in GeneCards. Database 2017; 2017: bax028. [DOI] [PMC free article] [PubMed] [Google Scholar]
- 21. Liberzon A, Birger C, Thorvaldsdóttir H, et al. The molecular signatures database (MSigDB) hallmark gene set collection. Cell Syst 2015; 1: 417–425. [DOI] [PMC free article] [PubMed] [Google Scholar]
- 22. Yu G, Wang LG, Han Y, et al. clusterProfiler: An R package for comparing biological themes among gene clusters. Omics 2012; 16: 284–287. [DOI] [PMC free article] [PubMed] [Google Scholar]
- 23. Subramanian A, Tamayo P, Mootha VK, et al. Gene set enrichment analysis: A knowledge‐based approach for interpreting genome‐wide expression profiles. Proc Natl Acad Sci USA 2005; 102: 15545–15550. [DOI] [PMC free article] [PubMed] [Google Scholar]
- 24. Hänzelmann S, Castelo R, Guinney J. GSVA: Gene set variation analysis for microarray and RNA‐seq data. BMC Bioinform 2013; 14: 7. [DOI] [PMC free article] [PubMed] [Google Scholar]
- 25. Steen CB, Liu CL, Alizadeh AA, et al. Profiling cell type abundance and expression in bulk tissues with CIBERSORTx. Methods Mol Biol 2020; 2117: 135–157. [DOI] [PMC free article] [PubMed] [Google Scholar]
- 26. Wakonig B, Auersperg AMI, O'Hara M. String‐pulling in the Goffin's cockatoo (Cacatua goffiniana). Learn Behav 2021; 49: 124–136. [DOI] [PMC free article] [PubMed] [Google Scholar]
- 27. Chin CH, Chen SH, Wu HH, et al. cytoHubba: Identifying hub objects and sub‐networks from complex interactome. BMC Syst Biol 2014; 8(Suppl 4): S11. [DOI] [PMC free article] [PubMed] [Google Scholar]
- 28. Chen Y, Wang X. miRDB: An online database for prediction of functional microRNA targets. Nucleic Acids Res 2020; 48(D1): D127–D131. [DOI] [PMC free article] [PubMed] [Google Scholar]
- 29. Zhou KR, Liu S, Sun WJ, et al. ChIPBase v2.0: Decoding transcriptional regulatory networks of non‐coding RNAs and protein‐coding genes from ChIP‐seq data. Nucleic Acids Res 2017; 45(D1): D43–d50. [DOI] [PMC free article] [PubMed] [Google Scholar]
- 30. Zhang Q, Liu W, Zhang HM, et al. hTFtarget: A comprehensive database for regulations of human transcription factors and their targets. Genomics Proteomics Bioinformatics 2020; 18: 120–128. [DOI] [PMC free article] [PubMed] [Google Scholar]
- 31. Cotto KC, Wagner AH, Feng YY, et al. DGIdb 3.0: A redesign and expansion of the drug‐gene interaction database. Nucleic Acids Res 2018; 46(D1): D1068–D1073. [DOI] [PMC free article] [PubMed] [Google Scholar]
- 32. Liang T, Chen J, Xu G, et al. TYROBP, TLR4 and ITGAM regulated macrophages polarization and immune checkpoints expression in osteosarcoma. Sci Rep 2021; 11: 19315. [DOI] [PMC free article] [PubMed] [Google Scholar]
- 33. Ma T, Li X, Zhu Y, et al. Excessive activation of notch signaling in macrophages promote kidney inflammation, fibrosis, and necroptosis. Front Immunol 2022; 13: 835879. [DOI] [PMC free article] [PubMed] [Google Scholar]
- 34. Cocchietto M, Zorzin L, Toffoli B, et al. Orally administered microencapsulated lysozyme downregulates serum AGE and reduces the severity of early‐stage diabetic nephropathy. Diabetes Metab 2008; 34(6 Pt 1): 587–594. [DOI] [PubMed] [Google Scholar]
- 35. Lee YH, Seo JW, Kim M, et al. Urinary mRNA signatures as predictors of renal function decline in patients with biopsy‐proven diabetic kidney disease. Front Endocrinol 2021; 12: 774436. [DOI] [PMC free article] [PubMed] [Google Scholar]
- 36. Ley K, Rivera‐Nieves J, Sandborn WJ, et al. Integrin‐based therapeutics: Biological basis, clinical use and new drugs. Nat Rev Drug Discov 2016; 15: 173–183. [DOI] [PMC free article] [PubMed] [Google Scholar]
- 37. Hu Y, Liu S, Liu W, et al. Bioinformatics analysis of genes related to iron death in diabetic nephropathy through network and pathway levels based approaches. PloS One 2021; 16: e0259436. [DOI] [PMC free article] [PubMed] [Google Scholar]
- 38. Hu Y, Yu Y, Dong H, et al. Identifying C1QB, ITGAM, and ITGB2 as potential diagnostic candidate genes for diabetic nephropathy using bioinformatics analysis. PeerJ 2023; 11: e15437. [DOI] [PMC free article] [PubMed] [Google Scholar]
- 39. Gialeli C, Gungor B, Blom AM. Novel potential inhibitors of complement system and their roles in complement regulation and beyond. Mol Immunol 2018; 102: 73–83. [DOI] [PubMed] [Google Scholar]
- 40. Huang Y, Xu J, Wu X, et al. High expression of complement components in the kidneys of type 2 diabetic rats with diabetic nephropathy. Front Endocrinol 2019; 10: 459. [DOI] [PMC free article] [PubMed] [Google Scholar]
- 41. Jia C, Chen H, Zhang J, et al. Role of pyroptosis in cardiovascular diseases. Int Immunopharmacol 2019; 67: 311–318. [DOI] [PubMed] [Google Scholar]
- 42. Shahzad K, Bock F, Al‐Dabet MM, et al. Caspase‐1, but not Caspase‐3, promotes diabetic nephropathy. J Am Soc Nephrol 2016; 27: 2270–2275. [DOI] [PMC free article] [PubMed] [Google Scholar]
- 43. An X, Zhang Y, Cao Y, et al. Punicalagin protects diabetic nephropathy by inhibiting Pyroptosis based on TXNIP/NLRP3 pathway. Nutrients 2020; 12: 1516. [DOI] [PMC free article] [PubMed] [Google Scholar]
- 44. Tervaert TW, Mooyaart AL, Amann K, et al. Pathologic classification of diabetic nephropathy. J Am Soc Nephrol 2010; 21: 556–563. [DOI] [PubMed] [Google Scholar]
- 45. Tang PM, Nikolic‐Paterson DJ, Lan HY. Macrophages: Versatile players in renal inflammation and fibrosis. Nat Rev Nephrol 2019; 15: 144–158. [DOI] [PubMed] [Google Scholar]
- 46. Sugahara M, Tanaka S, Tanaka T, et al. Prolyl hydroxylase domain inhibitor protects against metabolic disorders and associated kidney disease in obese type 2 diabetic mice. J Am Soc Nephrol 2020; 31: 560–577. [DOI] [PMC free article] [PubMed] [Google Scholar]
- 47. Lavoz C, Matus YS, Orejudo M, et al. Interleukin‐17A blockade reduces albuminuria and kidney injury in an accelerated model of diabetic nephropathy. Kidney Int 2019; 95: 1418–1432. [DOI] [PubMed] [Google Scholar]
- 48. Gallo D, Cocchietto M, Masat E, et al. Human recombinant lysozyme downregulates advanced glycation endproduct‐induced interleukin‐6 production and release in an in‐vitro model of human proximal tubular epithelial cells. Exp Biol Med 2014; 239: 337–346. [DOI] [PubMed] [Google Scholar]
- 49. Li XQ, Chang DY, Chen M, et al. Deficiency of C3a receptor attenuates the development of diabetic nephropathy. BMJ Open Diabetes Res Care 2019; 7: e000817. [DOI] [PMC free article] [PubMed] [Google Scholar]
- 50. Tesch GH. Diabetic nephropathy ‐ is this an immune disorder? Clin Sci (Lond) 2017; 131: 2183–2199. [DOI] [PubMed] [Google Scholar]
- 51. Coulthard LG, Woodruff TM. Is the complement activation product C3a a proinflammatory molecule? Re‐evaluating the evidence and the myth. J Immunol 2015; 194: 3542–3548. [DOI] [PubMed] [Google Scholar]
- 52. Bae Y, Lee S, Kim SH. Chrysin suppresses mast cell‐mediated allergic inflammation: Involvement of calcium, caspase‐1 and nuclear factor‐κB. Toxicol Appl Pharmacol 2011; 254: 56–64. [DOI] [PubMed] [Google Scholar]
- 53. Gupta A, Singh K, Fatima S, et al. Neutrophil extracellular traps promote NLRP3 inflammasome activation and glomerular endothelial dysfunction in diabetic kidney disease. Nutrients 2022; 14: 2965. [DOI] [PMC free article] [PubMed] [Google Scholar]
- 54. Xing Y, Lin Q, Tong Y, et al. Abnormal neutrophil transcriptional signature may predict newly diagnosed latent autoimmune diabetes in adults of South China. Front Endocrinol 2020; 11: 581902. [DOI] [PMC free article] [PubMed] [Google Scholar]
- 55. Xu Z, Jia K, Wang H, et al. METTL14‐regulated PI3K/Akt signaling pathway via PTEN affects HDAC5‐mediated epithelial‐mesenchymal transition of renal tubular cells in diabetic kidney disease. Cell Death Dis 2021; 12: 32. [DOI] [PMC free article] [PubMed] [Google Scholar]
- 56. Wang L, Wang HL, Liu TT, et al. TGF‐Beta as a master regulator of diabetic nephropathy. Int J Mol Sci 2021; 22: 7881. [DOI] [PMC free article] [PubMed] [Google Scholar]
- 57. Li MR, Lei CT, Tang H, et al. MAD2B promotes podocyte injury through regulating numb‐dependent notch 1 pathway in diabetic nephropathy. Int J Biol Sci 2022; 18: 1896–1911. [DOI] [PMC free article] [PubMed] [Google Scholar]
- 58. Wang H, Zhang R, Wu X, et al. The Wnt signaling pathway in diabetic nephropathy. Front Cell Dev Biol 2021; 9: 701547. [DOI] [PMC free article] [PubMed] [Google Scholar]
- 59. Naing C, Htet NH, Basavaraj AK, et al. An association between IL‐10 promoter polymorphisms and diabetic nephropathy: A meta‐analysis of case‐control studies. J Diabetes Metab Disord 2018; 17: 333–343. [DOI] [PMC free article] [PubMed] [Google Scholar]
- 60. Fan X, Zhang X, Liu LC, et al. Interleukin‐10 attenuates renal injury after myocardial infarction in diabetes. J Investig Med 2022; 70: 1233–1242. [DOI] [PubMed] [Google Scholar]
- 61. Lavoz C, Rayego‐Mateos S, Orejudo M, et al. Could IL‐17A be a novel therapeutic target in diabetic nephropathy? J Clin Med 2020; 9: 272. [DOI] [PMC free article] [PubMed] [Google Scholar]
Associated Data
This section collects any data citations, data availability statements, or supplementary materials included in this article.
Supplementary Materials
Figure S1. Pathway enrichment (KEGG) analysis of VRDEGs: Pathway map of the Salmonella infection pathway. VRDEGs, VDAC1‐related differentially expressed genes; KEGG, Kyoto Encyclopedia of Genes and Genomes.
Figure S2. Pathway enrichment (KEGG) analysis of VRDEGs: Pathway map of the phagosome pathway. VRDEGs, VDAC1‐related differentially expressed genes; KEGG, Kyoto Encyclopedia of Genes and Genomes.
Figure S3. Pathway enrichment (KEGG) analysis of VRDEGs: Pathway map of regulation of the actin cytoskeleton pathway. VRDEGs, VDAC1‐related differentially expressed genes; KEGG, Kyoto Encyclopedia of Genes and Genomes.
Figure S4. Pathway enrichment (KEGG) analysis of VRDEGs: Pathway map of the Shigellosis pathway. VRDEGs, VDAC1‐related differentially expressed genes; KEGG, Kyoto Encyclopedia of Genes and Genomes.
Figure S5. Pathway enrichment (KEGG) analysis of VRDEGs: Pathway map of the focal adhesion pathway. VRDEGs, VDAC1‐related differentially expressed genes; KEGG, Kyoto Encyclopedia of Genes and Genomes.
Figure S6. Pathway enrichment (KEGG) analysis of VRDEGs: Pathway map of the pertussis pathway. VRDEGs, VDAC1‐related differentially expressed genes; KEGG, Kyoto Encyclopedia of Genes and Genomes.
Figure S7. Pathway enrichment (KEGG) analysis of VRDEGs: Pathway map of the legionellosis pathway. VRDEGs, VDAC1‐related differentially expressed genes; KEGG, Kyoto Encyclopedia of Genes and Genomes.
Figure S8. Pathway enrichment (KEGG) analysis of VRDEGs: Pathway map of the amoebiasis pathway. VRDEGs, VDAC1‐related differentially expressed genes; KEGG, Kyoto Encyclopedia of Genes and Genomes.
Table S1. The top 20 upregulated and downregulated DEGs in the GSE30122 dataset.
Table S2. The top 20 upregulated and downregulated DEGs in the GSE30529 dataset.
Table S3. VDAC1‐related differentially expressed genes.
Data Availability Statement
The data that support the findings of this study are included in the article or supplementary materials. Further inquiries are available from the corresponding author.


