Abstract
Aims/Introduction
Type 2 diabetes triggers an inflammatory response that can damage red blood cells. M2 macrophages have inhibitory effects on inflammation, and play an important role in tissue damage repair and fibrosis. Autologous blood transfusion has the potential to inhibit red blood cell damage by mediating macrophage polarization.
Materials and Methods
Swiss mice were used to establish a suitable type 2 diabetes model, and autologous blood transfusion was carried out. The mice were killed, the blood of the mice was collected and CD14+ monocytes were sorted. The expression levels of phenotypic molecules CD16, CD32 and CD206 in CD14+ monocytes were analyzed by flow cytometry. The proportion of M1 and M2 macrophages were analyzed by flow cytometry. The Q value, P50, 2,3‐diphosphoglycerate and Na+‐K+‐ATPase of red blood cells were detected. The red blood cell osmotic fragility test analyzed the red blood cell osmotic fragility. Western blot analysis was used to analyze the expression changes of erythrocyte surface membrane proteins or transporters erythrocyte membrane protein band 4.1, sphingosine‐1‐phosphate, glycolipid transfer protein and signal peptide peptidase‐like 2A.
Results
Autologous blood transfusion induced a significant increase in the number of macrophages. The state and capacity of blood cells improved with autologous blood transfusion. Reinfusion of fresh autologous blood in type 2 diabetes mice made erythrocytes shrink. The expression of erythrocyte‐related proteins proved that the erythrocyte injury in the reinfusion of fresh autologous blood + type 2 diabetes group was significantly reduced.
Conclusion
The reinfusion of fresh autologous blood into the body of patients with type 2 diabetes can induce macrophage polarization to M2, thereby inhibiting red blood cell damage.
Keywords: Fresh autologous blood transfusion, Macrophages, Type 2 diabetes
Autologous blood transfusion induced a significant increase in the number of macrophages. The state and capacity of blood cells improved with autologous blood transfusion. Reinfusion of fresh autologous blood in type 2 diabetes mice caused erythrocytes to shrink. The expression of erythrocyte‐related proteins proved that the erythrocyte injury in the Fresh + type 2 diabetes group was significantly reduced.
INTRODUCTION
Type 2 diabetes is a chronic metabolic disorder that affects >90% of people with diabetes. Hyperglycemia, insulin deficiency and insulin resistance are all symptoms of this condition 1 . Polydipsia, frequent urination, unexplained weight loss and various inflammatory reactions in the body, excessive eating, weariness, and soreness are some of the most common symptoms 2 . Heart disease, stroke, diabetic retinopathy (which can lead to blindness), renal failure and even poor blood supply to the extremities requiring amputation are all long‐term effects of high blood sugar, as is diabetic ketoacidosis 3 .
The red blood cells are biconcave disc‐shaped, and the contact area between the cell membrane and the plasma is the largest among the body cells 4 . When the red blood cells continuously flow through the microcirculation of various tissues, they need to be deformed at any time. These structural and functional characteristics cause red blood cells to be attacked by inflammatory mediators. The damage is far more serious than other cells 5 , 6 . Free radicals are normal metabolites of the body, and are also a very destructive inflammatory mediator, which can attack the membrane structure of cell membranes, cause lipid peroxidation and cause red blood cell damage 7 , 8 .
In vitro and in vivo, macrophages show obvious functional variations under the influence of distinct microenvironments as a malleable and pluripotent cell type. Macrophages are classified into two types based on their activation states and functions: M1 type (classically activated macrophages) and M2 type (alternatively activated macrophages). Macrophages exist on a continuum of functional states, with M1 and M2 macrophages representing the two extremes of this continuum 9 , 10 , 11 . M1‐type macrophages play an important role in immune regulation, tissue damage repair and fibrosis by secreting pro‐inflammatory cytokines and chemokines (such as tumor necrosis factor‐α, interleukin‐1, nitric oxide), and presenting antigens professionally; M2‐type macrophages have only weak antigen‐presenting ability and downregulate immune responses by secreting inhibitory cytokines, such as interleukin‐10 or transforming growth factor‐β, and play an important role in immune regulation, tissue damage repair and fibrosis 12 , 13 . Identification of macrophage types by phenotype is critical for researching macrophage functions under various physiological and pathological situations.
The inflammatory response in the body caused by type 2 diabetes can damage red blood cells, resulting in a hypoxic state caused by a decrease in red blood cells or their ability to carry oxygen 14 . This hypoxia can be alleviated by returning autologous blood. Considering that erythrocytes themselves have a certain immune function, we were going to explore whether fresh autologous blood can be injected into diabetes patients to make them react with macrophages to inhibit the damage of erythrocytes in the body.
The purpose of this study was to investigate the mechanism of reinfusion of stored fresh autologous blood in patients with type 2 diabetes to induce macrophage polarization and inhibit erythrocyte injury. A total of 120 Swiss mice were used to establish the type 2 diabetes model and were divided into four groups: normal control (NC), type 2 diabetes, reinfusion of fresh autologous blood (Fresh) + type 2 diabetes and reinfusion of old autologous blood (Old) + type 2 diabetes. Half of the mice were killed by isopentane anesthesia, and the blood of the mice was collected from the abdominal aorta, and CD14+ monocytes were sorted by magnetic beads. The expression levels of phenotypic molecules CD16, CD32 and CD206 in CD14+ monocytes were analyzed by flow cytometry. The proportion of CD16+CD32+M1 macrophages and the proportion of CD206+DECTIN‐1+M2 macrophages were analyzed by flow cytometry. The other half of the mice were killed by isopentane anesthesia, and the blood of the mice was collected from the abdominal aorta. The effective oxygen‐carrying capacity (Q value), arterial blood partial pressure of oxygen at half saturation P50, 2,3‐diphosphoglycerate (2,3‐DPG) and Na+‐K+‐ATPase of red blood cells in the blood of each group of mice were detected and analyzed, respectively. The red blood cell osmotic fragility test analyzed the red blood cell osmotic fragility in the blood of each group of mice. Western blot analysis was used to analyze the expression changes of erythrocyte surface membrane proteins or transporters, erythrocyte membrane protein band 4.1 (EPB41), sphingosine‐1‐phosphate (S1P), glycolipid transfer protein (GLTP) and signal peptide peptidase‐like 2A (SPPL2A), in the blood of each group of mice.
MATERIALS AND METHODS
Experiment design
A total of 120 Swiss male mice aged 6–8 weeks were purchased and randomly divided into four groups with 30 mice in each group. Three groups of mice were fed a high‐fat and high‐sugar diet for 3–4 months, and then injected streptozotocin at 60 mg/kg for type 2 diabetes modeling for 7–10 days. By detecting the content of fasting blood glucose and fasting insulin in mice, the success of type 2 diabetes modeling was determined. Then, two groups of type 2 diabetes model mice were injected with fresh autologous blood and old autologous blood in the tail vein, respectively, and another group of type 2 diabetes mice as a control was injected with an equal volume of normal saline. After 1–3 days, when the living conditions of the mice were stable, half of the mice were killed by isopentane anesthesia, and the blood of the mice was collected from the abdominal aorta, and CD14+ monocytes were sorted by magnetic beads. The expression levels of phenotypic molecules CD16, CD32 and CD206 in CD14+ monocytes were analyzed by flow cytometry. The proportion of CD16+CD32+ macrophages and the proportion of CD206+DECTIN‐1+ macrophages were analyzed by flow cytometry. The other half of the mice were killed by isopentane anesthesia, and the blood of the mice was collected from the abdominal aorta. The effective oxygen‐carrying capacity (Q value), arterial blood partial pressure of oxygen at half saturation P50, 2,3‐DPG and Na+‐K+‐ATPase of red blood cells in the blood of each group of mice were detected and analyzed, respectively. The red blood cell osmotic fragility test analyzed the red blood cell osmotic fragility in the blood of each group of mice. Western blot analysis was used to analyze the expression changes of erythrocyte surface membrane proteins or transporters EPB41, S1P, GLTP and SPPL2A in the blood of each group of mice.
Flow cytometry analysis
Each group's cells were transferred to a 2‐mL centrifuge tube, spun for 5 min at 300g and the supernatant was discarded. Cells were fixed at 4°C for 30 min with 4% paraformaldehyde, then at room temperature for 10 min with 0.1% Triton X‐100. The cells were incubated at 4°C for 2 h with 200 μL of the primary antibody diluted with phenylbutyric acid, then centrifuged to remove the supernatant and washed with phosphate‐buffered saline. A total of 200 μL of fluorescein‐labeled secondary antibody diluted with phenylbutyric acid was added if needed, and incubated in the dark for 30 min at 4°C. Finally, the cells were resuspended in 500 μL phosphate‐buffered saline, placed in a flow tube and flow cytometry was used to detect them.
Detection of effective oxygen‐carrying capacity, P50, 2,3‐DPG and Na+‐K+‐ATPase
The collected mouse blood was centrifuged at 1200g for 10 min in a cryogenic centrifuge to separate and remove the plasma. Then, citrate, phosphate, dextrose, adenine‐formula 1 erythrocyte preservation solution was added to prepare a suspension erythrocyte solution. Fresh mouse plasma was added to the suspended erythrocyte solution, so that the erythrocyte concentration was 3.5 × 10¹²/L. Then, 3 mL of the sample was taken to be tested, and 20 μL of defoamer was added to it for use. Simulated arterial oxygen partial pressure state: O2 = 16 mL/min, CO2 = 3 mL/min, N2 = 120 mL/min and flow rate: 100 mL/min. The samples were aerated for 9 min at 37°C. A 1‐mL sample was drawn for blood gas analysis, and the oxygen content was recorded as S1. Simulated venous oxygen partial pressure state: O2 = 6 mL/min, CO2 = 3 mL/min, N2 = 160 mL/min and flow rate: 100 mL/min. The samples were equilibrated for 10 min, and aerated for 6 min at 37°C. A 1‐mL sample was drawn for blood gas analysis, and the oxygen content was recorded as S2. The Q value for red blood cells' effective oxygen‐carrying capacity was calculated using the formula Q = 20 × (S1−S2). When the oxygen partial pressure reached 100 mmHg, blood gas measurement showed the arterial blood partial pressure of oxygen at half saturation P50 value. The suspended erythrocyte fluid without plasma dilution was used as a sample, and the concentrations of the two were determined according to the operation of the detection kit for 2,3‐DPG and Na+‐K+‐ATPase.
Red blood cell osmotic fragility test
NaCl solutions with concentrations of 0.7, 0.65, 0.6, 0.55, 0.5, 0.45, 0.4, 0.35, 0.3 and 0.25% were prepared, respectively. Then, 2 mL of the prepared gradient NaCl solution was added to each test tube for use. The mouse blood taken out from each group was mixed with 3.8% sodium citrate solution at a volume ratio of 9:1. Then, 10 μL of mixed blood was dropped into each test tube to which the gradient NaCl solution had been added, and was left to stand for 1 h at room temperature, and then the transparency of each test tube was observed to determine whether hemolysis was present. If the lower layer of the test tube was cloudy red and the upper layer was colorless or light yellow liquid, it meant that the red blood cells had not been destroyed; if the lower layer of the test tube was cloudy red and the upper layer was transparent and light red, it showed that the red blood cells were partially dissolved, and the concentration of hypotonic saline solution that first appears in hemolysis is the maximum fragility of red blood cells; if the solution in the test tube was transparent red, it meant that all red blood cells were dissolved, which is called complete hemolysis, and the concentration of hypotonic salt solution that first causes complete hemolysis is the minimum fragility of red blood cells.
Western blot analysis
Cells were collected from each group and each six‐well plate was filled with 200 μL of cell lysate. The cells were sonicated and then lysed for 1 h on cold. At 4°C, the lysed cell sample was centrifuged for 15 min at 2000g. Then, in a clean centrifuge tube, the supernatant was transferred from the centrifuge tube. Protein concentration was measured using a glyceraldehyde 3‐phosphate dehydrogenase protein measurement kit. The protein samples that were analyzed were kept at −80°C. The protein loading concentration in western blot electrophoresis was 50 μg per well. The membrane was transferred and blocked after sodium dodecyl sulphate‐polyacrylamide gel electrophoresis. The primary antibodies against EPB41, S1P, GLTP and SPPL2A (1:500, anti‐human; Thermo Fisher, Waltham, MA, USA) were diluted to usage concentration. The samples were shaken overnight at 4°C in an incubator. After washing with phosphate‐buffered saline, the samples were incubated for 30 min at room temperature in the dark with the secondary antibody (1:1,000, anti‐human; Thermo‐Fisher, Waltham, MA, USA). Finally, the developer was utilized for photography and development.
Statistical analysis
The statistical method used in this project was the paired t‐test. The mean and standard deviation of the experimental results are given. SPSS 23.0 (IBM Corp., Armonk, NY, USA) was used to carry out the statistical analysis. Origin 2022 (OriginLab, Northampton, MA, USA) and Adobe Illustrator 2021 (San Jose, CA, USA) were used to create the figures.
RESULTS
The results of flow cytometry detection of the expression levels of phenotypic molecules CD16, CD32 and CD206 in CD14+ monocytes.
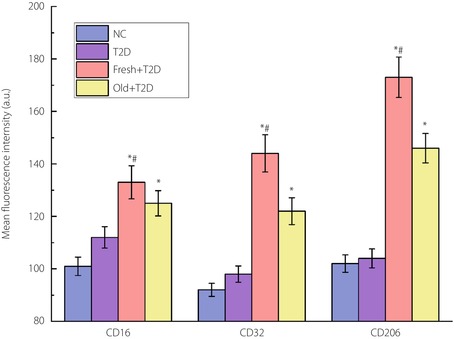
As can be seen in Figure 1, compared with the NC group, the contents of the three markers in the type 2 diabetes group did not change significantly. However, when autologous blood was transfused, the expression levels of the three markers were significantly increased. Compared with CD16 and CD32, the increase in CD206 expression was greater, indicating an increased proportion of M2‐type macrophages. Compared with old autologous blood transfusion, the effect of increasing macrophages brought by fresh autologous blood transfusion was more obvious.
Figure 1.
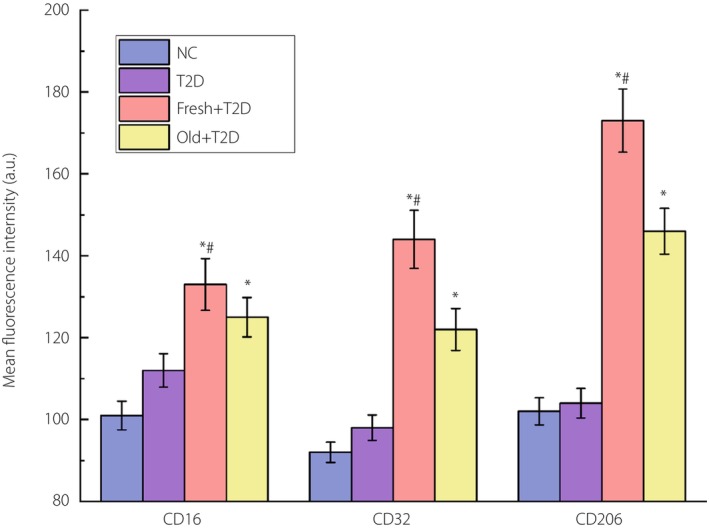
The results of flow cytometry analysis of the expression levels of phenotypic molecules CD16, CD32 and CD206 in CD14+ monocytes. *P < 0.05 (compared with the type 2 diabetes [T2D] group) and # P < 0.05 (compared with the reinfusion of old autologous blood [Old] + type 2 diabetes group). The number of samples per group is 30. Fresh, reinfusion of fresh autologous blood; NC, normal control.
The proportion of CD16+CD32+M1 macrophages and CD206+DECTIN‐1+M2 macrophages detected by flow cytometry.
It can be seen from Figure 2 that the increase of M1 and M2 macrophages in the four groups was completely consistent with the results of single‐labeled CD16, CD32 and CD206 detected by flow cytometry.
Figure 2.

The results of flow cytometry analysis of the proportion of CD16+CD32+M1 cells and CD206+DECTIN‐1+M2 cells. (a) Graph of raw results from flow cytometry analysis of M1 and M2 macrophages. (b) Statistical results of the proportion of M1 and M2 cells. *P < 0.05 (compared with the type 2 diabetes [T2D] group) and # P < 0.05 (compared with the reinfusion of old autologous blood [Old] + type 2 diabetes group). The number of samples per group is 30. Fresh, reinfusion of fresh autologous blood; NC, normal control.
The effective oxygen‐carrying capacity (Q value), P50, 2,3‐DPG and Na+‐K+‐ATPase of erythrocytes.
From Figure 3, we can see that with the return of fresh autologous blood to the type 2 diabetes mouse body, the effective oxygen‐carrying capacity of erythrocytes increased significantly, P50 decreased obviously and the concentration of 2,3‐DPG increased; that is, the oxygen affinity of erythrocytes increases rapidly, and the activity of Na+‐K+‐ATPase also increased. The results of the four values in the Fresh + type 2 diabetes group were all statistically different from those in the type 2 diabetes group and the Old + type 2 diabetes group with old autologous blood transfusion. This showed that fresh autologous blood transfusion in type 2 diabetes mice could indeed inhibit red blood cell damage and improve red blood cell performance.
Figure 3.
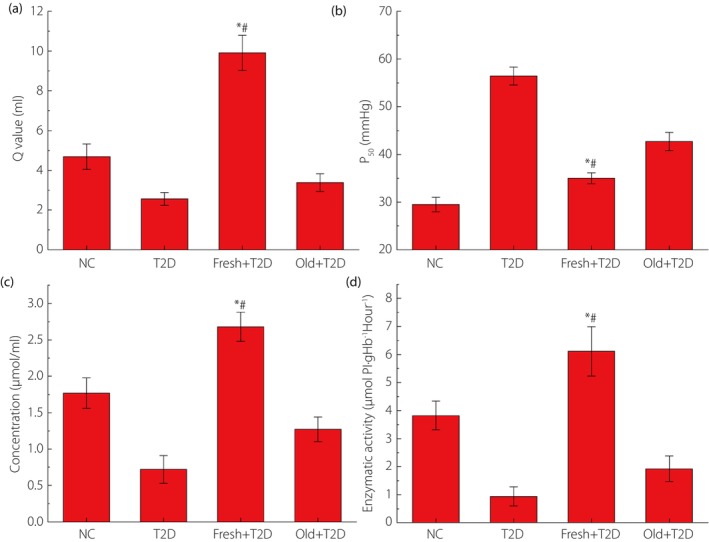
The results of the effective oxygen‐carrying capacity (Q value), P50, 2,3‐diphosphoglycerate and Na+‐K+‐ATPase of erythrocytes determined by taking the suspended erythrocyte solution as the sample. *P < 0.05 (compared with the type 2 diabetes [T2D] group) and # P < 0.05 (compared the reinfusion of old autologous blood [Old] + type 2 diabetes group). The number of samples per group is 30. Fresh, reinfusion of fresh autologous blood; NC, normal control.
The maximum osmotic fragility of red blood cells in the blood.
The results of the maximum osmotic fragility of red blood cells in the blood of each group of mice analyzed with hypotonic saline are shown in Figure 4. Reinfusion of fresh autologous blood in type 2 diabetes mice caused erythrocytes to shrink. The increased osmotic fragility of erythrocytes means that erythrocytes are more resistant to damage. Therefore, these experiments again proved that fresh autologous blood transfusion in type 2 diabetes mice could inhibit red blood cell damage.
Figure 4.
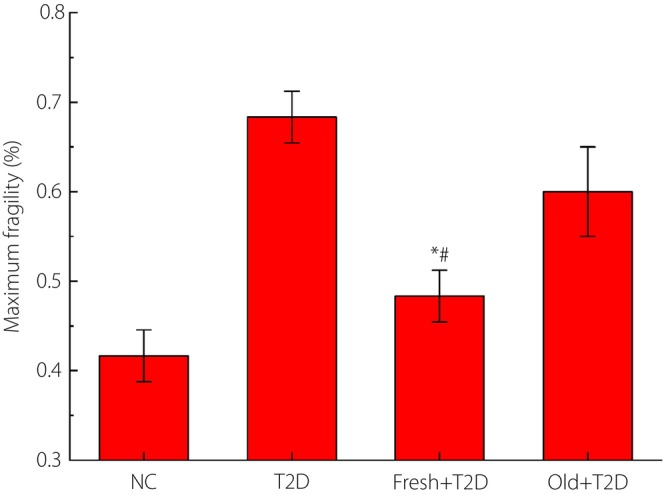
The results of the maximum osmotic fragility of red blood cells in the blood of each group of mice analyzed with hypotonic saline. *P < 0.05 (compared with the type 2 diabetes [T2D] group) and # P < 0.05 (compared with the reinfusion of old autologous blood [Old] + type 2 diabetes group). The number of samples per group is 30. Fresh, reinfusion of fresh autologous blood; NC, normal control.
Western blot analysis of the expression of erythrocyte surface membrane proteins, and transporters EPB41, S1P, GLTP and SPPL2A in the blood.
It can be seen from the results in Figure 5 that the expression of these four proteins could be significantly increased by returning fresh autologous blood to type 2 diabetes patients, which was even higher than that of the NC group. This was consistent with the aforementioned experimental results related to erythrocytes. This experiment proved at the molecular level that fresh autologous blood transfusion into type 2 diabetes patients could significantly inhibit red blood cell damage.
Figure 5.
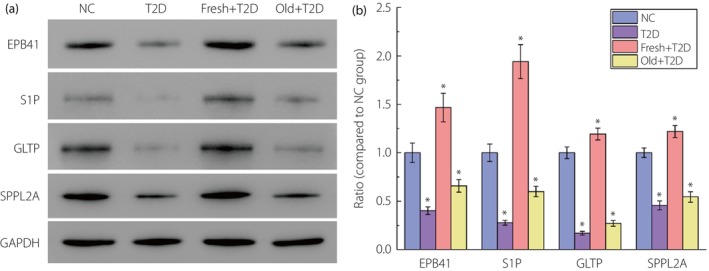
The results of western blot analysis of the expression of erythrocyte surface membrane proteins and transporters erythrocyte membrane protein band 4.1 (EPB41), sphingosine‐1‐phosphate (S1P), glycolipid transfer protein (GLTP) and signal peptide peptidase‐like 2A (SPPL2A) in the blood of each group of mice. All the data of the normal control (NC) group are consistent with the normal value. (a) Original gel electrophoresis image. (b) The ratio of protein EPB41, S1P, GLTP and SPPL2A expression compared with the NC group. *P < 0.05 compared with the NC group. The number of samples per group is 30. Fresh, reinfusion of fresh autologous blood; Old, reinfusion of old autologous blood.
DISCUSSION
CD16 and CD32 are M1 macrophage markers, whereas CD206 is an M2 macrophage marker. Compared with CD16 and CD32, the increase in CD206 expression was greater, indicating an increased proportion of M2‐type macrophages. This showed that fresh autologous blood transfusion to the body of mice with type 2 diabetes can significantly increase the expression of M2 macrophages, thereby inhibiting the inflammatory response and reducing red blood cell damage. The increase of M1 and M2 macrophages in the four groups was completely consistent with the results of single‐labeled CD16, CD32 and CD206 detected by flow cytometry. This directly proved the accuracy of the aforementioned analysis and conclusion; that is, the reinfusion of fresh autologous blood to the body of mice with type 2 diabetes could inhibit red blood cell damage.
The Q value of the effective oxygen‐carrying capacity is the most intuitive index to evaluate the oxygen‐carrying capacity of red blood cells. The change of the oxygen‐carrying capacity of red blood cells can be evaluated by calculating the effective oxygen carrying capacity. The higher the Q value, the stronger the oxygen‐carrying capacity of red blood cells 15 . Arterial blood partial pressure of oxygen at half saturation P50 is the partial pressure of oxygen at 50% oxygen saturation of hemoglobin, reflecting the oxygen affinity of hemoglobin. The larger the P50 value, the smaller the oxygen affinity, the weaker the ability of Hb to bind with O2 and the stronger the ability to release oxygen. Conversely, the greater the oxygen affinity, the stronger the ability of Hb to bind with O2, and the weaker the ability to release oxygen. 2,3‐DPG also plays an important role in regulating the affinity of Hb and O2. When the concentration of 2,3‐DPG increases, the affinity of Hb for O2 decreases, and the oxygen dissociation curve shifts to the right; when the concentration of 2,3‐DPG decreases, the affinity of Hb for O2 increases, and the oxygen dissociation curve shifts to the left. The mechanism might be that 2,3‐DPG forms a salt bond with the Hbβ chain, which makes Hb become T‐type. In addition, 2,3‐DPG can increase the concentration of H+ and affect the affinity of Hb for O2 through the Bohr effect. Na+‐K+‐ATPase is a transmembrane carrier protein for ion transport in mammalian cell membranes, which can catalyze the hydrolysis of adenosine triphosphate to generate adenosine diphosphate and inorganic phosphorus. Na+‐K+‐ATPase requires O2 to directly participate in the reaction in the catalytic process, so its activity is positively correlated with the oxygen‐carrying capacity of red blood cells 16 . We can see that with the return of fresh autologous blood to the type 2 diabetes mouse body, the effective oxygen‐carrying capacity of erythrocytes increased significantly, P50 decreased obviously and the concentration of 2,3‐DPG increased; that is, the oxygen affinity of erythrocytes increases rapidly, and the activity of Na+‐K+‐ATPase also increased. The results of the four values in the Fresh + type 2 diabetes group were all statistically different from those in the type 2 diabetes group and the Old + type 2 diabetes group with old autologous blood transfusion. This showed that fresh autologous blood transfusion in type 2 diabetes mice could indeed inhibit red blood cell damage and improve red blood cell performance.
Osmotic fragility of red blood cells refers to the resistance of red blood cells to various concentrations of hypotonic solutions. In hypotonic saline, water penetrates cell membranes, causing red blood cells to gradually swell and be destroyed. The permeability of erythrocytes mainly depends on the surface area to volume ratio of erythrocytes. Those with a large surface area and a small volume have a greater resistance to the salt solution, and vice versa. Spheroids, with a reduced surface area to volume ratio, are particularly sensitive to hypotonic solutions, and have a marked increase in fragility. The increased osmotic fragility of erythrocytes means that erythrocytes are more resistant to damage. Therefore, these experiments again proved that fresh autologous blood transfusion in type 2 diabetes mice could inhibit red blood cell damage.
EPB41 is a key component of the erythrocyte membrane skeleton's structure. By stabilizing the spectrin–actin connection, it serves a vital function in regulating membrane physical properties, such as mechanical stability and deformability 17 . S1P is released by blood cells to regulate immune function and vascular function, and is required for the transport of immune cells, such as T cells and B cells, in the blood circulation 18 . GLTP catalyzes the transfer of various glycolipids between membranes and accelerates the transfer of certain glycosphingolipids, but it does not catalyze the transfer of phospholipids 19 . In the hydrophobic plane of the membrane, SPPL2A is an intramembrane‐cleaving aspartic protease that cleaves type II membrane signal peptides. It is crucial in the control of both innate and adaptive immunity 20 . These proteins are closely related to erythrocytes, and their expression levels are positively correlated with the content of erythrocytes in blood. It can be seen from the results in Figure 5 that the expression of these four proteins could be significantly increased by returning fresh autologous blood to type 2 diabetes patients, which was even higher than that of the NC group. This was consistent with the aforementioned experimental results related to erythrocytes. This experiment proved at the molecular level that fresh autologous blood transfusion into type 2 diabetes patients could significantly inhibit red blood cell damage.
In the present study, a rigorous animal model design was established, and experiments at the cellular and molecular levels were carried out to successfully verify that the reinfusion of fresh autologous blood into the body of patients with type 2 diabetes can induce macrophage polarization to M2, thereby inhibiting red blood cell damage. This provides new potential strategies for treatment and symptom relief in patients with type 2 diabetes. Nevertheless, more in‐depth studies are needed to refine our conclusions to better understand the relationship between autologous blood transfusion and type 2 diabetes treatment. We will carry out more rigorous and abundant in vivo and in vitro experiments in the future, and provide more solid proof for our conclusions.
DISCLOSURE
The authors declare no conflict of interest.
Approval of the research protocol:N/A.
Informed consent: N/A.
Registry and the registration no. of the study/trial: N/A.
Animal studies: All animal experiments were performed according to the guidelines of the animal ethical organization and obtained the permission of The Shanghai Gongli Hospital, Naval Military Medical University.
ACKNOWLEDGMENTS
We acknowledge everyone for their helpful contributions in this paper. The project was supported by the Key Disciplines Group Construction Project of Pudong Health Bureau of Shanghai (PWZxq2022‐05) and Emerging Interdisciplinary Project of Shanghai Pudong New Area Health Commission (PWXx2020‐05).
REFERENCES
- 1. Tuomi T, Santoro N, Caprio S, et al. The many faces of diabetes: A disease with increasing heterogeneity. Lancet 2014; 383: 1084–1094. [DOI] [PubMed] [Google Scholar]
- 2. Wu Y, Ding Y, Tanaka Y, et al. Risk factors contributing to type 2 diabetes and recent advances in the treatment and prevention. Int J Med Sci 2014; 11: 1185–1200. [DOI] [PMC free article] [PubMed] [Google Scholar]
- 3. Guasch‐Ferre M, Hruby A, Toledo E, et al. Metabolomics in prediabetes and diabetes: A systematic review and meta‐analysis. Diabetes Care 2016; 39: 833–846. [DOI] [PMC free article] [PubMed] [Google Scholar]
- 4. Weisel JW, Litvinov RI. Red blood cells: The forgotten player in hemostasis and thrombosis. J Thromb Haemost 2019; 17: 271–282. [DOI] [PMC free article] [PubMed] [Google Scholar]
- 5. Lewis SM, Williams A, Eisenbarth SC. Structure and function of the immune system in the spleen. Sci Immunol 2019; 4: eaau6085. [DOI] [PMC free article] [PubMed] [Google Scholar]
- 6. Secomb Timothy W. Blood flow in the microcirculation. Annu Rev Fluid Mech 2017; 49: 443–461. [Google Scholar]
- 7. Dizdaroglu M, Jaruga P. Mechanisms of free radical‐induced damage to DNA. Free Radic Res 2012; 46: 382–419. [DOI] [PubMed] [Google Scholar]
- 8. Kehrer JP, Klotz L‐O. Free radicals and related reactive species as mediators of tissue injury and disease: Implications for health. Crit Rev Toxicol 2015; 45: 765–798. [DOI] [PubMed] [Google Scholar]
- 9. Mehla K, Singh PK. Metabolic regulation of macrophage polarization in cancer. Trends Cancer 2019; 5: 822–834. [DOI] [PMC free article] [PubMed] [Google Scholar]
- 10. Saradna A, Do DC, Kumar S, et al. Macrophage polarization and allergic asthma. Transl Res 2018; 191: 1–14. [DOI] [PMC free article] [PubMed] [Google Scholar]
- 11. Wang N, Liang H, Zen K. Molecular mechanisms that influence the macrophage M1‐M2 polarization balance. Front Immunol 2014; 5: 614. [DOI] [PMC free article] [PubMed] [Google Scholar]
- 12. Atri C, Guerfali FZ, Laouini D. Role of human macrophage polarization in inflammation during infectious diseases. Int J Mol Sci 2018; 19: 1801. [DOI] [PMC free article] [PubMed] [Google Scholar]
- 13. Funes SC, Rios M, Escobar‐Vera J, et al. Implications of macrophage polarization in autoimmunity. Immunology 2018; 154: 186–195. [DOI] [PMC free article] [PubMed] [Google Scholar]
- 14. Cao H, Ou J, Chen L, et al. Dietary polyphenols and type 2 diabetes: Human study and clinical trial. Crit Rev Food Sci Nutr 2019; 59: 3371–3379. [DOI] [PubMed] [Google Scholar]
- 15. Kanias T, Acker JP. Biopreservation of red blood cells‐the struggle with hemoglobin oxidation. FEBS J 2010; 277: 343–356. [DOI] [PubMed] [Google Scholar]
- 16. Grant GA. D‐3‐phosphoglycerate dehydrogenase. Front Mol Biosci 2018; 5: 110. [DOI] [PMC free article] [PubMed] [Google Scholar]
- 17. Rangel L, Lospitao E, Ruiz‐Saenz A, et al. Alternative polyadenylation in a family of paralogous EPB41 genes generates protein 4.1 diversity. RNA Biol 2017; 14: 236–244. [DOI] [PMC free article] [PubMed] [Google Scholar]
- 18. Kurano M, Yatomi Y. Sphingosine 1‐phosphate and atherosclerosis. J Atheroscler Thromb 2018; 25: 16–26. [DOI] [PMC free article] [PubMed] [Google Scholar]
- 19. Mishra SK, Stephenson DJ, Chalfant CE, et al. Upregulation of human glycolipid transfer protein (GLTP) induces necroptosis in colon carcinoma cells. Biochim Biophys Acta Mol Cell Biol Lipids 2019; 1864: 158–167. [DOI] [PMC free article] [PubMed] [Google Scholar]
- 20. Kong X‐F, Martinez‐Barricarte R, Kennedy J, et al. Disruption of an antimycobacterial circuit between dendritic and helper T cells in human SPPL2a deficiency. Nat Immunol 2018; 19: 973–985. [DOI] [PMC free article] [PubMed] [Google Scholar]


