

Summary
Whole-genome association studies of complex diseases hold great promise to identify systematically genetic loci that influence one’s risk of developing these diseases. However, the polygenic nature of the complex diseases and genetic interactions among the genes pose significant challenge in both experimental design and data analysis. High-density genotype data make it possible to identify most of the genetic loci that may be involved in the etiology. On the other hand, utilizing large number of statistic tests could lead to false positives if the tests are not adequately adjusted. In this paper, we discuss a two-stage method that sequentially applies a generalized linear model (GLM) and principal components analysis (PCA) to identify genetic loci that jointly determine the likelihood of developing disease. The method was applied to a pilot case-control study of esophageal squamous cell carcinoma (ESCC) that included 50 ESCC patients and 50 neighborhood-matched controls. Genotype data were determined by using the Affymetrix 10K SNP chip. We will discuss some of the special considerations that are important to the proper interpretation of whole genome-wide association studies, which include multiple comparisons, epistatic interaction among multiple genetic loci, and generalization of predictive models.
Keywords: whole-genome association study, SNP, SNP chip, genotyping, complex disease, genetic interaction, esophageal squamous cell carcinoma (ESCC), generalized linear model (GLM), principal components analysis (PCA)
1. Introduction
Human diseases are generally classified into two categories: Mendelian disease versus complex disease. These two classes of disease have many distinct genetic and phenotypic characteristics (1). Mendelian diseases are primarily determined by single genes. They are usually rare and occur in a family setting. Mendelian genes can be mapped by linkage analysis and are identified through positional cloning. Causative mutations are often located within the conserved regions of the affected gene, and these mutations usually change the function of the protein (2). In contrast, complex diseases are caused by the combined effect of many genes, each of which has a small to moderate effect. Complex diseases are usually common, and examples include cardiovascular diseases, cancer, and diabetes. The complex nature of interactions among the multiple genes and between genes and environmental factors imply that a single locus is unlikely to have enough effect on the risk of the disease. Thus, the linkage analysis approach is less effective. Attention has now been shifted to strategies such as association or linkage disequilibrium (LD) studies that attempt to identify an association between a genetic marker and a disease susceptibility locus (3,4).
LD can be generated by mutation, migration, selection, and genetic drift. However, LD begins to decay once it is generated. LD between unlinked loci decays rapidly. The rate of LD decay slows down when the two loci are linked. When the two loci are tightly linked, LD can persist through many generations. It is this type of LD that is useful for identifying disease genes. However, a spurious association can exist due to population admixture, sample selection bias, and LD generated from a recent event. So care needs to be taken to reduce the spurious association due to unlinked loci by experimental design and data analysis. Association due to linked loci is more powerful than linkage analysis since such linkage disequilibrium is restricted to small regions of the genome, usually a few kb to 50–60 kb, depending on genetic loci and study population. These regions are also referred to as haplotype or LD blocks.
With the completion of the human genome sequence and the availability of high-throughput genotype technologies, genome wide association studies hold great promise for systematically identifying genetic loci that determine the etiology of complex diseases (5). Current efforts directed to the identification of disease-causing genes have now shifted from Mendelian diseases to complex diseases. Although the search of Mendelian genes has always focused predominantly on mutations that result from non-synonymous substitution of amino acids, this does not have to be the case for SNPs that affect complex diseases.
Single nucleotide polymorphisms (SNPs) may affect complex diseases through their effects on gene expression, and some examples of this are provided in several recent studies (6–8). Currently, there are more than 12 million SNPs deposited in GenBank (http://www.ncbi.nih.gov/SNP/), 6.5 million of which have been validated. To facilitate gene discovery, the HapMap project was initiated to expedite the search for the genes that predispose individuals to complex diseases (9,10). The genetic resources available from the HapMap project provide information on allele frequency, Hardy–Weinberg equilibrium (HWE), linkage disequilibrium (LD), and haplotype structure. They are useful for selecting TagSNPs for association studies (11). Chapter 3 provides further information on the use of HapMap as a resource.
Esophageal squamous cell carcinoma (ESCC) is one of the most common malignancies in the Chinese population (12). ESCC showed familial aggregation in the high-risk regions in northern China, indicating that a genetic influence plays a role in the etiology of this cancer. Epidemiology studies suggest that ESCC is a complex disease caused by multiple genetic loci. We previously published a pilot ESCC case-control genome-wide association study using the Affymetrix 10K SNP array (13). Here, we describe the experimental design and statistical analysis that are important for a genome-wide association study. We describe some of the special considerations concerning the proper interpretation of a whole genome-wide association study, which include multiple comparisons, gene–gene interactions, and generalization of predictive models.
2. Experimental Design and Protocol
Patients and controls in this pilot case-control study of ESCC were described previously (13). We had 50 ESCC patients and 50 neighborhood-matched controls. Age-, sex-, and neighborhood-matched controls were selected and evaluated within 6 months of the case being diagnosed. The “neighborhood” in China refers to the residence blocks within communities. All individuals and their ancestors lived in Shanxi Province. These individuals were selected to ensure a more homogeneous population structure. Both gender and age are known to affect ESCC. Since our primary goal was to identify genetic risk factors, we selected only male individuals with matched age to remove these confounding factors. The other potential confounding factors included diet, smoking, and alcohol use. Therefore, these were included in the generalized linear model (GLM) as covariates. We found little evidence for any effect due to diet or smoking for most of the SNPs in GLM analyses. These procedures in sample selection and data analyses aim to reduce spurious associations due to sample bias or non-genetic confounding factors so that we can enrich the linkage disequilibrium due to a linked locus. More discussion can be found below (see 3. Data Analysis and Note 1).
The Affymetrix 10K SNP chip (Affymetrix GeneChip® Mapping 10K Array Set) was designed for simultaneous typing of 11,555 SNPs in the human genome (14). The mean distance between SNPs is 210 kb and the average heterozygosity for these SNPs is 0.37. The genotype call is determined by the relative intensity from the two alleles, designated as A allele and B allele. More recently, Affymetrix released higher-density SNP chips (15) including a 100K chip and a 500K SNP chip (Affymetrix GeneChip® Mapping 100K and 500K Array Sets respectively). The mean distance between SNPs is 23.6 kb and 5.8 kb for the 100K SNP chip and 500K SNP chip, respectively. The average heterozygosity of the SNPs for both 100K and 500K chips is 0.30. Other high-throughput genotyping platforms include Illumina Sentrix® Human-1 (109K), HumanHap300 (317K), and HumanHap550 (555K) BeadChips (16,17). See more discussion in Note 2.
The genotyping experiment using the Affymetrix 10K SNP chip was described previously (13). Our more recent genotype data have been generated on higher density SNP chips including Affymetrix 100K and 500K SNP chips.
3. Data Analysis
The 10K SNP chip experiment generated 11,555 genotype data for each sample. We removed 1,291 SNPs because they failed in one of the following quality control steps. The SNP
could not be mapped to the NCBI human genome assembly,
was homozygous in all cases or all controls, or
deviated from Hardy-Weinberg equilibrium (HWE) in the controls. see more discussion on HWE criterion in Note 3.
Our data analysis strategy is illustrated in Fig. 1. We developed a two-stage sequential selection protocol to identify systematically genetic loci that influence an individual’s risk of developing disease. A two-stage method was initially suggested as a more cost effective approach for the genomic screen (18). In stage I, a large number of markers was genotyped on a subset of the samples. In stage II, additional markers in the interesting regions spanning the markers selected from stage I exceeding a certain predefined significance level were genotyped on the expanded set of the samples. Recently, the two-stage method was applied to a whole-genome association study (19) and it was proposed to have greater power to detect two-locus gene interactions that influence complex diseases (20). More discussion on the two-stage method can be found in Note 4.
Fig. 1.

Two-stage selection method for a whole genome association study. The details of the two-stage method are described in the main text.
Our two-stage method extends to multi-locus gene interactions. The strategy is based on the premise that complex disease is caused by combining quantitative effects from multiple genetic loci, each of which has a small effect, but jointly they can account for a significant portion of the risk factors for the disease (13). The stage I step intends to identify each genetic locus that may contribute to the genetic etiology of the disease. We used a GLM to identify SNPs that may affect disease. With the GLM approach, we modeled the probability of being a case based on each SNP plus other potential explanatory variables, which include (family history positive, yes/no); (alcohol use, yes/no); (tobacco use, yes/no); (pickled vegetable consumption, yes/no); and (age, continuous):
The three variables, tobacco use, pickled vegetable and age, were insignificant in the GLMs for nearly all SNPs and they were dropped in further analysis. Using a GLM for each SNP plus the two covariates (family history and alcohol use), we computed the P-value of the GLM based on the difference between the null deviance D0 and residual deviance D1 using the chi-square goodness-of-fit test. The chi-square statistic is D0–D1 with 3 degrees of freedom.
A whole genome-wide association study requires a correction for multiple comparisons. One possible adjustment for multiple testing is the use of Bonferroni adjustment, which was used in our original work. However, our more recent studies suggested that Bonferroni adjustment may not be desirable for the following reasons.
The reduction of type I error associated with the Bonferroni adjustment increases the type II error.
With the increase in SNP density such as the Affymetrix 500K SNP chip, it is unlikely to attain significant P-values with Bonferroni adjustment given limited sample sizes.
If we argue that each individual SNP has a small effect on disease, we should look for SNPs with moderate effect instead of strong effect (extremely small P-value) when analyzed for each SNP. More discussion can be found in Note 5.
Stage II in our method aims to identify interacting genetic loci, which affect disease through the joint effect of multiple genes. If we look for joint effects of genetic interactions among multiple genetic loci, each of which has a small and quantitative effect, we would naturally seek a factor that can combine these genetic loci. One solution comes from the statistical approach known as principal components analysis (PCA). If the phenotypic variation (case versus control) is primarily determined by the genetic factor, which is the result of interaction among multiple genetic loci, we would expect to find interaction of these loci affecting the likelihood of developing disease. In other words, we will find co-variation among these genetic loci in determining disease state. Such co-variation can be captured by PCA and results in clustering of samples into cases and controls. This was exactly what we found in our previous study (13) and in the current analysis (Fig. 3).
Fig. 3.

Two clusters of case and control samples analyzed by PCA. A: 9,739 SNPs selected by P-value cutoff of 4.87 × 10⁻⁴ in GLM were used for PCA analysis. B: 493 SNPs selected by P-value cutoff of 7.72×10⁻⁶ in GLM were used for PCA analysis. This analysis has the best performance for accuracy, specificity, and sensitivity. C: 278 SNPs selected by P-value cutoff of 4.87×10⁻⁶ in GLM were used for PCA analysis, which corresponds to a Bonferroni adjusted significance level of 0.05. D: 15 SNPs selected by P-value cutoff of 4.87 × 10⁻⁷ in GLM were used for PCA analysis. E – cases; N – controls.
An effective way to evaluate this two-stage selection method is to use the PCA model to develop a classifier, and to assess the performance of the classifier. We used PCA to visualize sample distribution in a two-dimensional space defined by PC1 and PC2. In our analysis, case and control samples formed the two cluster structures by PC1, which can be used to construct a classifier to separate cases from controls. Our classifier is defined here as case if PC1 ≤ 0, but control if PC1 > 0. Performance of the classifier can be evaluated for accuracy as defined by (Tp+Tn)/100, sensitivity defined Tp/(Tp+Fn), and specificity defined by Tn/(Fp+Tn), where Tp and Tn are the numbers of true positives and true negatives, Fp and Fn are the numbers of false positives and false negatives.
We have discussed the need to have a moderate threshold in stage I for selecting SNPs instead of an extremely stringent P-value cutoff in GLM analysis to accommodate interactions among multiple genetic loci that affect the complex disease. To find a proper threshold, we ordered the SNPs with P-values from GLM and selected SNPs with P-values smaller than the cutoffs indicated in Table 1. We carried out PCA analysis using the number of SNPs indicated in Table 1. The performance of the classifier was shown in Fig. 2. Four examples of samples projected in the 2-dimension space defined by PC1 and PC2 are shown in Fig. 3. When nearly all SNPs were used in PCA (Fig. 3A), controls and cases intermingled with each other, indicating a homogenous population in this study. With a progressive increase in stringency in selecting SNPs (smaller P-value cutoff and fewer numbers of SNPs selected), we saw an increase in discrimination of case versus control in PC1 and corresponding increases in accuracy, sensitivity, and specificity (Fig. 2 and Table 1). The performance reached maximum at the P-value cutoff of 7.72 × 10⁻⁶, which yielded 493 SNPs with P-values smaller than the cutoff (Fig. 3B and Table 1). Further decrease in P-value cutoff resulted in less discrimination between case and control, and reduction in the performance. This is also true for the P-value cutoff that corresponded to a Bonferroni adjustment (Fig. 3C and Table 1). The P-value cutoff at 4.87 × 10⁻⁶ (p=0.05 after Bonferroni adjustment) yielded 278 genes. Further decrease in the number of SNPs generated even poorer performance (Fig. 3D and Table 1). The best performance with the P-value cutoff of 7.72 × 10⁻⁵ included 493 genes, which appear to capture most of the genes that are involved in the gene–gene interaction and contributing to disease. More discussion of the performance of the classifier can be found in Note 5. Furthermore, we can find the genetic risk loci from the SNPs with high loading (coefficient) in the first principal component (PC1). The absolute values of loading in PC1 are plotted in Fig. 4 with descending order of loading on x-axis. The curve shows a steep drop in loadings and it levels off on the right side of the tail. This pattern suggests that we should look for complex disease genes in those SNPs with a large loading value (about 30 SNPs in this analysis) (see more discussion on Note 6). In our previous study, we used the permutation test to evaluate the performance of the PCA model (13). A more effective validation test should be done on a different set of samples. We are currently pursuing validation of selected SNPs in large numbers of external samples.
Table 1.
Performance of the classifier based on PCA models. The definition of the terms can be found in the legend to Fig. 2 The P-value cutoffs used to select SNPs from GLM are provided here along with the number of SNPs selected
| Number of SNPs | P-value cutoff | Accuracy | Sensitivity | Specificity |
|---|---|---|---|---|
|
| ||||
| 15 | 4.87E-07 | 0.80 | 0.82 | 0.78 |
| 31 | 7.72E-07 | 0.86 | 0.88 | 0.84 |
| 51 | 1.22E-06 | 0.86 | 0.84 | 0.88 |
| 93 | 1.94E-06 | 0.91 | 0.90 | 0.92 |
| 161 | 3.07E-06 | 0.93 | 0.94 | 0.92 |
| 278* | 4.87E-06 | 0.94 | 0.94 | 0.94 |
| 493 | 7.72E-06 | 0.98 | 0.98 | 0.98 |
| 788 | 1.22E-05 | 0.97 | 0.98 | 0.96 |
| 1,352 | 1.94E-05 | 0.98 | 1.00 | 0.96 |
| 2,459 | 3.07E-05 | 0.97 | 0.98 | 0.96 |
| 3,393 | 3.90E-05 | 0.96 | 0.98 | 0.94 |
| 3,912 | 4.30E-05 | 0.96 | 0.98 | 0.94 |
| 4,860 | 4.87E-05 | 0.94 | 0.94 | 0.94 |
| 6,225 | 6.00E-05 | 0.86 | 0.88 | 0.84 |
| 6,604 | 6.50E-05 | 0.85 | 0.86 | 0.84 |
| 6,950 | 7.00E-05 | 0.86 | 0.88 | 0.84 |
| 7,444 | 7.72E-05 | 0.78 | 0.80 | 0.76 |
| 8,621 | 0.000122376 | 0.56 | 0.58 | 0.54 |
| 9,226 | 0.000193953 | 0.59 | 0.56 | 0.62 |
| 9,545 | 0.000307394 | 0.56 | 0.58 | 0.54 |
| 9,739 | 0.000487187 | 0.54 | 0.54 | 0.54 |
Bonferroni-adjusted significance level of 0.05.
Fig. 2.
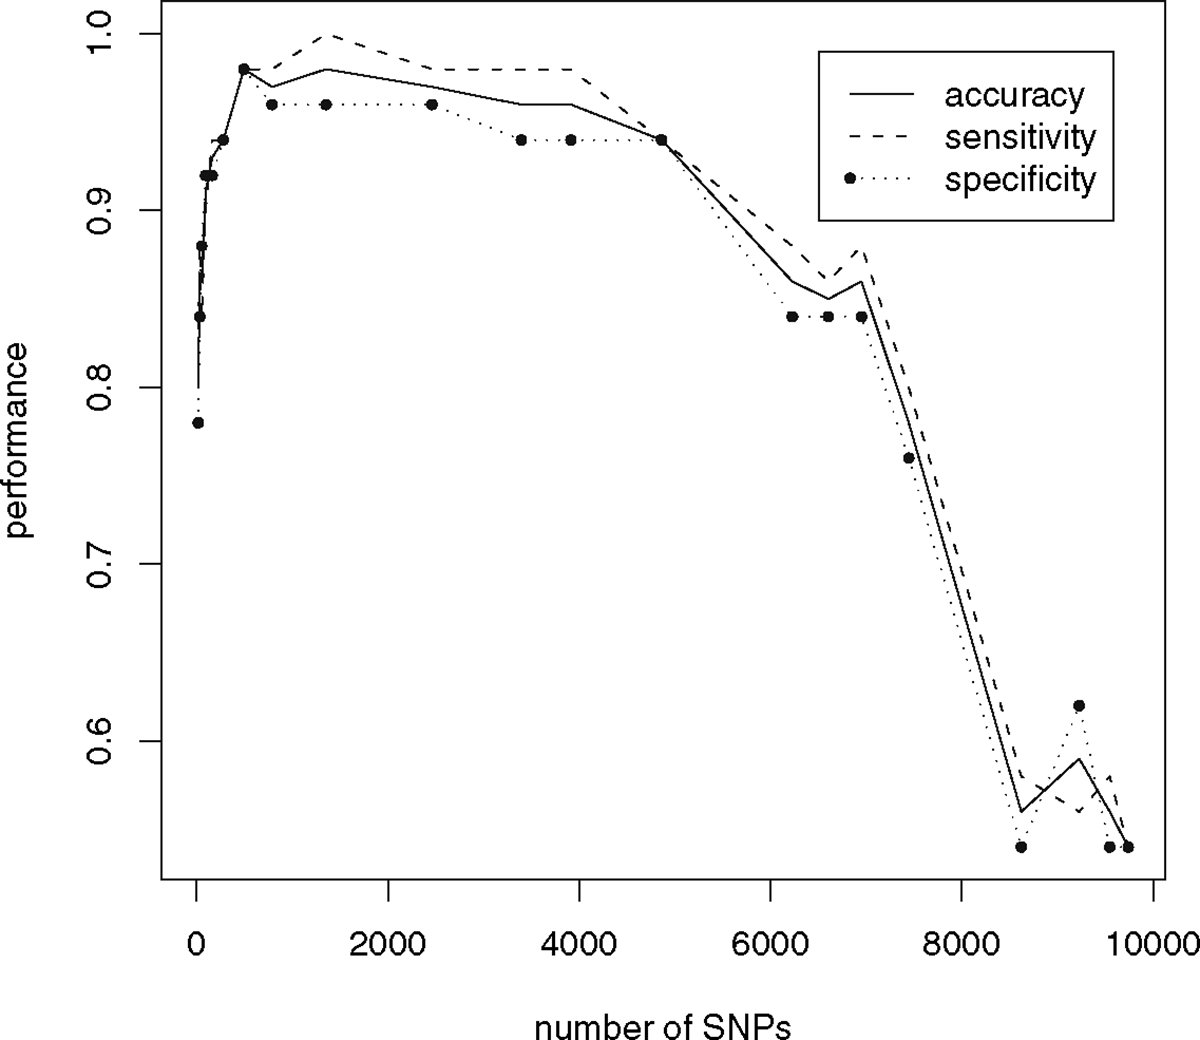
Performance of the classifier based on PCA models. Three performance indices—accuracy, specificity, and sensitivity, are evaluated for classification of samples by the PC1 score. Samples are classified as control if PC1 > 0. Samples are classified as case if PC1 ≤ 0. The same data are shown in Table 1 with more details.
Fig. 4.

Distribution of the loadings in PC1. The absolute value of the loading (coefficient) for SNP in PC1 is plotted according to the descending order. Note that decrease in the absolute value of the loadings is very steep initially and the curve flattens gradually.
In conclusion, our two-stage sequential selection method provides an effective strategy systematically to identify susceptibility genes for complex diseases through whole genome-wide association study.
4. Notes
Our goal in this pilot case-control study was to identify genes important for the genetic etiology of ESCC. We selected individuals with almost identical features in environmental exposures as well as demographic measures. Although small variations in those environmental effects can be controlled for in GLM analysis, it is more powerful to identify genetic factors if variations in non-genetic factors are kept minimal. If the purpose is to identify gene–environment interactions, we can introduce variations in environmental exposures in cases and controls in a balanced manner. We can identify gene–environment interactions with GLM, and require small P-values for the model, and moderate to small P-values for the coefficients of both SNP and environmental factor.
In addition to the standard arrays, both Affymetrix and Illumina offer custom arrays for high-throughput genotyping of selected SNPs. For genotyping of large number of samples with limited number of SNPs, it is more cost effective to use genotyping platforms such as Applied Biosystems Taqman®, SNaPshot™, and SNPlex™.
We found that the majority of SNPs with deviation from HWE were due to either low minor allele frequency or the fact that the SNP sequence was present in multiple genomic loci or low signal for genotype call. We evaluated the signal of the genotype call by t-test for the quantity of (PM-MM) across 20 probes for the SNP. Here PM denotes perfect match probe and MM denotes mismatch probe. The removal of those SNP with deviation from HWE reduces false positives. We used a P-value of 0.01 as a cutoff in the chi-square test for HWE.
There are many different versions of the two-stage method. The general concept is to perform genome-wide genotyping on high density SNP chips on moderate numbers of samples, usually in the range of a few hundred. Stage II focuses on interesting regions selected from stage I and involves denser genotyping with higher-density SNPs in specific regions, and on a large set of samples. The concept of a two-stage method is evolving to include selection of individual SNPs in stage I, and selection of two-locus gene interactions in stage II in whole-genome-wide association studies for complex diseases. In this paper, our two-stage approach is related to the second definition of the two-stage method. Furthermore, our method can also be applied to multi-locus gene interactions in stage II.
Our selection criteria in stage I rely on both a P-value from the GLM model and a P-value for the coefficient of the SNP (13). However, in the current analysis, we found that we could simply choose a moderate P-value from the GLM model and achieve very good performance for the PCA classifier. If the primary interest is in the genetic factor, we should pay more attention to the SNP coefficient. If the primary interest is in the gene-environment interaction, we need to pay more attention to both SNP coefficient and coefficient for the environmental factor. Case and control samples will need to include variation in the environmental factor. We recommend trying several different criteria by considering GML model and/or coefficients at different P-value cutoffs. The performance of selection criteria can be evaluated by the PCA classifier as described in this paper.
The curve shown in Fig. 4 indicates a fairly complex dataset. The loadings show gradual decrease. The ideal situation would be a sharp drop in the absolute value of the loading for ~10–20 SNPs. Those SNPs can be further analyzed in the follow-up validation experiment
Acknowledgments
We would like to thank Drs. Alisa Goldstein and Ying Hu for discussion. This research was supported by the Intramural Research Program of the NIH, the National Cancer Institute, the Center for Cancer Research, and the Division of Cancer Epidemiology and Genetics.
Abbreviations:
- ESCC
esophageal squamous cell carcinoma
- GLM
generalized linear model
- HWE
Hardy Weinberg equilibrium
- LD
linkage disequilibrium
- PCA
principal components analysis
- PC1
first principal component
- SNP
single nucleotide polymorphism
References
- 1.Botstein D, and Risch N (2003) Discovering genotypes underlying human-phenotypes: past successes for mendelian disease, future approaches for complex disease. Nat. Genet. 33(Suppl), 228–237. [DOI] [PubMed] [Google Scholar]
- 2.Miller MP, and Kumar S (2001) Understanding human disease mutations through the use of interspecific genetic variation. Hum. Mol. Genet. 10, 2319–2328. [DOI] [PubMed] [Google Scholar]
- 3.Lander ES (1996) The new genomics: global views of biology. Science 274, 536–539. [DOI] [PubMed] [Google Scholar]
- 4.Risch N, and Merikangas K (1996) The future of genetic studies of complex human diseases. Science 273, 1516–1517. [DOI] [PubMed] [Google Scholar]
- 5.Risch NJ (2000) Searching for genetic determinants in the new millennium. Nature 405, 847–856. [DOI] [PubMed] [Google Scholar]
- 6.Campbell DB, Sutcliffe JS, Ebert PJ, Militerni R, Bravaccio C, Trillo S, et al. (2006) From the cover: a genetic variant that disrupts MET transcription is associated with autism. Proc. Natl. Acad. Sci. U S A 103, 16834–16839. [DOI] [PMC free article] [PubMed] [Google Scholar]
- 7.Dewan A, Liu M, Hartman S, Zhang S, Liu DT, Zhao C, et al. (2006) HTRA1 promoter polymorphism in wet age-related macular degeneration. Science 314, 989–992. [DOI] [PubMed] [Google Scholar]
- 8.Yang Z, Camp NJ, Sun H, Tong Z, Gibbs D, Cameron J, et al. (2006) A Variant of the HTRA1 gene increases susceptibility to age-related macular degeneration. Science 314, 992–993. [DOI] [PubMed] [Google Scholar]
- 9.International HapMap Consortium. (2003) The international HapMap project. Nature 426, 789–796. [DOI] [PubMed] [Google Scholar]
- 10.International HapMap Consortium. (2005) A haplotype map of the human genome. Nature 437, 1299–1320. [DOI] [PMC free article] [PubMed] [Google Scholar]
- 11.Carlson CS, Eberle MA, Rieder MJ, Yi Q, Kruglyak L, and Nickerson L (2004) Selecting a maximally informative set of single-nucleotide polymorphisms for association analyses using linkage disequilibrium. Am. J. Hum. Genet. 74, 106–120. [DOI] [PMC free article] [PubMed] [Google Scholar]
- 12.Li JY (1982) Epidemiology of esophageal cancer in China. Natl. Cancer Inst. Monogr. 62, 113–120. [PubMed] [Google Scholar]
- 13.Hu N, Wang C, Hu Y, Yang HH, Giffen C, Tang ZZ, et al. (2005) Genome-wide association study in esophageal cancer using GeneChip mapping 10K array. Cancer Res. 65, 2542–2546. [DOI] [PubMed] [Google Scholar]
- 14.Matsuzaki H, Loi H, Dong S, Tsai YY, Fang J, Law J, et al. (2004) Parallel genotyping of over 10,000 SNPs using a one-primer assay on a high-density oligonucleotide array. Genome Res. 14, 414–425. [DOI] [PMC free article] [PubMed] [Google Scholar]
- 15.Matsuzaki H, Dong S, Loi H, Di X, Liu G, Hubbell E, et al. (2004) Genotyping over 100,000 SNPs on a pair of oligonucleotide arrays. Nat. Methods 1, 109–111. [DOI] [PubMed] [Google Scholar]
- 16.Fan JB,Gunderson KL,Bibikova M,Yeakley JM,Chen J,Wickham GE,et al. (2006) Illumina universal bead arrays. Methods Enzymol. 410, 57–73. [DOI] [PubMed] [Google Scholar]
- 17.Oliphant A, Barker DL, Stuelpnagel JR, and Chee MS (2002) BeadArray technology: enabling an accurate, cost-effective approach to high-throughput genotyping. Biotechniques Suppl, 56–58, see also pages 60–51. [PubMed] [Google Scholar]
- 18.Elston RC, Guo X, and Williams LV (1996) Two-stage global search designs for linkage analysis using pairs of affected relatives. Genet. Epidemiol. 13, 535–558. [DOI] [PubMed] [Google Scholar]
- 19.Skol AD, Scott LJ, Abecasis GR, and Boehnke M (2006) Joint analysis is more efficient than replication-based analysis for two-stage genome-wide association studies. Nat. Genet. 38, 209–213. [DOI] [PubMed] [Google Scholar]
- 20.Marchini J, Donnelly P, and Cardon LR (2005) Genome-wide strategies for detecting multiple loci that influence complex diseases. Nat. Genet. 37, 413–417. [DOI] [PubMed] [Google Scholar]