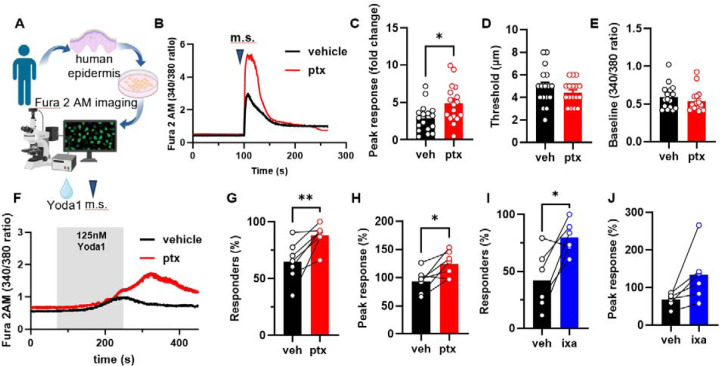
Fig. 6. Human keratinocytes are sensitized to mechanical stimulation and Yoda1 activation following direct paclitaxel and ixabepilone exposure.
(A) Schematic of human keratinocyte isolation from tissue donor samples and subsequent Fura 2 calcium imaging. (B) Representative traces of calcium responses evoked by mechanical stimulation (m.s.) in paclitaxel or vehicle-treated human keratinocytes (keratinocytes were treated with 1 μM paclitaxel or vehicle for 30 minutes before imaging). (C) Amplitude of mechanically activated calcium responses. (D) Activation threshold for the mechanically induced calcium responses. (E) Baseline 340/380 fluorescence ratio recorded from human keratinocytes incubated with paclitaxel or vehicle. (F) Example traces of Yoda1 (125 nM) evoked calcium responses in human paclitaxel or vehicle-treated keratinocytes. The time of Yoda1 application is depicted with a grey box. (G) Proportion of human keratinocytes treated with paclitaxel or vehicle exhibiting a response to Yoda1. (H) Magnitude of the calcium response to Yoda1 in human keratinocytes treated with paclitaxel or vehicle (right). (I) Proportion of human keratinocytes treated with ixabepilone or vehicle exhibiting a response to Yoda1. (J) Magnitude of the calcium response to Yoda1 in human keratinocytes treated with ixabepilone or vehicle. Dots depict the average peak calcium response observed in keratinocytes for each human sample (n = 6–7, 25–120 cells per n). Connecting lines depict cells from the same human donor in two different treatment conditions. Statistical analysis for (C-E) was performed using a Student’s t test, and for (G-J) using a paired Student’s t test. Error bars, ± SEM. *P < 0.05, **P < 0.01, and ****P < 0.0001.

