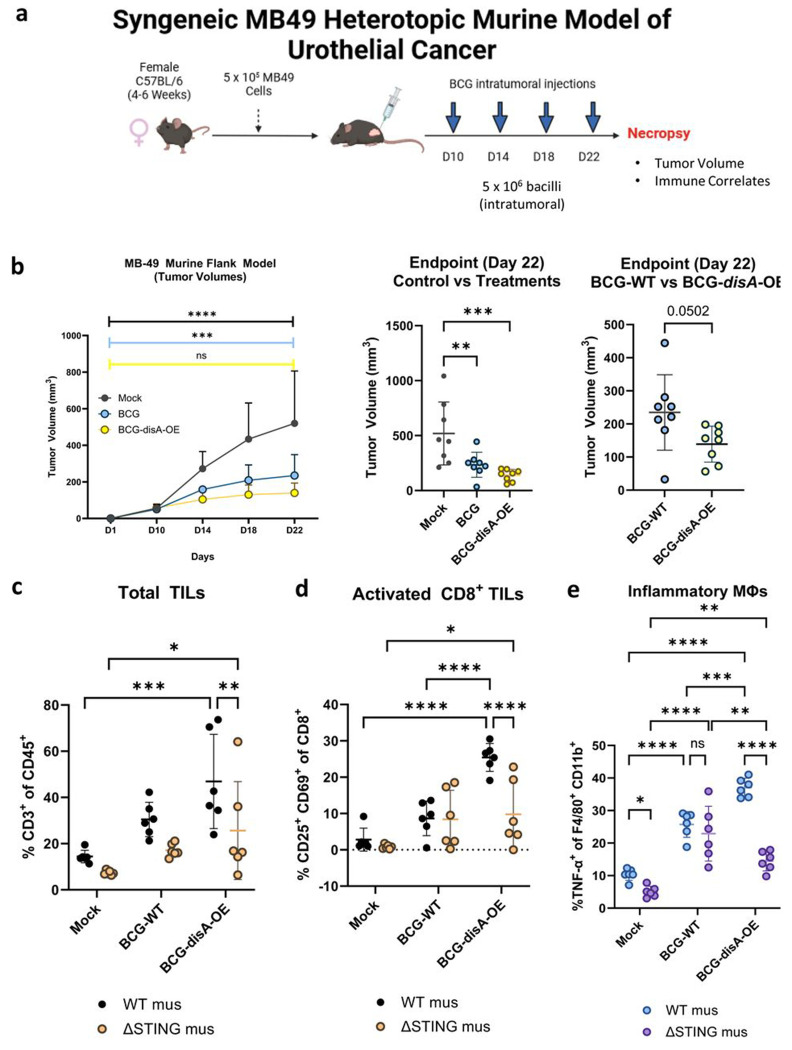
Figure 3. BCG-disA-OE elicits improved antitumor efficacy over BCG-WT in the syngeneic MB49 heterotopic mouse model of urothelial cancer.
a. Schematic diagram of the MB49 syngeneic mouse model of urothelial cancer. b. MB49 tumor volumes and at time of necropsy on day 22 (8 animals/group). c. Tumor infiltrating lymphocytes (TILs, percent CD3+ of CD45) at necropsy, d. Activated CD8+ TILs (percent CD25+ CD69+ of CD8+), and e. inflammatory macrophages (percent TNFα+ of F4/80+ CD11b+). The flow cytometry experiments were performed with treatment on days 10, 14, 17, and 21, with necropsy on day 22 as shown in Fig. S3a (6 animals/group). Data are represented as mean values ± S.D. Statistical analyses done using one-way ANOVA with Dunnett’s multiple comparisons test in panel b (control vs treatments); two-tailed student’s T-test in panel b (BCG-WT vs BCG-disA-OE); two-way ANOVA with Tukey’s multiple comparisons test in panels b, c, d, & e (* p < 0.05, ** p < 0.01, *** p < 0.001, ****p < 0.0001).

