

Abstract
Chimeric antigen receptor (CAR) T cells express antigen-specific synthetic receptors, which upon binding to cancer cells, elicit T cell anti-tumor responses. CAR T cell therapy has enjoyed success in the clinic for hematological cancer indications, giving rise to decade-long remissions in some cases. However, CAR T therapy for patients with solid tumors has not seen similar successes. Solid tumors constitute 90% of adult human cancers, representing an enormous unmet clinical need, ripe for new cell therapies. Current approaches do not solve the central problem of limited ability of therapeutic cells to migrate through the stromal matrix. We discover that T cells at low and high density display low- and high-migration phenotypes, respectively. The highly migratory phenotype is mediated by a paracrine pathway from a group of self-produced inflammatory cytokines that include IL5, TNFα, IFNγ, and IL8. We exploit this finding to “lock-in” a highly migratory phenotype by developing and expressing receptors, which we call velocity receptors (VRs). VRs target these cytokines and signal through these cytokines’ cognate receptors to increase T cell motility and infiltrate lung, ovarian, and pancreatic tumors in large numbers and at doses for which control CAR T cells remain confined to the tumor periphery. In contrast to CAR therapy alone, VR-CAR T cells significantly attenuate tumor growth and extend overall survival. This work suggests that approaches to the design of immune cell receptors that focus on migration signaling will help current and future CAR cellular therapies to infiltrate deep into solid tumors.
INTRODUCTION
Chimeric antigen receptor (CAR) T cells express antigen-specific synthetic receptors, which upon binding to cancer cells, elicit T cell antitumor responses (1). CAR T cell therapy has enjoyed success in the clinic for hematological cancer indications (1), giving rise to decade-long remissions in some cases (2). However, CAR T therapy for patients with solid tumors has not seen similar successes (1, 3). Solid tumors constitute 90% of adult human cancers (4), representing an enormous unmet clinical need, ripe for new cell therapies.
Many recognize that infiltration of immune cells into the tumor may be key for effective anti-tumor activity (5, 6). Since CAR T cells require direct contact with target tumor cells for subsequent killing, we hypothesize that the discrepancy in success of CAR T therapy between liquid and solid tumors is related to the CAR T cell’s ability to physically enter and penetrate deeply into the tumor microenvironment (TME) (Fig. 1A). In solid tumors, the TME contains a highly dense and complex extracellular matrix (ECM), the major non-cellular constituent of the TME (7, 8), which behaves as a physical barrier to T cell migration (9) (Fig. 1A compares the physical barriers in the TMEs of liquid tumors and solid tumors). This tumor-associated collagen-rich stromal matrix is generally denser and stiffer than most normal tissues (10), and T cells demonstrate decreased motility (11) and infiltration (12) within stiff collagen matrices (13–15).
Fig. 1. Low and high-motility states of T cell migration in vitro regulated by specific endogenously expressed cytokines.

(A) Current T cell therapies need to traverse a major physical barrier – the extracellular matrix (ECM) – in the tumor microenvironment (TME) of solid tumors for eventual cell-cell contact that they do not experience in the context of liquid tumors. (B) Primary human pan T cells were isolated from primary human PBMCs using a donor leukopak. Isolated T cells premixed with a CD2/CD3/CD28 activation solution and 100 IU/ml IL2 were encapsulated in 3D gels composed of the major ECM protein, type 1 collagen (rat tail type 1 collagen at 2 mg/ml), at increasing T cell densities. (C) After a 48-h incubation, the spontaneous motion of T cells at increasing densities (LD = 105 cells/ml, MD = 5x10⁵ cells/ml, HD = 106 cells/ml) embedded in 3D collagen gels was monitored using time-lapsed phase-contrast microcopy for 1 h in 3-min intervals at 37 °C and 5% CO2. Cells were manually tracked to generate trajectories for each cell (see Fig. S1). A custom software was used to convert trajectories into mean squared displacement (MSD) for each cell at a time lag of 9 min. Each dot represents an individual cell. LD = low density, MD = medium density, HD = high density. (D) A Matlab script was coded to extract the fractions of T cells moving more than their own size (>R2 = 25 μm2, where R = 5 μm is the average T cell radius) from the MSDs shown in panel C (see also Fig. S1). (E) Activated LD and HD T cells in 3D collagen gels were incubated for 48 h, after which medium from LD T cells was replaced with conditioned medium (CM) obtained from HD cells. (F) MSDs of LD, HD, and LD + HD CM T cells imaged and analyzed as in (C). (G) Motile fractions corresponding to panel F, computed as in panel D. (H) Molecules secreted by LD and HD T cell in 3D collagen gels incubated for 48 h. CM was extracted from the top of LD and HD T cell gels. Single-cell secretomics were run on CM to generate average intensity of a human adaptive immune cytokine panel using Isoplexis Isocode chips. (I) Average intensity from (H) normalized per 105 cells for the four cytokines identified from (H) with higher intensities for HD CM compared to LD CM. Data is plotted as mean with SEM (n = 2). One-way ANOVA with Dunn’s multiple comparison test was performed for statistical analysis. ****P < 0.0001. (J) Activated LD T cells in 3D collagen gels were incubated for 48 h. 100 ng/ml IL5, TNFα, IFNγ, or IL8 were then exogenously added to LD T cell gels separately and incubated for 1 h at 37 °C and 5% CO2. (K) MSDs of T cells in the presence of IL5, TNFα, IFNg, or IL8 and corresponding (L) motile fractions. (M) Activated HD T cells in 3D collagen gels were incubated for 48 h. 25 mg/ml anti-IL5, anti-TNFαR1, anti-IFNγR1, or anti-IL8R were then exogenously added separately and incubated for 1 h at 37 °C and 5% CO2. (N) MSDs of HD T cells incubated with different functional antibodies and (O) corresponding motile fractions. (P) Activated HD T cells in 3D collagen gels incubated for 48 h. 2.5 mM anti-JAK2 (AG490), 60 mM anti-STAT1 (fludarabine), or 50 mM anti-STAT3 (S3I) were then exogenously added separately and incubated for 1 h at 37 °C and 5% CO2. (Q) MSDs of HD T cell gels incubated with different inhibitors and corresponding (R) motile fractions. (S) T cells self-propel using velocity cytokines (VCs) IL5, TNFα, IFNγ, and IL8.
For all experiments MSD, median with the SEM are plotted (n=2 technical replicates per biological replicate, N=2 biological replicates). Individual dots represent individual cells; an average of at least 80 cells per technical replicate, corresponding to up to 989 cells per technical replicate were tracked (see source data). One-way ANOVA with Dunn’s multiple comparison test was used for statistical analysis (ns = not significant, **P < 0.01, ****P < 0.0001). For all experiments measuring the motile fraction, mean with SEM is plotted (n=2 technical replicates per biological replicate, N=2 biological replicates).
A recent effort to enhance tumor infiltration and accumulation involved engineering CAR T to express synthetic notch receptors that induce local T cell proliferation via IL2 secretion in the TME (16). Another effort aimed to target and deplete cancer-associated fibroblasts in the stroma that surrounds the tumor (17). However, these approaches do not solve the central problem of limited ability of therapeutic cells to migrate through the stromal matrix (3). A step towards solving this problem is the strategy of enhanced chemotaxis of therapeutic cells toward the tumor site (18, 19), but chemotaxis and migration, while often confused with one another, are not interchangeable (20). Chemotaxis refers to biased, directional migration along chemical gradients, while migration is unbiased (random, nondirectional) movements that occur in the absence of chemical gradients (20). A cell that can chemotax towards cancer cells but has limited or no migratory capability is akin to steering a car’s wheel with its engine turned off or a car in low gear.
Here we address directly the challenge of tumor infiltration by engineering CAR T cells to have a fast migration phenotype. First, we discovered that T cells at low and high density display low- and high-migration phenotypes, respectively. The highly migratory phenotype is mediated by a paracrine pathway from a group of self-produced inflammatory cytokines that include IL5, TNFα, IFNγ, and IL8. Then, we exploit this finding to “lock-in” a highly migratory phenotype by developing and expressing receptors, which we call velocity receptors (VRs). VRs target these cytokines and signal through these cytokines’ cognate receptors to increase T cell motility by increasing the fraction of cells into the high-migration phenotype. In preclinical mouse models, we establish that VR-CAR T cells can infiltrate lung, ovarian, and pancreatic tumors in large numbers and at doses for which control CAR T cells remain largely confined to the tumor periphery. In contrast to CAR therapy alone, VR-CAR T cells significantly attenuate tumor growth and extend overall survival. This work suggests that approaches to the design of immune cell receptors that focus on migration signaling will help current and future CAR cellular therapies to infiltrate deep into solid tumors.
RESULTS
T cells produce cytokines to trigger their own migration
Before we could develop a highly motile CAR T cell, we first needed to understand how normal T cells migrate in 3D collagen-rich settings in vitro. We hypothesized that identifying basic biophysical principles of enhanced T cell migration in simple in vitro models could help us design new CAR T cells featuring much higher infiltration potential in vivo. Using time-resolved phase contrast microscopy, we tracked the spontaneous movements (no added chemokines or chemoattractants) of hundreds of unlabeled primary human T cells purified from healthy donors, activated by CD3/CD28 beads, and fully embedded in 3D collagen matrices (see details in Materials and Methods). This standard 3D collagen matrix model has been used extensively for cell migration studies (21–24) and serves here as a screening platform. The mean squared displacement (MSD) of each cell was computed from the trajectories of cells in the matrix (Fig. S1A) and used as the primary parameter to compare the motility of individual cells. Due to the non-Gaussian nature of the distribution of cellular movements, traditional migration parameters such as speed and persistence time/distance could not be extracted. T cells exhibited heterogeneous migratory patterns (25). For a given recording time (typically 1 h), some T cells migrated more than their own size, ~5 μm, as measured from phase contrast micrograph while others hardly moved at all, suggesting different migratory states.
Recent-work has shown that cell density (number of single cells in a set volume) can modulate the migration of cancer cells in collagen matrices (26). Breast cancer cells and fibrosarcoma cells showed a small, ~1.5-fold increase in cell speed for a 10-fold increase in cell density (26). Here, we explored the possibility that cell density could modulate the migration of T cells (Fig. 1B). We found that T cells increased their migration up to 4-fold, as cell density was increased 10-fold, from 105 to 106 cells/ml (Fig. 1C and Fig. S1, A and B). Note that these T cell densities were not chosen to reproduce physiological densities; they were chosen to elicit a potential change in cell speed that would help us in the downstream identification of molecules responsible for this change. These cell densities were also chosen to correspond to intercellular distances that were sufficiently large for direct cell-cell collisions to be rare. Importantly, the MSD of the fastest moving T cells (T cells that migrated more than the square of their radius) were similar across all tested densities (Fig. S1, C and D). This suggested that T cell migration adopted two main states: a high-motility state corresponding to the same high MSD (> R2, where R = 5μm is the T cell radius) or a low-motility state for which significantly fewer cells were motile. This indicated that the differences in population-averaged MSD for different seeding densities were reflective of the percentage of T cells that were effectively migrating (Fig. 1D). In other words, as cell density was increased by loading collagen matrices with increasing numbers of cells, the population-averaged MSD increased not because of a change in the type of migration of T cells, but due to a higher fraction of cells in the high-motility state.
Since we did not observe a high number of intercellular collisions that could have caused the increased cell migration, we hypothesized that this density-induced increase in cell migration was caused by secreted molecules. To test this hypothesis, we transferred the supernatant from cells at high density (HD) in the collagen matrix to cells at low density (LD) (Fig. 1E). The conditioned medium (CM) harvested from cells in HD was sufficient to increase the motility of T cells at LD to levels similar to T cells at HD (Fig. 1F and Fig. S1, E and F). Once again, this increase in population-averaged MSD corresponded to a shift in the number of cells in the high-motility state (Fig. 1G and Fig. S1, G and H). This result suggested that factors secreted by cells at HD increased the percentage of cells in a high motility state.
Next, we sought to identify the factors secreted by cells at HD responsible for their increased motility. We utilized a microchip to run single-cell proteomics (27, 28) on the medium from LD cells and HD cells suspended in 3D collagen matrices (Fig. 1H). We identified four cytokines – IL8, TNFα, IFNγ, and IL5 – that were secreted by HD cells but undetectable for LD cells (Fig. 1I), suggesting their de novo production by T cells at a high cellular density. The protease granzyme B, which remodels the ECM, thereby allowing more rapid T cell motility (29), was also detected for HD cells and undetected for LD cells. But, given our aim to engineer receptors that induce T cell migration signaling, we decided to not pursue granzyme B as it has no known cognate receptor. IL8 is a well-established T cell chemoattractant (30), but little is known about its effect on T cell migration (i.e. not chemotaxis).
To understand if and how each of these cytokines modulated T cell motility, we exogenously added each recombinant cytokine separately to LD T cells in 3D collagen gels (Fig. 1J). All cytokines increased T cell motility (Fig. 1K and Fig. S1, I and J) by increasing the fraction of cells in the high-motility state (Fig. 1L and Fig. S1, K and L). Thus, all four cytokines – IL5, TNFα, IFNγ, and IL8 – can act on their own to increase T cell migration. We next inhibited the receptor/cytokine interactions of cytokines endogenously produced at detectable levels in HD T cells: IL5, TNFα, IFNγ, and IL8 (Fig. 1M). Blocking each receptor/cytokine interaction hampered T cell migration (Fig. 1N and Fig. S1, M to P) and, correspondingly, shifted a larger fraction of T cells to a low-motility state (Fig. 1O and Fig. S1, Q to T). Since each of the cytokine receptors signal through JAK/STAT, we next inhibited JAK/STAT signaling in HD cells (Fig. 1P), for which we observed a marked decrease in T cell motility (Fig. 1Q and Fig. S1, U and V) and a shift into the low-motility state (Fig. 1R and Fig. S1, W and X). In sum, T cells at high density produce IL5, TNFα, IFNγ, and IL8 to shift their population to a self-propelled high-motility state and subsequently increase their population-averaged migration. We termed these cytokines, velocity cytokines (VCs) (Fig. 1S). Below, we exploit these results to lock-in T cells into a high-motility state.
Velocity receptors push CAR T cells to a self-propelled high-motility state
We sought to take advantage of VCs in a therapeutic setting. Current cellular therapies such as CAR T suffer from inadequate infiltration into solid tumors (3) (see also our in vivo results for standard CAR T cells below). We thus developed a migration strategy to enhance the infiltration of CAR T cells into solid tumors. One CAR that has received clinical interest in recent years with clinical trials still underway is the mesothelin-specific M5 CAR (M5CAR) (5, 6), which has the potential to ameliorate outcomes of multiple types of cancer patients with solid tumors, such as ovarian, pancreatic, and lung among others (NCT03054298 and NCT03323944).
For our enhanced migration strategy, we ruled out overexpressing VCs to elevate their secretion, as three VCs –TNFα, IFNγ, and IL8 – have been implicated in cytokine release syndrome (CRS), one of the most severe CAR T cell therapy-related toxicity (37). We thus decided to make M5CAR T cells that were more sensitive to VCs expressed by T cells themselves or already present in their environment, through the overexpression of velocity receptors (VRs). These receptors bind VCs and signal through VC cognate receptor signaling domains (Fig. 2A). VR-CAR T cells would thus exploit VCs that they secrete themselves and become self-propelled highly motile cells.
Fig. 2. Velocity receptors turn M5CAR T cells into self-propelling highly motile cells and improve their effector functions.

(A) Design of velocity receptors (VRs) that bind VCs and signal through VC receptor signaling domains, and development of VR-M5CAR therapies. (B) M5CAR or VR-M5CAR T cells at low density (LD) were encapsulated in 3D collagen gels supplemented with 100 IU/ml IL2 and incubated for 48 h at 37 °C and 5% CO2 and their migration patterns were analyzed as in Fig. 1. (C) Control HD M5CAR T cells were also encapsulated in collagen gels and incubated for 48 h and compared to LD VR-M5CAR T cells The spontaneous motion LD M5CAR, LD VR-M5CAR, and HD M5CAR T cells was monitored using time-lapsed phase-contrast microcopy for 1 h at 2-min intervals at 37 °C and 5% CO2. Cells were manually tracked to generate trajectories for each cell (see Fig. S3). A custom software was used to convert trajectories into MSD for each cell at a time lag of 10 min. Each dot represents an individual cell. (D) Fractions of T cells moving more than their own size (>R2 = 25 μm2, where R = 5 μm is the average T cell radius), as assessed from the MSDs shown in panel C (see also Fig. S3). (E) LD M5CAR cells expressing either VR5αIL5, VR5αTNFα, or VR5αIL8, embedded in 3D collagen gels were incubated for 48 h. 25 μg/ml anti-IL5, anti-TNFα, or anti-IL8R were then exogenously added to VR5αIL5-M5CAR, VR5αTNFα-M5CAR , or VR5αIL8-M5CAR, respectively, and incubated for 1 h at 37 °C and 5% CO2. (F) MSDs of control LD M5CAR T cells and the different VR-M5CAR T cells shown in (A). T cells were imaged for 30 min at 2-min intervals as in (C). Cell trajectories and MSD were measured and computed as in (C). (G) Motile fractions of T cells were obtained as in (D) for data shown in (F). For all experiments, MSD, median with the SEM are plotted (n=2 technical replicates per biological replicate, N=2 biological replicates for (C)). Individual dots represent individual cells; an average of at least 120 cells per technical replicate up to 269 cells per technical replicate were tracked (see source data). One-way ANOVA with Dunn’s multiple comparison test was used for statistical analysis (ns = not significant, *P < 0.05, **P < 0.01, ****P < 0.0001). For experiments measuring the motile fraction, mean with SEM is plotted (n=2 technical replicates per biological replicate, N=2 biological replicates) for (D), and mean is plotted (n=2 technical replicates) for (G). (H) Surface expression of the activation markers CD69 and CD25, as determined by flow cytometry using PE anti-CD69 and BV421 anti-CD25. Non-transduced (NTD) T cells were included as a negative control. Surface expression of CD69 was analyzed in FlowJo on M5CAR+-gated T cells as determined by GFP expression. (I) Surface expression of the activation maker CD25 was determined by flow cytometry using BV421 anti-CD25. Flow cytometric analysis was performed as in (H). (J) In vitro T cell killing of mesothelin-expressing H226 and OVCAR3 cells at the indicated effector-to-target (E:T) ratios. Data plotted as mean ± SEM, n = 3. A two-tailed student’s t test was used for statistical analysis (*P < 0.05, **P < 0.01). (F) Il2, TNFα, and IFNγ secretion by non-transduced (NTD), M5CAR T cells, and VR-M5CAR T cells after overnight co-incubation with mesothelin-expressing ASPC1, H226, and OVCAR3 cells. Cytokine release was measured using ELISA. Mean with SEM is shown (n = 3). One-way ANOVA with Tukey’s multiple comparison test was used for statistical analysis (ns = not significant, *P < 0.05, **P < 0.01, ***P <0.001, ****P < 0.0001).
Since there are several VCs and each VCs’ cognate receptor is a heterodimer (except for IL8 which binds to both CXCR1 and CXCR2, composed of distinct domains) (32), we made the VR design modular (Fig. S2A). We first defined a VR as composed of four domains taken from a pool of each VCs’ cognate heterodimer receptor domains – binding, hinge, transmembrane (TM), and signaling.. Next, we included in this pool of domains four VC-specific scFvs (one for each VC), and thus a CD8a hinge and CD8a TM domain to tether the scFv to the cell membrane. These were included in part to 1) allow for a single receptor in contrast to a heterodimer, and 2) yield a higher binding affinity for VCs than their respective cognate receptors. We had > 30,000 VRs we could construct (Fig. S2A). We could not construct and test such an astronomical number of VRs. We cloned 32 distinct VRs and picked the 5 that were successfully cloned. Out of practicality, we decided to move forward with our 5 VRs to test and compare in vitro and preclinically in vivo (Fig. 2A). We defined the 5 VRs as 5 distinct therapies. They were VR5αIL5, VR5αTNFα, VR5αIL8, V5, and Vγsig (Fig. 2A, and Fig. S2B). VR5αIL5, VR5αTNFα, and VR5αIL8 have the same hinge (CD8a), TM (CD8a), and signaling (IL5RA-IL5RB-TNFR1-TNFR2) domains (Fig. 2A, and Fig. S2B). Their only difference is their binding domain. They are all scFvs, but VR5αIL5’s is a receptor for IL5, VR5αTNFα’s for TNFα, and VR5αIL8’s for IL8 (Fig. 2A, and Fig. S2B). V5 is an overexpression of the IL5 receptor (Fig. 2B, and Fig. S2B). Vγsig has an IFNγR1 binding, hinge, and TM domain, but its signaling domain is IFNγR1-IFNγR2 (Fig. 2A, and Fig. S2B).
Since the CAR constructs of all FDA-approved CAR therapies to date are delivered to T cells virally, to compare performance with standard CAR T therapies, we chose to deliver the VR and M5CAR genes to T cells lentivirally. We performed sequential transduction, as the VR and M5CAR would have been indistinguishable in 3 of the therapies in cell-surface flow cytometric detection (Fig. S2B). VRs were each cloned into a lentiviral plasmid and used to transduced T cells. VR expression was detected by antibodies using flow cytometry (Fig. S2B, and Fig. S3A). The M5CAR was cloned into a lentiviral plasmid to express M5CAR-P2A-eGFP for flow cytometry detection without antibody staining and was used to transduce VR-T cells after VR transduction expression was confirmed by flow cytometry (Fig. S2B, and Fig. S3B).
As VRs were engineered to shift cells to a high-motility state, we next characterized the migration status of VR-CAR T cells to determine if these cells indeed migrated more than control CAR T cells (Fig. 2B). We found that all 5 VRs in our VR-M5CAR therapies increased the migration of M5CAR T cells at LD up to levels similar or higher than M5CAR T cells at HD (Fig. 2C and Fig. S3, C and D), and shifted a higher fraction of LD M5CAR T cells to a high-motility state (Fig. 2D and Fig. S3, E and F). We determined if this observed increased migration was the result of ligand-independent tonic VR signaling in the 3 scFv-based VR-CAR therapies, or if it was caused by VC binding as intended. We inhibited VC-VR binding using (separately) anti-IL5, anti-TNFα, anti-IL8 function-blocking antibodies (Fig. 2E). With these inhibitors added, VR-M5CAR T cells exhibited hindered motility (Fig. 2F and Fig. S3, G to J) and shifted to a low-motility state (Fig. 2G and Fig. S3, K to P).
We assessed the activation status of VR-M5CAR T cells compared to M5CAR alone through the expression of standard activation markers CD25 and CD69. All therapies, except Vγsig, had higher CD69 expression than M5CAR T cells alone (Fig. 2H). They had greater than 3-fold expression of CD25 than M5CAR alone (Fig. 2I). Using a standard overnight cell-killing assay, we observed that VR-M5CAR cells were cytotoxic against multiple mesothelin-expressing solid cancer cells in vitro at similar levels to or greater levels than M5CAR T cells (Fig. 2J). VR-M5CAR cells were also either more active than or similarly active to M5CAR T cells, as determined by IL2, TNFα, and IFNγ release in response to overnight co-incubation with multiple mesothelin-expressing solid tumor cells in vitro (Fig. 2K).
These results demonstrate that VRs “lock in” a self-propelled high-motility state in CAR T cells. We observed that VRs also have the added benefit of making CARs more activated, cytotoxic, and elicit stronger responses in the form of IL2, TNFα, and IFNγ production against multiple solid cancers in vitro. These results suggested that the performance of VR-M5CAR therapies in preclinical mouse models could exceed that of M5CAR T cell therapy.
VR-M5CAR therapies infiltrate solid tumors in a pancreatic cancer preclinical model
To allow for the most meaningful comparison of our proposed VR-CAR T cells using current CAR T therapy, we continued with the mesothelin-specific CAR construct commonly used previously and targeted the same types of cancers (5, 33). In the M5CAR phase 1 study, dose-limiting toxicities were observed with ineffective tumor infiltration (5). Likewise, other solid tumor targeting CAR T trials also observed dose limiting toxicities with inadequate tumor accumulation (34, 35). T cell adoptive therapies in general have been infused preclinically in vivo in many cases at doses above 5 x 10⁶ T cells and sometimes with multiple administrations of such doses (5, 17, 36–47). Through standard intravenous (IV) administration at a dose where M5CAR T cells alone are ineffective at infiltrating tumors, we hypothesized that migration strategies could not only help transport M5CAR T cells to the tumor site, but also increase their tumor-infiltration capabilities.
We decided to test our therapies in cancers included in the phase 1 study (5). First, we chose pancreatic cancer, which is defined as an immune-excluded tumor, where T cells generally form a ring around the tumor in the surrounding stroma with inefficient penetration into the tumor core in patients and animal models (48). Using the subcutaneous (s.c.) AsPC1 NSG mouse model of pancreatic cancer extensively used in previous CAR T studies (17, 36, 49), we evaluated and compared the degree of cell infiltration and assessed tumor growth. Cancer cells were subcutaneously injected into the right flank of the mouse. We allowed for the tumors to become palpable (around 100-250mm3), before treating the mice with the respective treatments (5, 17, 36–47). For treatments, we lowered the dose to one where CAR therapy alone was unable to infiltrate tumors and control tumor growth, i.e. 3 x 10⁶ cells in a single dose (i.v. injection), instead of a higher dose sometimes given multiple times during a treatment regimen (5, 17, 36–47).
Harkening back to what was observed in the phase 1 study (5, 6), control M5CAR T cells (no VRs) were detected at low levels within tumors and often surrounding the tumor (Fig. 3A). In contrast, even at this ineffective dose, we found that several VR-M5CAR T cells infiltrated tumor cores readily and inhibited tumor growth. Not all VRs mediated a high number of M5CARs into tumors. The CAR T cells expressing VR5αTNFα or VR5αIL8 showed similar responses to the CAR alone (Fig. 3, B and C). We observed the general pancreatic cancer T cell landscape in which T cells form a “ring” around tumors (48) for M5CAR alone and for VR5αIL8-M5CAR and Vγsig-M5CAR cells, as they accumulated at the tumor edge; yet Vγsig-M5CAR cells were detectable in the tumor core to a higher degree (Fig. 3D). Both VR5αIL5-M5CAR and V5-M5CAR cells infiltrated the entire tumor, edge and core, in large amounts (Fig. 3, E and F). In addition, both VR5αIL5-M5CAR and V5-M5CAR inhibited tumor growth (Fig. 3, E and F). These qualitative assessments of CAR T cell infiltration were quantified using image analysis at single-cell resolution and normalized by the size of the tumor (Fig. 3G). For the best treatment, V5-M5CAR, tumor infiltration was increased by >10-fold compared to control M5CAR cells. This is an underestimate of the effect of V5 expression on CAR T infiltration, as the majority of M5CAR cells congregated at the tumor periphery. We plotted the volume of each tumor at the endpoint (Fig. 3, A–F) as a function of the number of cells that had infiltrated that tumor (Fig 3G) and found a remarkable inverse correlation (Fig. 3H): more CAR T cell infiltration mediated greater inhibition of tumor growth, which supports our original hypothesis. VRs’ inhibition of tumor growth was validated using T cells from an additional donor (Fig. S4, A–G).
Fig. 3. VRs greatly elevate M5CAR T cell tumor infiltration for controlling tumor growth in a pancreatic cancer model.
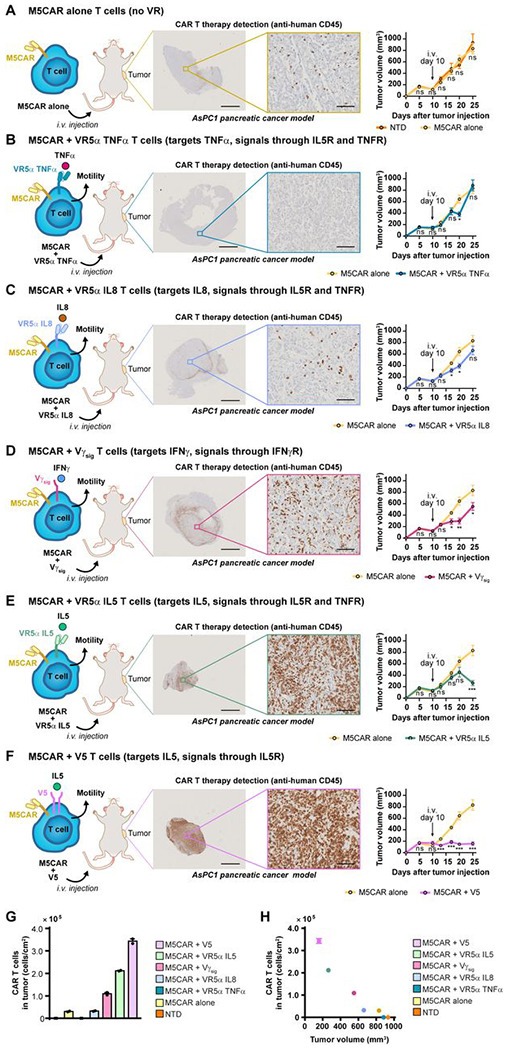
(A) 2e6 ASPC1 pancreatic cancer tumors pre-mixed in 1:1 Matrigel:PBS were subcutaneously (s.c.) engrafted into 8-12 week old NSG mice. Tumor volumes were measured twice a week using digital calipers. When tumors were palpable (100 – 250 mm3), mice were randomized and blindly treated 10 days later with a single intravenous (i.v.) dose of 3e6 NTD or M5CAR T cells. 25 days after tumor engraftment, tumors were harvested and sent for sectioning and IHC staining for human CD45 at the Johns Hopkins Oncology Tissue Services Core Facility. IHC-stained tissue slides were scanned, and images were extracted using ImageScope (middle panel). Tumor volumes were calculated as (L x W2) × 0.5 plotted as mm3 (right panel). (B) ASPC1-bearing mice were treated with M5CAR alone or VR5α TNFα–M5CAR T cells as in panel A. IHC images and tumor volumes were obtained as in panel A. (C) ASPC1-bearing mice were treated with M5CAR alone or VR5α IL8–M5CAR T cells as in panel A. IHC images and tumor volumes were obtained as in panel A. (D) ASPC1-bearing mice were treated with M5CAR T cells alone or Vγsig–M5CAR T cells as in panel A. IHC images and tumor volumes were obtained as in panel A. (E) ASPC1-bearing mice were treated with M5CAR alone or VR5α IL5–M5CAR T cells as in panel A. IHC images and tumor volumes were obtained as in panel A. (F) ASPC1-bearing mice were treated with M5CAR alone or V5–M5CAR T cells as in panel A. IHC images and tumor volumes were obtained as in panel A. (G) Human CD45+ cell numbers were obtained as described in materials and methods. Tissue area was computationally obtained. Tumor infiltration of human CD45+ cells per area was calculated and plotted. (n = 2 non-consecutive tissue slides were stained per treatment group). (H) Human CD45+ cells per tumor area were plotted against average tumor volume at the study endpoint. For figure panels A to F, IHC scale bars are 2 mm (left) and 100 μm (right). Tumor volumes are plotted as mean ± SEM (n = 5 mice per group, except for NTD for which n = 4). Two-tailed student’s t test was used for statistical analysis (ns = not significant, *P < 0.05, **P < 0.01, ***P <0.001).
We assessed potential off-tumor effects of control M5CAR T cells and VR-M5CAR cells by measuring the human T cell burden in non-targeted organs, including the kidney and pancreas. We also measured CAR detection in the spleen, which is a therapeutically beneficial indication of CAR expansion (50). We found that VRs had undetectable to minimal infiltration into the kidney and pancreas; far less than their accumulation in tumors (Fig. S5, A–G). VR5αIL5-M5CAR and V5-M5CAR cells were detected in the spleen at far higher levels than other treatments (Fig. S4, A–F). Moreover, we observed no statistically significant loss of weight in mice undergoing VR-M5CAR therapies (Fig. S5H).
VR-M5CAR therapies infiltrate solid tumors in a lung cancer preclinical model
We tested the generality of our approach by also testing VR-CAR therapies in a preclinical tumor model of lung cancer, as this was another cancer for which patients were recruited for the M5CAR phase 1 trial (5). For the same ineffective dose as in the pancreatic cancer model, we did not see control M5CAR cells accumulate in either the tumor or in the surrounding stroma (Fig. 4A). Co-transduction with VR5αTNFα showed similar responses to M5CAR alone (Fig. 4B). Vγsig-M5CAR, VR5αIL8-M5CAR, and V5-M5CAR each formed a ring around tumor cores and led to similar tumor growth responses as M5CAR cells alone (Fig. 4, C–E). VR5αIL5-M5CAR therapy had the highest accumulation within tumors, which correlated with attenuated tumor growth (Fig. 4F). CAR T cell infiltration was quantified at single-cell resolution and normalized by the size of the tumor (Fig. 4G). For the best treatment, VR5αIL5-M5CAR, tumor infiltration was increased by >10,000-fold compared to control M5CAR T cells. The volume of each tumor at the endpoint (Fig. 4, A–F) was plotted as a function of the number of cells that had infiltrated that tumor (Fig 4G). We found a remarkable inverse correlation (Fig. 4H): more CAR T cell infiltration mediated greater tumor growth inhibition, which supports our original hypothesis. VRs’ ability to inhibit tumor growth was validated using T cells from an additional donor (Fig. S6, A–G). Off-tumor effects were assessed for the kidney and pancreas. Accumulation of VR-M5CAR T cells were either nondetectable or miniscule (Fig. S7, A–G). VR5αIL5-M5CAR and V5-M5CAR showed infiltration into the spleen in greater amounts than other treatments (Fig. S7, A–F). No significant loss of weight was observed in VR-M5CAR therapies compared to M5CAR alone (Fig. S7H).
Fig. 4. VRs improve M5CAR T cell tumor infiltration which can slow tumor growth in a lung cancer model.

(A) 5e6 H226 lung cancer tumors pre-mixed in 1:1 Matrigel:PBS were engrafted s.c. into 8-12 week old NSG mice. Tumor volumes were measured twice a week using digital calipers. When tumors were palpable (100 – 250 mm3), mice were randomized and blindly treated (9 days later) with a single i.v. dose of 3e6 NTD or M5CAR T cells. 19 days after tumor engraftment, tumors were harvested and sent for sectioning and IHC staining for human CD45 at the Johns Hopkins Oncology Tissue Services Core Facility. IHC-stained tissue slides were scanned, and images were extracted using ImageScope (middle panel). Tumor volumes were calculated as (L x W2) × 0.5 plotted as mm3 (right panel). (B) H226-bearing mice were treated with M5CAR alone or VR5α TNFα–M5CAR T cells as in panel A. IHC images and tumor volumes were obtained as in panel A. (C) Mice bearing H226 tumors were treated with M5CAR alone or Vγsig–M5CAR T cells as in panel A. IHC images and tumor volumes were obtained as in panel A. (D) Mice bearing H226 tumors were treated with M5CAR alone or VR5α IL8–M5CAR T cells as in panel A. IHC images and tumor volumes were obtained as in panel A. (E) H226-bearing mice were treated with M5CAR alone or V5–M5CAR T cells as in panel A. IHC images and tumor volumes were obtained as in panel A. (F) Mice bearing H226 tumors were treated with M5CAR alone or VR5α IL5–M5CAR T cells as in panel A. IHC images and tumor volumes were obtained as in panel A. (G) Human CD45+ cell numbers were obtained as described in materials and methods. Tissue area was computationally obtained. Tumor infiltration of human CD45+ cells per area was calculated and plotted. (n = 2 non-consecutive tissue slides were stained per treatment group). (H) Human CD45+ cells per tumor area were plotted against average tumor volume at the study endpoint. For figure panels A to F, IHC panel scale bars are 2 mm (left) and 100 μm (right). Tumor volumes are plotted as mean ± SEM (n = 5 mice per group, except for NTD for which n = 4). Two-tailed student’s t test was used for statistical analysis (ns = not significant, *P < 0.05, **P < 0.01).
As for pancreatic cancer (Fig. 3, B–F), we found a general correlation between the degree of infiltration of these different engineered T cells in lung tumor and the growth inhibition of that tumor (Fig. 4, B–F), which supports our hypothesis of an increased-migration strategy to enhance infiltration and associated therapeutic efficacy (Fig. 4, G and H).
VR-M5CAR therapies increase overall survival in an ovarian cancer preclinical model
Since we have established that VRs can help M5CARs accumulate within multiple solid tumors and inhibit tumor growth, we investigated if this translated into increased overall survival. To test this, we utilized an ovarian cancer preclinical model (Fig. 5A), as ovarian cancer was another cancer for which patients were recruited in the M5CAR phase 1 trial (5). Again, we kept the ineffective M5CAR alone dose and saw that each VR-M5CAR therapy was able to increase survival to a greater extent when compared to M5CAR alone. VR5αTNFα-M5CAR led to 20% overall survival after > 70 days (Fig. 5B). Co-transduction with Vγsig or V5 led to longer survival compared to M5CAR alone (Fig. 5, C and D). Both VR5αIL8-M5CAR and VR5αIL5-M5CAR therapies each led to a months-long 100% overall survival (Fig. 5, E and F).
Fig. 5. VRs-M5CAR T cells extend the overall survival of mice in an ovarian cancer model.

(A) 5e6 OVCAR3 ovarian cancer tumor cells pre-mixed in 1:1 Matrigel:PBS were engrafted s.c. into 8-12 week old female NSG mice. Tumor volumes were measured twice a week using digital calipers. When tumors were palpable (100 – 250 mm3), mice were randomized and blindly treated (8 days later) with a single i.v. dose of 3e6 M5CAR alone or VR-M5CAR T cells. Mice were treated 19 days later with 3e6 M5CAR alone or VR-M5CAR T cells by intraperitoneal (i.p.) injection. Mice reached an endpoint when OVCAR3 tumors reached 750 mm3 in size. (B) OVCAR3-bearing mice were treated with M5CAR alone or VR5α TNFα–M5CAR T cells. Tumor volumes were obtained as described in (A). Mice that reached the endpoint tumor size as described in panel A were removed from the study. Plotted are Kaplan-Meier survival curves. (C) OVCAR3-bearing mice were treated with M5CAR alone or Vγsig–M5CAR T cells. Kaplan-Meier survival curves were generated as described in panel B. (D) Mice bearing OVCAR3 tumors were treated with M5CAR alone or V5-M5CAR T cells. Kaplan-Meier survival curves were generated as described in panel B. (E) OVCAR3-bearing mice were treated with M5CAR alone or VR5α IL8-M5CAR T cells. Kaplan-Meier survival curves were generated as described in panel B. (F) Mice bearing OVCAR3 tumors were treated with M5CAR alone or VR5α IL5-M5CAR T cells Kaplan-Meier survival curves were generated as described in panel B. All plots show Kaplan-Meier survival curves (n = 5 mice per group). Log-rank Mantel-Cox test was used for statistical analysis (ns = not significant, **P < 0.01).
We conclude that VR-M5CAR therapies designed to increase the migration of CAR T cells in a self-propelled manner inside collagen-rich microenvironments can successfully accumulate into multiple solid tumors, control tumor growth, and increase overall survival.
Discussion
Low levels of CAR T cell infiltration within solid tumors hinder tumor eradication in patients with solid tumors, which has greatly limited the clinical use and efficacy of CAR T therapies. This pattern is also observed with other cell therapies (51–53), a challenge that has been typically addressed by increasing the cell therapy dose (51–53). However, high doses lead to off-target effects and toxicities, suggesting dose-limiting toxicities. Furthermore, even when CAR-Ts are used at high doses, there is still very little infiltration of CAR T cells within solid tumors (5, 6). Recent pre-clinical efforts to address poor infiltration have focused generally on making the path to the tumor easier by eradicating stromal fibroblasts surrounding tumors(17), inducing controlled proliferation at tumor sites (16), and trafficking CAR T cells to tumors with chemokine receptors to enhance chemotaxis (18, 19). Nevertheless, these approaches do not directly resolve the problem of infiltration deep into solid tumor cores, which is needed to completely abrogate tumor growth.
Here we use a fundamentally different strategy where we increase the migratory capacity of CAR-T cells by utilizing engineering CAR-T with receptors that take advantage of endogenously secreted cytokines that increase T-cell migration and tumor penetration. Our approach, based on our observation of two-state (high and low) motility of T cells in simple 3D collagen gels, pushes CAR T cells to a high motility state, which facilitates CAR T cell penetration deep inside the tumor. Our analysis indicates that VR-CAR-Ts can infiltrate multiple solid tumors in large amounts, control tumor growth, and greatly extend overall survival (Figs 3 and 4). VRs that bind T-cell-mediated VCs increase the fraction of migrating CAR T cells, allowing for a greater number of CAR T cells to infiltrate deep into the tumor core. This high motility observed in our VR-CARTs is not due to tonic signaling (Fig. 2). Our data suggests that our VR-CARTs are not constitutively active, as blocking the interaction of our VRs with VCs decreases the motility of our VR-CARTs (Fig. 2).
We demonstrated that although each of the 5 VRs we tested pushed CAR T cells into high motility states, we observed different CAR-T-cell infiltration within solid tumors, and in most cases, the same VR-CAR therapy had different effects for different solid tumors (Figs 3 and 4). Nonetheless, we were able to identify a VR-CART therapy, VR5 α IL5 T cells (targets IL5, signals through IL5R and TNFR, that has a high tumor infiltration in the three tested types of cancers. Interestingly, IL5 was the highest-secreted cytokine found in the secretomic analysis of HD T cells (Fig. 2).
When we examined off-tumor infiltration, distal organ infiltration was still far lower than tumor infiltration, which is not what is seen in the clinic (Figs. S5 and S7). This off-tumor effect is one of the largest hurdles at the moment faced by CAR-T therapeutic solutions in solid tumors (3, 5, 35, 54, 55). Different methods have been pushed forward to decrease off-tumor infiltration. A phase 1 trial of mesothelin-targeting CAR T cells electroporated with mRNA (instead of lentiviral transduction) to induce transient expression (56), with the aim of decreasing on-target, off-tumor toxicities (5, 6, 56, 57). However, the transient expression appears to be too short, around 1 week (57), to allow for enough time for CAR T cells to reach and infiltrate the tumor and generate a strong on-tumor, on-target response (5, 6, 56, 57). We transduced T cells lentivirally, which generated stable expression of VRs and the M5CAR. However, it would be interesting to test in future work efficacy of mRNA delivered VR-CAR constructs, as we observe high tumor infiltration in a short period following i.v. injection. Furthermore, were able to decrease the dose of M5CARs by co-transducing them with VRs, and they still exhibited massive accumulation despite the lower dose. It is only theorized, though highly likely, that M5CARs at distal sites cause antigen-targeted toxicities because it was shown that patients have low levels of mesothelin in distant organs. Howbeit, T cells with mRNA-delivered CARs in co-expressed with VRs could exhibit substantial tumor infiltration of low-dose VR-CARs that potentially quickly eradicate tumors, while exhibiting minor distal organ infiltration that elicits a short-lived toxicity that lasts for the duration of the CAR’s transient expression. Studies could also evaluate the merit of mRNA-delivered VRs into mRNA-delivered CAR T cells; loss of VRs’ transient expression may in a sense freeze CAR T cell at high numbers in tumors and at low numbers in distant organs where after a time they would essentially revert to regular T cells. Another option for the regulation and control of VR-CAR therapies would be to introduce drug-induced suicide genes (58–60) into VR-CAR therapies to deplete them when off-tumor accumulation is observed.
It is challenging to directly compare the performance of our CAR T to the different CAR T recently designed to improve infiltration, as they were tested in different mouse models and used at different doses. Nevertheless, the infiltration of VR-CAR T cells was ~30 fold higher than FAP CAR T/meso CART T in a pancreatic tumor model (1.5x10⁴ cells/cm2 vs. 3.4x10⁵ cells) (17). Of note, a dose of 5x10⁶ FAP CAR T cells was injected prior to 5x10⁶ mesoCAR T cells injected 15 days later, larger than the single dose of 3x10⁶ cells used here for VR-CAR T cells. The infiltration of VR-CAR T cells was also ~300 fold higher (1x10³ cells/cm2 vs. 3.4x10⁵ cells) than CAR T cells armed with a C-X-C chemokine receptor type 6 (19), which further suggests that enhanced chemotaxis is not sufficient to enhance infiltration.
For our mouse clinical trials, we utilized an NSG mouse model, as it is the standard model utilized to test CAR Ts that are being developed (61, 62). Utilizing this model allowed us to establish a direct comparison with previous efforts. Additionally, due to the many differences between mouse and human T cells, this model allows us to test engineered human cells, VR-CARs and CARs, that bind human ligands and human cancer cells, which are physiologically closer to human trials. The limitation of the NSG model is the lack of an immune system. A syngeneic mouse model would better evaluate the balance between tumor and off-tumor VR-CAR accumulation, as murine VR-CARs would be able to interact with murine VCs and other cells that share a similar murine background. But the resulting therapies would not be readily translatable to human subjects. In our model, no weight loss or toxicity was detected in any of our treatments. Toxicity assessments would be preferably conducted in syngeneic mouse models. Something to note is that the only cells producing VCs that our therapies would bind are the T-cell therapies themselves. We hypothesize that a higher infiltration of VR-CAR T cells would be reached in human patients as our engineered VR-CAR T cells would be able to utilize the cytokines secreted by the solid tumors and cells in the TME (63–67).
In summary, we have engineered CAR-T cells that sustain a high migratory phenotype that facilitates infiltration in solid tumors. We anticipate that the greatest utility of VRs is their co-transduction with tumor-specific targeting receptors that only recognize neoantigens. This would eliminate solid organ on-target off-tumor toxicity and the only toxicities that arise would be those similar to what ensues from hematologic cancer targeting CAR T cell therapies, such as neurotoxicity and cytokine release syndrome which are manageable. Neoantigens can be targeted with CAR or TCR technologies. Though it is likely, what is still unknown is whether VRs are only compatible co-transduced with CAR T cells or if they can also be co-transduced with TCR T cells.
Material and Methods
Human cancer cells
OVCAR3 (high-grade ovarian serous adenocarcinoma), AsPC1 (pancreatic ductal adenocarcinoma), H226 (squamous cell lung carcinoma) cell lines were obtained from ATCC. OVCAR3 cells were maintained in RPMI supplemented with 10% FBS, 1% penicillin/streptomycin, 200 mM L-glutamine, 1% HEPES, and 1% sodium pyruvate. AsPC1 cells were maintained in RPMI supplemented with 20% FBS, 1% penicillin/streptomycin, and 1% HEPES. We maintained H226 cells in RPMI supplemented with 10% FBS and 1% penicillin/streptomycin. For in vitro co-culture cytotoxicity studies, all cell lines were lentivirally transduced to stably express luciferase-P2A-mCherry. Following transduction, all cell lines underwent FACS cell sorting using a Sony SH800 cell sorter.
Donor primary human T cells
Primary human T cells were obtained from fresh identity-unlinked leukapheresis packs (LPs) from healthy donors who underwent same-day apheresis through the Anne Arundel Medical Center (Annapolis, MD, USA), which resulted in fresh leukapheresis packs (LPs). Freshly delivered LPs were immediately processed to extract PBMCs using Ficoll density gradients. PBMCs subsequently underwent negative selection for the isolation of pan T cells, or CD4 or CD8 T cell subsets for CAR manufacturing using STEMCELL negative selection isolation kits. T cells were maintained in X-Vivo 15 media supplemented with 5% Human AB serum, 200 mM L-glutamine, and 1% penicillin/streptomycin – after which, they were referred to as complete X-Vivo. For density-dependent migration studies (Fig. 1, B–S), T cells were cultured in serum-free Immunocult media (STEMCELL) supplemented with 100 IU/ml IL2.
Cellular therapy manufacturing
VR therapy vectors and the CAR therapy vector were first designed through Gibson Assembly molecular cloning (HiFi DNA Assembly Cloning Kit, NEB) using the backbone pSLCAR-CD19-BBz (Addgene). VR nucleic acids were synthetically constructed as indicated (refer to Fig. 2A), and were cloned into the backbone excluding the backbone’s native CD19 CAR-P2A-GFP sequence to select for positive cells downstream through the use of surface staining with FACS antibodies for VRs and subsequent detection by flow cytometry. The M5CAR nucleic acid sequence was cloned into the backbone prior to the P2A-GFP sequence to select positive cells downstream by GFP using flow cytometry. VR therapy lentiviral particles and CAR therapy lentiviral particles were obtained by transfecting 293T cells with vectors for VRs or the M5CAR. 293T cells were obtained from ATCC and maintained in either DMEM supplemented with 10% FBS or Opti-MEM supplemented with 5% FBS. Transfection was performed using GeneJuice, (Millipore Sigma) and lentiviral particles were concentrated in Lenti-X Concentrator (Lonza). VR, CAR, and VR-CAR therapies were manufactured as follows. CD4 and CD8 T cells were isolated using STEMCELL negative selection kits and were mixed 1:1. They were then activated overnight by CD3/CD28 Dynabeads (Invitrogen) in complete X-Vivo media supplemented with 100 IU/ml IL2 (Peprotech). For VR alone or M5CAR alone therapies, activated cells were subsequently lentivirally transduced overnight on Retronectin-coated plates, after which their positivity was checked by flow cytometry. For the VR-CAR cells, after overnight activation, T cells were transduced on Retronectin-coated plated with VR therapy lentivirus overnight and checked for VR positivity by flow as follows: V5 stained for IL5RA; Vγsig stained for IFNγR1; VR5α IL5, VR5α IL8, and VR5α TNFα stained for F(ab)2. VR T cells were then transduced overnight on Retronectin-coated plates with M5CAR therapy lentivirus and checked for M5CAR positivity by flow cytometric detection of GFP. VR-M5CAR, M5CAR, or non-transduced T cells were expanded for a total of 11 days. Dynabeads were magnetically removed using Dynamags (Invitrogen) and frozen in liquid nitrogen or maintained in culture in complete X-Vivo media supplemented with 100 IU/ml IL2.
3D migration
T cells in complete X-Vivo media supplemented with 100 IU/ml IL2 were suspended in a 2 mg/ml type I collagen (Corning) solution. For density-dependent migration studies, T cells in Immunocult media were activated with Immunocult CD2/CD3/CD28 expansion solution (STEMCELL) supplemented with 100 IU/ml IL2. T cells were then suspended in 2 mg/ml type I collagen (Corning) and a 0.22 μm-filtered reconstitution buffer that consisted of HEPES, HBSS, and sodium bicarbonate in milliQ-purified water. The T cell-collagen solution was solidified in a 37 °C and 5% CO2 incubator for 1 hr. Immunocult media supplemented with 100 IU/ml IL2 was then added on top of the T cell-collagen gels. The gels were then incubated for 48 hrs and imaged for 1 hr on a Nikon Ti2 microscope equipped with a live-cell system maintained at 37 °C and 5% CO2. Time-lapse images were constructed into time-lapse movies using Nikon Elements, and cell positions were tracked frame-by-frame to generate cell trajectories using Metamorph. Analysis of cell trajectories to pull out multiple parameters to characterize cellular motility was performed in Matlab (MathWorks) following the principles and equations previously reported (13, 68).
T cell secretomics
LD and HD T cells were cultured in 3D collagen gels, as described above, for 48 hrs in a 37 °C and 5% CO2 incubator. Conditioned medium was collected from the top of 3D T cell-collagen gels and filtered through a 0.45 μm filter. Filtered conditioned medium was added to Isoplexis microchips.
2D in vitro cytotoxicity
For T cell cytotoxicity, luciferase-expressing solid tumor cell lines were incubated at 37 °C and 5% CO2 overnight. Subsequently, T cells at indicated E:T ratios were added on top of the cancer cells and incubated overnight. BrightGlo solution (Promega) was then added to the wells and luminescence was read on a SpectraMax plate reader (Molecular Devices) to obtain relative light units (RLUs). Specific lysis was calculated using the RLUs as 100% * (Alive – Condition)/(Alive – Dead).
Flow cytometry immunophenotyping
For immunophenotyping of VR-transduced T cells, 50 uL overnight-transduced T cells were collected, washed three times at 4 °C in cold FACS buffer (PBS supplemented with 5% FBS and 0.1% sodium azide), and surfaced stained with an anti-F(ab)2 (VR5αIL5, VR5αTNFα, and VR5αIL8), anti-IL5RA (V5), or anti-IFNγR1 (Vγsig) antibody in FACS buffer at 4 °C for 30 min. Cells were then washed three times at 4 °C in FACS buffer before analysis by flow cytometry. Data was collected using Sony SH800 and was analyzed using FlowJo (BD). For M5CAR detection, T cells were collected and washed three times in FACS buffer and analyzed for GFP expression using flow cytometry.
For activation marker expression immunophenotyping, T cells were collected, washed three times at 4 °C in cold FACS buffer, and surface stained with an anti-CD25 or anti-CD69 antibody at 4 °C for 30 min. Cells were washed three times at 4 °C in cold FACS buffer. Surface-stained T cells were then analyzed by flow cytometry using Sony SH800. All data were analyzed using FlowJo software.
Cytokine assays
To measure T cell activity, AsPC1, OVCAR3, or H226 cells were incubated in overnight at 3e3 cells/well in 96 well plates. The following day, NTD, M5CAR, or VR-M5CAR T cells in were added to cancer cells at 1:1 E:T ratios and incubated overnight. 100 μL of supernatant was then carefully removed from each wells using a multichannel pipette. Supernatants were analyzed for IL2, TNFα, or IFNγ by ELISA (Invitrogen) according to the manufacturer’s protocol.
Pre-clinical mouse models
All animal experiments were approved by the Institutional Animal Care and Use Committee (IACUC) of the Johns Hopkins University (Protocol MOE23E29) and were performed in an Association for the Assessment and Accreditation of Laboratory Animal Care (AALAC) accredited facility. The housing group was five at maximum for all mice groups. Mouse studies were performed in 8–12-week-old NOD-scid IL2Rgammanull (NSG) female and male mice (Jackson Laboratory). AsPC1 (2e6) or H226 (5e6) human cells were subcutaneously injected into the right flank of each mouse with an equal volume of Matrigel (BD) to PBS. After tumors became palpable at roughly 100 – 250 mm3, mice were injected by tail vein (once) with either 100 μl PBS or non-transduced T cells, M5CAR T cells, or the indicated VR-M5CAR T cell therapies in 100 μl PBS. Tumors were measured using digital calipers approximately twice per week and mice were weighed at the end of each experiment. Tumor volumes were calculated using the following formula: volume: (L x W2) × 0.5. Tumors and organs were harvested at the indicated days. Half of the tissues were embedded in paraffin for IHC staining and the other half was flash-frozen.
Survival Mouse Studies
The OVCAR3 (5e6) cancer cell line was subcutaneously injected into the right flank of female NSG mice. After tumors became palpable mice were injected by tail vein with the respective treatment. Mice received a second dose after 19 days intraperitoneally. Tumors were measured twice a week as described above. Mice were sacrificed when they reached 750 mm3, and tumors and organs were collected.
Immunohistochemistry (IHC)
Mouse tumors and organs were fixed in formalin and subsequently paraffin-embedded and sectioned. Paraffin-embedded sections were blindly stained for human CD45 to measure human T cell infiltration into tumors and organs by The Johns Hopkins Oncology Tissue Core. Histological slides were scanned using Hamamatsu NanoZoomer S210 scanner at a 20x magnification (0.5 μm/pixel). Quantification was done by a computational biologist who was blinded to the data.
Immunohistochemistry quantifications
Scanned histological images were downsampled to 10x magnification (1 μm/pixel) and color deconvolution was used to extract the IHC CD45 positive locations to an independent image channel. Intensity peaks were detected on the isolated CD45+ channel and spatial coordinates were collected (x, and y coordinates). Assessment of tumor CD45+ cell infiltration was performed by manual masking of each individual tumor location.
Statistical Analysis
All statistical tests were performed using GraphPad Prism. All migration MSD analyses used either the nonparametric Mann-Whitney U-test for two groups, or for multiple comparisons the Kruskal-Wallis ANOVA with Dunn’s post-test. All other analyses were performed using either the student’s t-test for two groups, or the ordinary one-way ANOVA with Tukey’s post-test for comparison of multiple groups. The Log rank Mantel-Cox test was used for Kaplan-Meier survival curves.
Supplementary Material
Fig. S1. (A) LD, MD, and HD T cells were encapsulated in 3D collagen gels and their motility was monitored as described in Fig. 1 panels B to D. A custom Matlab software was used to randomly select 10 trajectories per condition. Plotted are x-y trajectories (μm). (B) Median T cell MSD was calculated and plotted versus time lag from all cell trajectories. (C) T cells that moved more than their own size (>R2 = 25 μm2, where R = 5 μm is the average T cell radius) in an hour of tracking were extracted and the median MSD was calculated and plotted versus time lag (min). (D) A Matlab script was coded to extract the percentage of motile T cells MSDs at a time lag of 9 min from the MSDs in panel C. (E) LD, HD, and LD + HD T cells were encapsulated in 3D collagen gels and imaged as described in Fig. 1E–G. Ten randomly selected re displayed per condition. (F) Median T cell MSDs for the indicated conditions. (G) MSDs of motile T cells were extracted as described in panel C. (H) MSDs of motile T cells at a time lag of 9 min from data in panel G. (I) LD T cells in 3D collagen gels were treated with exogenous cytokines and their motility was monitored as described in Fig. 1 panels J to L. Ten randomly selected trajectories (μm) per condition are shown. (J) Median T cell MSD was calculated and plotted for the indicated conditions. (K) MSDs of motile T cells were extracted as described in panel C. (L) MSDs of motile T cells at a time lag of 9 min, computed from MSDs, as described in panel C. (M) HD T cells in 3D collagen gels were treated with indicated antibodies and their motility was monitored as described in Fig. 1, M–O. Ten randomly selected x-y trajectories (μm) per condition are shown. (N) HD T cells in 3D collagen gels were treated with an anti-IL8R antibody and their motility was monitored as described in Fig. 1, M–O. Ten randomly selected x-y trajectories (μm) per condition are shown. (O) Median T cell MSDs for the indicated conditions. (P) Median T cell MSDs for HD control T cells or HD T cells treating with an anti-IL8R antibody. (Q) Motile MSDs were extracted and plotted in Matlab as described in panel C. (R) Matlab was used to extract and plot motile T cell MSDs at a time lag of 9 min from the MSDs in panel Q. (S) MSDs of motile T cells were extracted as described in panel C. (T) MSDs of T cells at a time lag of 9 min shown in panel S. (U) HD T cells in 3D collagen gels were treated with indicated JAK/STAT inhibitors and their motility was monitored as described in Fig. 1, P–R. Ten randomly selected trajectories per condition are shown. (V) Median MSDs of T cells for the indicated conditions. (W) MSDs of motile T cells were extracted as described in panel C. (X) MSDs of T cells at a time lag of 9 min computed from the MSDs in panel W.
All plots showing MSD vs. time lag are plotted using the median MSD. For all experiments measuring MSD at a time lag of 9 min, median with the SEM is plotted (n=2 technical replicates per biological replicate, N=2 biological replicates). Individual dots represent individual cells; an average of at least 80 cells per technical replicate, up to 989 cells per technical replicate were tracked (see source data). One-way ANOVA with Dunn’s multiple comparison test was used for statistical analysis (ns = not significant, ***P < 0.001).
Fig. S2. (A) VR design. Calculated are the number of VR constructs obtained from the indicated combination of domains. (B) VR-M5CAR T cell co-transduction scheme.
Fig. S3. (A) CD4+ and CD8+ primary human T cells were isolated from Ficoll-extracted PBMCs from human donor leukopaks and mixed 1:1. T cells were then activated overnight with CD3/CD28 Dynabeads and 100 IU/ml IL2. The following day, lentiviruses bearing plasmids with transgenes that encode for the specified VRs (see Fig. 2, panel A) were incubated on Retronectin-coated plates for 4 hrs at 37 °C and 5% CO2. Activated T cells were then added to lentivirus-bound Retronectin coated wells and incubated overnight. VR surface expression was detected the next day by flow cytometry after staining with anti-F(ab)2 antibodies for the VRs indicated, anti-IL5RA for V5, or anti-IFNGR1 for Vγsig. Non-transduced (NTD) T cells were used as a negative control. FlowJo was used to analyze the data and plot histograms normalized to mode. (B) The day following VR transduction, T cells were transduced overnight with M5CAR-P2A-eGFP (see Fig. 2, panel A) on lentivirus-bound Retronectin-coated plates. The next day, M5CAR expression was measured by GFP detection using flow cytometry. Non-transduced (NTD) T cells were used as a negative control. Data was analyzed and histograms normalized to mode were plotted in FlowJo. (C) LD M5CAR, LD VR-M5CAR, and HD M5CAR T cells were encapsulated in 3D collagen gels and their motility was monitored as described in Fig. 2, B–D. Ten randomly selected trajectories per condition were selected. (B) Median MSD of T cells vs. time lag. (E) T cells that moved more than their own size (>R2 = 25 μm2, where R = 5 μm is the average T cell radius) in an hour of tracking were extracted in Matlab and median MSD was calculated and plotted versus time lag. (F) MSDs of motile T cells at a time lag of 10 min, as described in panel E. (G) LD M5CAR or LD VR5αIL5-M5CAR, VR5αTNFα-M5CAR, or VR5αIL8-M5CAR cells were suspended in 3D collagen gels, treated with antibody inhibitors, incubated, and their motility was monitored as described in Fig. 2, E–G. Ten randomly selected trajectories (mm) per condition are shown. (H), (I), (J) Median T cell MSD was calculated and plotted using a custom Matlab software. (K), (L), (M) Motile MSDs were extracted and plotted in Matlab as described in panels H to J. (N), (O), (P) A custom Matlab script was used to extract and plot motile T cell MSDs at a time lag of 10 min from the MSDs in panels K to M.
All plots showing MSD vs time lag are plotted using the median MSD. For all experiments measuring MSD at a time lag of 10 min, median with the SEM is plotted (n=2 technical replicates per biological replicate, N=2 biological replicates for (F) and N=1 biological replicate for panel N to P). Individual dots represent individual cells; an average of at least 120 cells per technical replicate up to 269 cells per technical replicate were tracked (see source data). One-way ANOVA with Dunn’s multiple comparison test was used for statistical analysis (ns = not significant, *P < 0.05).
Fig. S4. (A) 2e6 ASPC1 pancreatic cancer tumors pre-mixed in 1:1 Matrigel:PBS were subcutaneously (s.c.) engrafted into 8-12 week old NSG mice. Tumor volumes were measured twice a week using digital calipers. When tumors were palpable (100 – 250 mm3), mice were randomized and blindly treated (8 days later) with a single intravenous (i.v.) dose of 3e6 NTD or M5CAR T cells. Tumor volumes were calculated as (L x W2) × 0.5 plotted as mm3. (B) ASPC1-bearing mice were treated with M5CAR alone or VR5α TNFα-M5CAR T cells as in panel A. (C) ASPC1-bearing mice were treated with M5CAR alone or VR5α IL8 T-M5CAR cells as in panel A. (D) ASPC1-bearing mice were treated with M5CAR alone or Vγsig-M5CAR T cells as in panel A. (E) ASPC1-bearing mice were treated with M5CAR alone or VR5α IL5--M5CAR T cells as in panel A. (F) ASPC1-bearing mice were treated with M5CAR alone or V5-M5CAR T cells as in panel A. (G) Mice were weighed at the end of the study. For all figure panels, tumor volumes (A to F) and body weights (G) are plotted as mean ± SEM (n = 5 mice per group, except for PBS for which n = 3). For panels A to F, two-tailed student’s t test was used for statistical analysis (ns = not significant, *P < 0.05, **P < 0.01). For panel G, ordinary one-way ANOVA with Tukey’s multiple comparison test was used for statistical analysis (ns = not significant).
Fig. S5. (A) ASPC1 pancreatic tumors were subcutaneously engrafted into NSG mice and measured as described in Fig. 3. Mice bearing ASPC1 tumors were treated with M5CAR T cells as described in Fig. 3. The kidney, pancreas, and spleen were harvested from day-25 mice. Organs were sectioned and IHC-stained with anti-human CD45 to detect T cell therapies as in Fig. 3. (B) Mice bearing ASPC1 tumors were treated with VR5α TNFα-M5CAR T cells as described in Fig. 3. The kidney, pancreas, and spleen were sectioned and IHC-stained with anti-human CD45 to detect T cell therapies as in Fig. 3. (C) ASPC1-bearing mice were treated with VR5α IL8-M5CAR T cells as described in Fig. 3. The kidney, pancreas, and spleen were sectioned and IHC-stained with anti-human CD45 for CAR detection. (D) ASPC1-bearing mice were treated with Vγsig-M5CAR T cells as described in Fig. 3. The kidney, pancreas, and spleen were sectioned and IHC-stained with anti-human CD45. (E) ASPC1-bearing mice were treated with VR5α IL5-M5CAR T cells as described in Fig. 3. The kidney, pancreas, and spleen were sectioned and IHC-stained with anti-human CD45 to detect human T cells as in Fig. 3. (F) ASPC1-bearing mice were treated with V5-M5CAR T cells as described in Fig. 3. The kidney, pancreas, and spleen were sectioned and IHC-stained with anti-human CD45 to detect T cell therapies as in Fig. 3. For figure panels A to F, scale bars in IHC micrographs are 500 μm. (G) Human CD45+ cell numbers were obtained as described in materials and methods. Tissue area was computationally obtained. Organ and tumor infiltration of human CD45+ cells per area were calculated and plotted. (n = 2 non-consecutive tissue slides were stained per treatment group). (H) Mouse body weights were collected at the end of the study. Body weights are plotted as mean ± SEM (n = 5 mice per group, except for PBS and NTD for which n = 4). Ordinary one-way ANOVA with Tukey’s multiple comparison test was used for statistical analysis (ns = not significant).
Fig. S6. (A) 5e6 H226 lung cancer tumors pre-mixed in 1:1 Matrigel:PBS were engrafted s.c. into 8-12 week old NSG mice. Tumor volumes were measured twice a week using digital calipers. When tumors were palpable (100 – 250 mm3), mice were randomized and blindly treated (10 days later) with a single i.v. dose of 3e6 NTD or M5CAR T cells. Tumor volumes were calculated as (L x W2) × 0.5 plotted as mm3. (B) H226-bearing mice were treated with M5CAR alone or VR5α TNFα-M5CAR T cells as in panel A. (C) Mice bearing H226 tumors were treated with M5CAR alone or Vγsig-M5CAR T cells as in panel A. (D) Mice bearing H226 tumors were treated with M5CAR alone or VR5α IL8-M5CAR T cells as in panel A. (E) H226-bearing mice were treated with M5CAR alone or V5-M5CAR T cells as in panel A. (F) Mice bearing H226 tumors were treated with M5CAR alone or VR5α IL5-M5CAR T cells as in panel A. (G) Mouse body weights were collected at the end of the study. For all figure panels, tumor volumes (A to F) and body weights (G) are plotted as mean ± SEM (n = 5 mice per group, except for PBS for which n = 2, NTD for which n = 3, and M5CAR alone and VR5α TNFα-M5CAR for which n = 4). For panels A to F, two-tailed student’s t test was used for statistical analysis (ns = not significant, *P < 0.05, **P < 0.01). For panel G, ordinary one-way ANOVA with Tukey’s multiple comparison test was used for statistical analysis (ns = not significant).
Fig. S7. (A) H226 lung tumors were subcutaneously engrafted into NSG mice and measured as described in Fig. 4. Mice bearing H226 tumors were treated with M5CAR T cells as described in Fig. 4. The kidney, pancreas, and spleen were harvested from day-19 mice. Organs were sectioned and IHC-stained with anti-human CD45 to detect T cell therapies as in Fig. 4. (B) Mice bearing H226 tumors were treated with VR5α TNFα-M5CAR T cells as described in Fig. 4. The kidney, pancreas, and spleen were sectioned and IHC-stained with anti-human CD45 to detect T cell therapies as in Fig. 4. (C) H226-bearing mice were treated with Vγsig-M5CAR T cells as described in Fig. 4. The kidney, pancreas, and spleen were sectioned and IHC-stained with anti-human CD45 for CAR detection. (D) H226-bearing mice were treated with VR5α IL8-M5CAR T cells as described in Fig. 4. The kidney, pancreas, and spleen were sectioned and IHC-stained with anti-human CD45. (E) H226-bearing mice were treated with V5-M5CAR T cells as described in Fig. 4. The kidney, pancreas, and spleen were sectioned and IHC-stained with anti-human CD45 to detect T cell therapies as in Fig. 4. (F) Mice bearing H226 tumors were treated with VR5α IL5-M5CAR T cells as described in Fig. 4. The kidney, pancreas, and spleen were sectioned and IHC-stained with anti-human CD45 to detect T cell therapies as in Fig. 4. For figure panels A to F, scale bars in IHC micrographs are 500 μm. (G) Human CD45+ cell numbers were obtained as described in materials and methods. Tissue area was computationally obtained. Organ and tumor infiltration of human CD45+ cells per area were calculated and plotted. (n = 2 non-consecutive tissue slides were stained per treatment group). (H) Mouse body weights were collected at the end of the study. Body weights are plotted as mean ± SEM (n = 5 mice per group, except for PBS for which n = 2, NTD for which n = 3, and M5CAR alone for which n = 4). Ordinary one-way ANOVA with Tukey’s multiple comparison test was used for statistical analysis (ns = not significant).
Acknowledgements
The authors acknowledge the following sources of support: U54CA268083; UG3CA275681; T32CA153952 from the National Cancer Institute. The authors thank colleagues Bert Vogelstein, Ken Kinzler, Nick Papadopoulos, Max Konig and their students and fellows for fruitful feedback on this work.
Footnotes
Conflict of interest statement
ACJ and DW are inventors on a patent application based on the work presented here.
References
- 1.June C. H., Sadelain M., Chimeric Antigen Receptor Therapy. N Engl J Med 379, 64–73 (2018). [DOI] [PMC free article] [PubMed] [Google Scholar]
- 2.Melenhorst J. J. et al. , Decade-long leukaemia remissions with persistence of CD4. Nature 602, 503–509 (2022). [DOI] [PMC free article] [PubMed] [Google Scholar]
- 3.Sterner R. C., Sterner R. M., CAR-T cell therapy: current limitations and potential strategies. Blood Cancer J 11, 69 (2021). [DOI] [PMC free article] [PubMed] [Google Scholar]
- 4.Siegel R. L., Miller K. D., Wagle N. S., Jemal A., Cancer statistics, 2023. CA Cancer J Clin 73, 17–48 (2023). [DOI] [PubMed] [Google Scholar]
- 5.Haas A. R. et al. , Two cases of severe pulmonary toxicity from highly active mesothelin-directed CAR T cells. Mol Ther 31, 2309–2325 (2023). [DOI] [PMC free article] [PubMed] [Google Scholar]
- 6.Haas A. R. et al. , Phase I Study of Lentiviral-Transduced Chimeric Antigen Receptor-Modified T Cells Recognizing Mesothelin in Advanced Solid Cancers. Mol Ther 27, 1919–1929 (2019). [DOI] [PMC free article] [PubMed] [Google Scholar]
- 7.Lu P., Weaver V. M., Werb Z., The extracellular matrix: a dynamic niche in cancer progression. J Cell Biol 196, 395–406 (2012). [DOI] [PMC free article] [PubMed] [Google Scholar]
- 8.Gilkes D. M., Semenza G. L., Wirtz D., Hypoxia and the extracellular matrix: drivers of tumour metastasis. Nat Rev Cancer 14, 430–439 (2014). [DOI] [PMC free article] [PubMed] [Google Scholar]
- 9.Henke E., Nandigama R., Ergün S., Extracellular Matrix in the Tumor Microenvironment and Its Impact on Cancer Therapy. Front Mol Biosci 6, 160 (2019). [DOI] [PMC free article] [PubMed] [Google Scholar]
- 10.Butcher D. T., Alliston T., Weaver V. M., A tense situation: forcing tumour progression. Nat Rev Cancer 9, 108–122 (2009). [DOI] [PMC free article] [PubMed] [Google Scholar]
- 11.Sadjadi Z., Zhao R., Hoth M., Qu B., Rieger H., Migration of Cytotoxic T Lymphocytes in 3D Collagen Matrices. Biophys J 119, 2141–2152 (2020). [DOI] [PMC free article] [PubMed] [Google Scholar]
- 12.Kuczek D. E. et al. , Collagen density regulates the activity of tumor-infiltrating T cells. J Immunother Cancer 7, 68 (2019). [DOI] [PMC free article] [PubMed] [Google Scholar]
- 13.Wu P. H., Giri A., Sun S. X., Wirtz D., Three-dimensional cell migration does not follow a random walk. Proc Natl Acad Sci U S A 111, 3949–3954 (2014). [DOI] [PMC free article] [PubMed] [Google Scholar]
- 14.Fraley S. I. et al. , Three-dimensional matrix fiber alignment modulates cell migration and MT1-MMP utility by spatially and temporally directing protrusions. Sci Rep 5, 14580 (2015). [DOI] [PMC free article] [PubMed] [Google Scholar]
- 15.Wu P., Gilkes D., Wirtz D., Dill K., The Biophysics of 3D Cell Migration. Annual Review of Biophysics, Vol 47 47, 549–567 (2018). [Google Scholar]
- 16.Allen G. M. et al. , Synthetic cytokine circuits that drive T cells into immune-excluded tumors. Science 378, eaba1624 (2022). [DOI] [PMC free article] [PubMed] [Google Scholar]
- 17.Xiao Z. et al. , Desmoplastic stroma restricts T cell extravasation and mediates immune exclusion and immunosuppression in solid tumors. Nat Commun 14, 5110 (2023). [DOI] [PMC free article] [PubMed] [Google Scholar]
- 18.Jin L. et al. , CXCR1- or CXCR2-modified CAR T cells co-opt IL-8 for maximal antitumor efficacy in solid tumors. Nat Commun 10, 4016 (2019). [DOI] [PMC free article] [PubMed] [Google Scholar]
- 19.Lesch S. et al. , T cells armed with C-X-C chemokine receptor type 6 enhance adoptive cell therapy for pancreatic tumours. Nat Biomed Eng 5, 1246–1260 (2021). [DOI] [PMC free article] [PubMed] [Google Scholar]
- 20.Du W., Nair P., Johnston A., Wu P. H., Wirtz D., Cell Trafficking at the Intersection of the Tumor-Immune Compartments. Annu Rev Biomed Eng 24, 275–305 (2022). [DOI] [PMC free article] [PubMed] [Google Scholar]
- 21.Wu P. H. et al. , Single-cell morphology encodes metastatic potential. Sci Adv 6, eaaw6938 (2020). [DOI] [PMC free article] [PubMed] [Google Scholar]
- 22.Phillip J. M. et al. , Fractional re-distribution among cell motility states during ageing. Commun Biol 4, 81 (2021). [DOI] [PMC free article] [PubMed] [Google Scholar]
- 23.Tabdanov E. D. et al. , Engineering T cells to enhance 3D migration through structurally and mechanically complex tumor microenvironments. Nat Commun 12, 2815 (2021). [DOI] [PMC free article] [PubMed] [Google Scholar]
- 24.Jacobelli J. et al. , Confinement-optimized three-dimensional T cell amoeboid motility is modulated via myosin IIA-regulated adhesions. Nat Immunol 11, 953–961 (2010). [DOI] [PMC free article] [PubMed] [Google Scholar]
- 25.Krummel M. F., Bartumeus F., Gerard A., T cell migration, search strategies and mechanisms. Nat Rev Immunol 16, 193–201 (2016). [DOI] [PMC free article] [PubMed] [Google Scholar]
- 26.Jayatilaka H. et al. , Synergistic IL-6 and IL-8 paracrine signalling pathway infers a strategy to inhibit tumour cell migration. Nat Commun 8, 15584 (2017). [DOI] [PMC free article] [PubMed] [Google Scholar]
- 27.Ma C. et al. , A clinical microchip for evaluation of single immune cells reveals high functional heterogeneity in phenotypically similar T cells. Nat Med 17, 738–743 (2011). [DOI] [PMC free article] [PubMed] [Google Scholar]
- 28.Lu Y. et al. , Highly multiplexed profiling of single-cell effector functions reveals deep functional heterogeneity in response to pathogenic ligands. Proc Natl Acad Sci U S A 112, E607–615 (2015). [DOI] [PMC free article] [PubMed] [Google Scholar]
- 29.Prakash M. D. et al. , Granzyme B promotes cytotoxic lymphocyte transmigration via basement membrane remodeling. Immunity 41, 960–972 (2014). [DOI] [PubMed] [Google Scholar]
- 30.Larsen C. G., Anderson A. O., Appella E., Oppenheim J. J., Matsushima K., The neutrophil-activating protein (NAP-1) is also chemotactic for T lymphocytes. Science 243, 1464–1466 (1989). [DOI] [PubMed] [Google Scholar]
- 31.Teachey D. T. et al. , Identification of Predictive Biomarkers for Cytokine Release Syndrome after Chimeric Antigen Receptor T-cell Therapy for Acute Lymphoblastic Leukemia. Cancer Discov 6, 664–679 (2016). [DOI] [PMC free article] [PubMed] [Google Scholar]
- 32.Akdis M. et al. , Interleukins (from IL-1 to IL-38), interferons, transforming growth factor (β, and TNF-α: Receptors, functions, and roles in diseases. Journal of Allergy and Clinical Immunology 138, 984–1010 (2016). [DOI] [PubMed] [Google Scholar]
- 33.Good C. R. et al. , An NK-like CAR T cell transition in CAR T cell dysfunction. Cell 184, 6081–6100.e6026 (2021). [DOI] [PMC free article] [PubMed] [Google Scholar]
- 34.Adusumilli P. S. et al. , A Phase I Trial of Regional Mesothelin-Targeted CAR T-cell Therapy in Patients with Malignant Pleural Disease, in Combination with the Anti-PD-1 Agent Pembrolizumab. Cancer Discov 11, 2748–2763 (2021). [DOI] [PMC free article] [PubMed] [Google Scholar]
- 35.Morgan R. A. et al. , Case report of a serious adverse event following the administration of T cells transduced with a chimeric antigen receptor recognizing ERBB2. Mol Ther 18, 843–851 (2010). [DOI] [PMC free article] [PubMed] [Google Scholar]
- 36.Kalbasi A. et al. , Potentiating adoptive cell therapy using synthetic IL-9 receptors. Nature 607, 360-+ (2022). [DOI] [PMC free article] [PubMed] [Google Scholar]
- 37.Xu J. et al. , HER2-specific chimeric antigen receptor-T cells for targeted therapy of metastatic colorectal cancer. Cell Death Dis 12, 1109 (2021). [DOI] [PMC free article] [PubMed] [Google Scholar]
- 38.Watanabe K. et al. , Pancreatic cancer therapy with combined mesothelin-redirected chimeric antigen receptor T cells and cytokine-armed oncolytic adenoviruses. JCI Insight 3, (2018). [DOI] [PMC free article] [PubMed] [Google Scholar]
- 39.Majzner R. G. et al. , CAR T Cells Targeting B7-H3, a Pan-Cancer Antigen, Demonstrate Potent Preclinical Activity Against Pediatric Solid Tumors and Brain Tumors. Clin Cancer Res 25, 2560–2574 (2019). [DOI] [PMC free article] [PubMed] [Google Scholar]
- 40.Liu X. et al. , Affinity-Tuned ErbB2 or EGFR Chimeric Antigen Receptor T Cells Exhibit an Increased Therapeutic Index against Tumors in Mice. Cancer Res 75, 3596–3607 (2015). [DOI] [PMC free article] [PubMed] [Google Scholar]
- 41.Ma L. et al. , Enhanced CAR-T cell activity against solid tumors by vaccine boosting through the chimeric receptor. Science 365, 162–168 (2019). [DOI] [PMC free article] [PubMed] [Google Scholar]
- 42.Liu X. et al. , A Chimeric Switch-Receptor Targeting PD1 Augments the Efficacy of Second-Generation CAR T Cells in Advanced Solid Tumors. Cancer Res 76, 1578–1590 (2016). [DOI] [PMC free article] [PubMed] [Google Scholar]
- 43.Kosti P. et al. , Hypoxia-sensing CAR T cells provide safety and efficacy in treating solid tumors. Cell Rep Med 2, 100227 (2021). [DOI] [PMC free article] [PubMed] [Google Scholar]
- 44.Kim S. P. et al. , Adoptive Cellular Therapy with Autologous Tumor-Infiltrating Lymphocytes and T-cell Receptor-Engineered T Cells Targeting Common p53 Neoantigens in Human Solid Tumors. Cancer Immunol Res 10, 932–946 (2022). [DOI] [PMC free article] [PubMed] [Google Scholar]
- 45.Jin B. Y. et al. , Engineered T cells targeting E7 mediate regression of human papillomavirus cancers in a murine model. JCI Insight 3, (2018). [DOI] [PMC free article] [PubMed] [Google Scholar]
- 46.Evgin L. et al. , Oncolytic virus-mediated expansion of dual-specific CAR T cells improves efficacy against solid tumors in mice. Sci Transl Med 14, eabn2231 (2022). [DOI] [PMC free article] [PubMed] [Google Scholar]
- 47.Feng Z. et al. , Potent suppression of neuroendocrine tumors and gastrointestinal cancers by CDH17CAR T cells without toxicity to normal tissues. Nat Cancer 3, 581–594 (2022). [DOI] [PubMed] [Google Scholar]
- 48.Hegde P. S., Chen D. S., Top 10 Challenges in Cancer Immunotherapy. Immunity 52, 17–35 (2020). [DOI] [PubMed] [Google Scholar]
- 49.Uslu U. et al. , Chimeric antigen receptor T cells as adjuvant therapy for unresectable adenocarcinoma. Science Advances 9, (2023). [DOI] [PMC free article] [PubMed] [Google Scholar]
- 50.Hu B. et al. , Augmentation of Antitumor Immunity by Human and Mouse CAR T Cells Secreting IL-18. Cell Reports 20, 3025–3033 (2017). [DOI] [PMC free article] [PubMed] [Google Scholar]
- 51.Hong D. S. et al. , Autologous T cell therapy for MAGE-A4. Nat Med 29, 104–114 (2023). [DOI] [PMC free article] [PubMed] [Google Scholar]
- 52.Weber J. S., Yang J. C., Atkins M. B., Disis M. L., Toxicities of Immunotherapy for the Practitioner. J Clin Oncol 33, 2092–2099 (2015). [DOI] [PMC free article] [PubMed] [Google Scholar]
- 53.Morgan R. A. et al. , Cancer regression and neurological toxicity following anti-MAGE-A3 TCR gene therapy. J Immunother 36, 133–151 (2013). [DOI] [PMC free article] [PubMed] [Google Scholar]
- 54.Bonifant C. L., Jackson H. J., Brentjens R. J., Curran K. J., Toxicity and management in CAR T-cell therapy. Mol Ther Oncolytics 3, 16011 (2016). [DOI] [PMC free article] [PubMed] [Google Scholar]
- 55.Rafiq S., Hackett C. S., Brentjens R. J., Engineering strategies to overcome the current roadblocks in CAR T cell therapy. Nat Rev Clin Oncol 17, 147–167 (2020). [DOI] [PMC free article] [PubMed] [Google Scholar]
- 56.Beatty G. L. et al. , Mesothelin-specific chimeric antigen receptor mRNA-engineered T cells induce anti-tumor activity in solid malignancies. Cancer Immunol Res 2, 112–120 (2014). [DOI] [PMC free article] [PubMed] [Google Scholar]
- 57.Johnson L. A., June C. H., Driving gene-engineered T cell immunotherapy of cancer. Cell Res 27, 38–58 (2017). [DOI] [PMC free article] [PubMed] [Google Scholar]
- 58.Cooper L. J. et al. , Manufacturing of gene-modified cytotoxic T lymphocytes for autologous cellular therapy for lymphoma. Cytotherapy 8, 105–117 (2006). [DOI] [PubMed] [Google Scholar]
- 59.Di Stasi A. et al. , Inducible apoptosis as a safety switch for adoptive cell therapy. N Engl J Med 365, 1673–1683 (2011). [DOI] [PMC free article] [PubMed] [Google Scholar]
- 60.Wang X. et al. , A transgene-encoded cell surface polypeptide for selection, in vivo tracking, and ablation of engineered cells. Blood 118, 1255–1263 (2011). [DOI] [PMC free article] [PubMed] [Google Scholar]
- 61.Zhao Z. et al. , Structural Design of Engineered Costimulation Determines Tumor Rejection Kinetics and Persistence of CAR T Cells. Cancer Cell 28, 415–428 (2015). [DOI] [PMC free article] [PubMed] [Google Scholar]
- 62.Milone M. C. et al. , Chimeric receptors containing CD137 signal transduction domains mediate enhanced survival of T cells and increased antileukemic efficacy in vivo. Mol Ther 17, 1453–1464 (2009). [DOI] [PMC free article] [PubMed] [Google Scholar]
- 63.Hinshaw D. C., Shevde L. A., The Tumor Microenvironment Innately Modulates Cancer Progression. Cancer Res 79, 4557–4566 (2019). [DOI] [PMC free article] [PubMed] [Google Scholar]
- 64.Anderson N. M., Simon M. C., The tumor microenvironment. Curr Biol 30, R921–R925 (2020). [DOI] [PMC free article] [PubMed] [Google Scholar]
- 65.Greten F. R., Grivennikov S. I., Inflammation and Cancer: Triggers, Mechanisms, and Consequences. Immunity 51, 27–41 (2019). [DOI] [PMC free article] [PubMed] [Google Scholar]
- 66.Landskron G., De la Fuente M., Thuwajit P., Thuwajit C., Hermoso M. A., Chronic inflammation and cytokines in the tumor microenvironment. J Immunol Res 2014, 149185 (2014). [DOI] [PMC free article] [PubMed] [Google Scholar]
- 67.Whiteside T. L., The tumor microenvironment and its role in promoting tumor growth. Oncogene 27, 5904–5912 (2008). [DOI] [PMC free article] [PubMed] [Google Scholar]
- 68.Wu P. H., Giri A., Wirtz D., Statistical analysis of cell migration in 3D using the anisotropic persistent random walk model. Nat Protoc 10, 517–527 (2015). [DOI] [PMC free article] [PubMed] [Google Scholar]
Associated Data
This section collects any data citations, data availability statements, or supplementary materials included in this article.
Supplementary Materials
Fig. S1. (A) LD, MD, and HD T cells were encapsulated in 3D collagen gels and their motility was monitored as described in Fig. 1 panels B to D. A custom Matlab software was used to randomly select 10 trajectories per condition. Plotted are x-y trajectories (μm). (B) Median T cell MSD was calculated and plotted versus time lag from all cell trajectories. (C) T cells that moved more than their own size (>R2 = 25 μm2, where R = 5 μm is the average T cell radius) in an hour of tracking were extracted and the median MSD was calculated and plotted versus time lag (min). (D) A Matlab script was coded to extract the percentage of motile T cells MSDs at a time lag of 9 min from the MSDs in panel C. (E) LD, HD, and LD + HD T cells were encapsulated in 3D collagen gels and imaged as described in Fig. 1E–G. Ten randomly selected re displayed per condition. (F) Median T cell MSDs for the indicated conditions. (G) MSDs of motile T cells were extracted as described in panel C. (H) MSDs of motile T cells at a time lag of 9 min from data in panel G. (I) LD T cells in 3D collagen gels were treated with exogenous cytokines and their motility was monitored as described in Fig. 1 panels J to L. Ten randomly selected trajectories (μm) per condition are shown. (J) Median T cell MSD was calculated and plotted for the indicated conditions. (K) MSDs of motile T cells were extracted as described in panel C. (L) MSDs of motile T cells at a time lag of 9 min, computed from MSDs, as described in panel C. (M) HD T cells in 3D collagen gels were treated with indicated antibodies and their motility was monitored as described in Fig. 1, M–O. Ten randomly selected x-y trajectories (μm) per condition are shown. (N) HD T cells in 3D collagen gels were treated with an anti-IL8R antibody and their motility was monitored as described in Fig. 1, M–O. Ten randomly selected x-y trajectories (μm) per condition are shown. (O) Median T cell MSDs for the indicated conditions. (P) Median T cell MSDs for HD control T cells or HD T cells treating with an anti-IL8R antibody. (Q) Motile MSDs were extracted and plotted in Matlab as described in panel C. (R) Matlab was used to extract and plot motile T cell MSDs at a time lag of 9 min from the MSDs in panel Q. (S) MSDs of motile T cells were extracted as described in panel C. (T) MSDs of T cells at a time lag of 9 min shown in panel S. (U) HD T cells in 3D collagen gels were treated with indicated JAK/STAT inhibitors and their motility was monitored as described in Fig. 1, P–R. Ten randomly selected trajectories per condition are shown. (V) Median MSDs of T cells for the indicated conditions. (W) MSDs of motile T cells were extracted as described in panel C. (X) MSDs of T cells at a time lag of 9 min computed from the MSDs in panel W.
All plots showing MSD vs. time lag are plotted using the median MSD. For all experiments measuring MSD at a time lag of 9 min, median with the SEM is plotted (n=2 technical replicates per biological replicate, N=2 biological replicates). Individual dots represent individual cells; an average of at least 80 cells per technical replicate, up to 989 cells per technical replicate were tracked (see source data). One-way ANOVA with Dunn’s multiple comparison test was used for statistical analysis (ns = not significant, ***P < 0.001).
Fig. S2. (A) VR design. Calculated are the number of VR constructs obtained from the indicated combination of domains. (B) VR-M5CAR T cell co-transduction scheme.
Fig. S3. (A) CD4+ and CD8+ primary human T cells were isolated from Ficoll-extracted PBMCs from human donor leukopaks and mixed 1:1. T cells were then activated overnight with CD3/CD28 Dynabeads and 100 IU/ml IL2. The following day, lentiviruses bearing plasmids with transgenes that encode for the specified VRs (see Fig. 2, panel A) were incubated on Retronectin-coated plates for 4 hrs at 37 °C and 5% CO2. Activated T cells were then added to lentivirus-bound Retronectin coated wells and incubated overnight. VR surface expression was detected the next day by flow cytometry after staining with anti-F(ab)2 antibodies for the VRs indicated, anti-IL5RA for V5, or anti-IFNGR1 for Vγsig. Non-transduced (NTD) T cells were used as a negative control. FlowJo was used to analyze the data and plot histograms normalized to mode. (B) The day following VR transduction, T cells were transduced overnight with M5CAR-P2A-eGFP (see Fig. 2, panel A) on lentivirus-bound Retronectin-coated plates. The next day, M5CAR expression was measured by GFP detection using flow cytometry. Non-transduced (NTD) T cells were used as a negative control. Data was analyzed and histograms normalized to mode were plotted in FlowJo. (C) LD M5CAR, LD VR-M5CAR, and HD M5CAR T cells were encapsulated in 3D collagen gels and their motility was monitored as described in Fig. 2, B–D. Ten randomly selected trajectories per condition were selected. (B) Median MSD of T cells vs. time lag. (E) T cells that moved more than their own size (>R2 = 25 μm2, where R = 5 μm is the average T cell radius) in an hour of tracking were extracted in Matlab and median MSD was calculated and plotted versus time lag. (F) MSDs of motile T cells at a time lag of 10 min, as described in panel E. (G) LD M5CAR or LD VR5αIL5-M5CAR, VR5αTNFα-M5CAR, or VR5αIL8-M5CAR cells were suspended in 3D collagen gels, treated with antibody inhibitors, incubated, and their motility was monitored as described in Fig. 2, E–G. Ten randomly selected trajectories (mm) per condition are shown. (H), (I), (J) Median T cell MSD was calculated and plotted using a custom Matlab software. (K), (L), (M) Motile MSDs were extracted and plotted in Matlab as described in panels H to J. (N), (O), (P) A custom Matlab script was used to extract and plot motile T cell MSDs at a time lag of 10 min from the MSDs in panels K to M.
All plots showing MSD vs time lag are plotted using the median MSD. For all experiments measuring MSD at a time lag of 10 min, median with the SEM is plotted (n=2 technical replicates per biological replicate, N=2 biological replicates for (F) and N=1 biological replicate for panel N to P). Individual dots represent individual cells; an average of at least 120 cells per technical replicate up to 269 cells per technical replicate were tracked (see source data). One-way ANOVA with Dunn’s multiple comparison test was used for statistical analysis (ns = not significant, *P < 0.05).
Fig. S4. (A) 2e6 ASPC1 pancreatic cancer tumors pre-mixed in 1:1 Matrigel:PBS were subcutaneously (s.c.) engrafted into 8-12 week old NSG mice. Tumor volumes were measured twice a week using digital calipers. When tumors were palpable (100 – 250 mm3), mice were randomized and blindly treated (8 days later) with a single intravenous (i.v.) dose of 3e6 NTD or M5CAR T cells. Tumor volumes were calculated as (L x W2) × 0.5 plotted as mm3. (B) ASPC1-bearing mice were treated with M5CAR alone or VR5α TNFα-M5CAR T cells as in panel A. (C) ASPC1-bearing mice were treated with M5CAR alone or VR5α IL8 T-M5CAR cells as in panel A. (D) ASPC1-bearing mice were treated with M5CAR alone or Vγsig-M5CAR T cells as in panel A. (E) ASPC1-bearing mice were treated with M5CAR alone or VR5α IL5--M5CAR T cells as in panel A. (F) ASPC1-bearing mice were treated with M5CAR alone or V5-M5CAR T cells as in panel A. (G) Mice were weighed at the end of the study. For all figure panels, tumor volumes (A to F) and body weights (G) are plotted as mean ± SEM (n = 5 mice per group, except for PBS for which n = 3). For panels A to F, two-tailed student’s t test was used for statistical analysis (ns = not significant, *P < 0.05, **P < 0.01). For panel G, ordinary one-way ANOVA with Tukey’s multiple comparison test was used for statistical analysis (ns = not significant).
Fig. S5. (A) ASPC1 pancreatic tumors were subcutaneously engrafted into NSG mice and measured as described in Fig. 3. Mice bearing ASPC1 tumors were treated with M5CAR T cells as described in Fig. 3. The kidney, pancreas, and spleen were harvested from day-25 mice. Organs were sectioned and IHC-stained with anti-human CD45 to detect T cell therapies as in Fig. 3. (B) Mice bearing ASPC1 tumors were treated with VR5α TNFα-M5CAR T cells as described in Fig. 3. The kidney, pancreas, and spleen were sectioned and IHC-stained with anti-human CD45 to detect T cell therapies as in Fig. 3. (C) ASPC1-bearing mice were treated with VR5α IL8-M5CAR T cells as described in Fig. 3. The kidney, pancreas, and spleen were sectioned and IHC-stained with anti-human CD45 for CAR detection. (D) ASPC1-bearing mice were treated with Vγsig-M5CAR T cells as described in Fig. 3. The kidney, pancreas, and spleen were sectioned and IHC-stained with anti-human CD45. (E) ASPC1-bearing mice were treated with VR5α IL5-M5CAR T cells as described in Fig. 3. The kidney, pancreas, and spleen were sectioned and IHC-stained with anti-human CD45 to detect human T cells as in Fig. 3. (F) ASPC1-bearing mice were treated with V5-M5CAR T cells as described in Fig. 3. The kidney, pancreas, and spleen were sectioned and IHC-stained with anti-human CD45 to detect T cell therapies as in Fig. 3. For figure panels A to F, scale bars in IHC micrographs are 500 μm. (G) Human CD45+ cell numbers were obtained as described in materials and methods. Tissue area was computationally obtained. Organ and tumor infiltration of human CD45+ cells per area were calculated and plotted. (n = 2 non-consecutive tissue slides were stained per treatment group). (H) Mouse body weights were collected at the end of the study. Body weights are plotted as mean ± SEM (n = 5 mice per group, except for PBS and NTD for which n = 4). Ordinary one-way ANOVA with Tukey’s multiple comparison test was used for statistical analysis (ns = not significant).
Fig. S6. (A) 5e6 H226 lung cancer tumors pre-mixed in 1:1 Matrigel:PBS were engrafted s.c. into 8-12 week old NSG mice. Tumor volumes were measured twice a week using digital calipers. When tumors were palpable (100 – 250 mm3), mice were randomized and blindly treated (10 days later) with a single i.v. dose of 3e6 NTD or M5CAR T cells. Tumor volumes were calculated as (L x W2) × 0.5 plotted as mm3. (B) H226-bearing mice were treated with M5CAR alone or VR5α TNFα-M5CAR T cells as in panel A. (C) Mice bearing H226 tumors were treated with M5CAR alone or Vγsig-M5CAR T cells as in panel A. (D) Mice bearing H226 tumors were treated with M5CAR alone or VR5α IL8-M5CAR T cells as in panel A. (E) H226-bearing mice were treated with M5CAR alone or V5-M5CAR T cells as in panel A. (F) Mice bearing H226 tumors were treated with M5CAR alone or VR5α IL5-M5CAR T cells as in panel A. (G) Mouse body weights were collected at the end of the study. For all figure panels, tumor volumes (A to F) and body weights (G) are plotted as mean ± SEM (n = 5 mice per group, except for PBS for which n = 2, NTD for which n = 3, and M5CAR alone and VR5α TNFα-M5CAR for which n = 4). For panels A to F, two-tailed student’s t test was used for statistical analysis (ns = not significant, *P < 0.05, **P < 0.01). For panel G, ordinary one-way ANOVA with Tukey’s multiple comparison test was used for statistical analysis (ns = not significant).
Fig. S7. (A) H226 lung tumors were subcutaneously engrafted into NSG mice and measured as described in Fig. 4. Mice bearing H226 tumors were treated with M5CAR T cells as described in Fig. 4. The kidney, pancreas, and spleen were harvested from day-19 mice. Organs were sectioned and IHC-stained with anti-human CD45 to detect T cell therapies as in Fig. 4. (B) Mice bearing H226 tumors were treated with VR5α TNFα-M5CAR T cells as described in Fig. 4. The kidney, pancreas, and spleen were sectioned and IHC-stained with anti-human CD45 to detect T cell therapies as in Fig. 4. (C) H226-bearing mice were treated with Vγsig-M5CAR T cells as described in Fig. 4. The kidney, pancreas, and spleen were sectioned and IHC-stained with anti-human CD45 for CAR detection. (D) H226-bearing mice were treated with VR5α IL8-M5CAR T cells as described in Fig. 4. The kidney, pancreas, and spleen were sectioned and IHC-stained with anti-human CD45. (E) H226-bearing mice were treated with V5-M5CAR T cells as described in Fig. 4. The kidney, pancreas, and spleen were sectioned and IHC-stained with anti-human CD45 to detect T cell therapies as in Fig. 4. (F) Mice bearing H226 tumors were treated with VR5α IL5-M5CAR T cells as described in Fig. 4. The kidney, pancreas, and spleen were sectioned and IHC-stained with anti-human CD45 to detect T cell therapies as in Fig. 4. For figure panels A to F, scale bars in IHC micrographs are 500 μm. (G) Human CD45+ cell numbers were obtained as described in materials and methods. Tissue area was computationally obtained. Organ and tumor infiltration of human CD45+ cells per area were calculated and plotted. (n = 2 non-consecutive tissue slides were stained per treatment group). (H) Mouse body weights were collected at the end of the study. Body weights are plotted as mean ± SEM (n = 5 mice per group, except for PBS for which n = 2, NTD for which n = 3, and M5CAR alone for which n = 4). Ordinary one-way ANOVA with Tukey’s multiple comparison test was used for statistical analysis (ns = not significant).