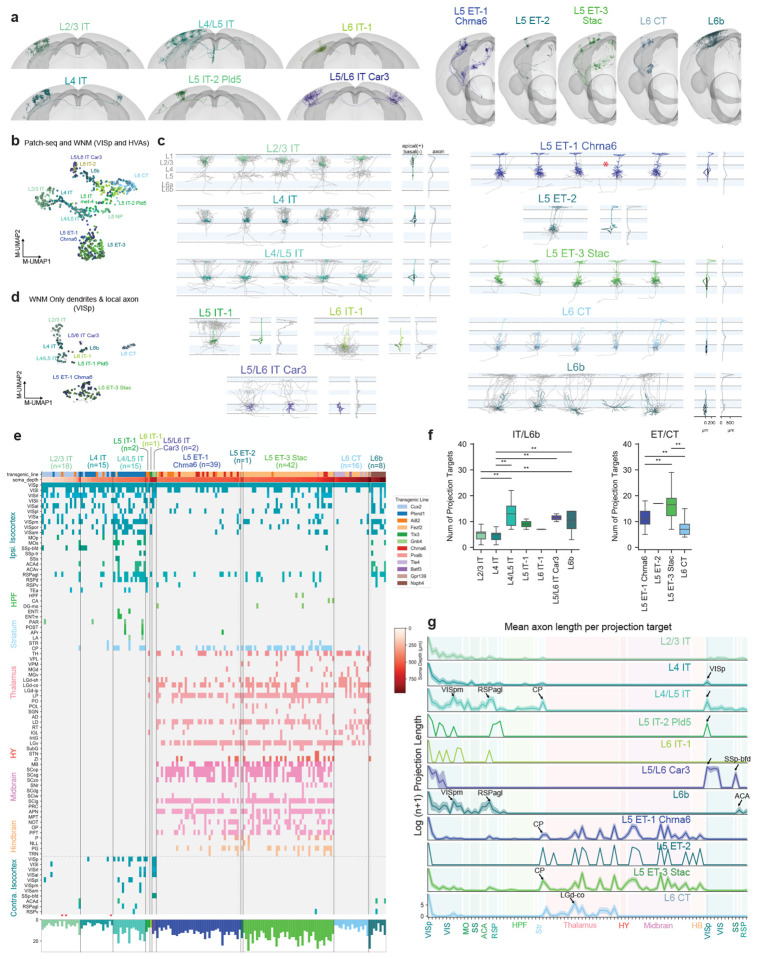
Figure 4: Local morphology and long-range projections of predicted VISp MET-types.
a, Example WNMs of predicted MET-types registered to CCFv3. b, UMAP based on principal components of dendritic morphology and soma location, colored by MET-type. WNMs are also circled in black. c, Local morphologies of predicted MET-types shown in (a). Example morphologies were selected by calculating a pairwise similarity score for dendrites, local axon, and laminar location. Dendrites of example neurons appear in MET-type colors. Local axon appears in gray. Starred neurons indicate the reconstructions that were generated based on T-type-specific Chrna6-IRES2-FlpO mice. d, UMAP based on principal components of dendritic and local axon morphology and soma location, colored by MET-type (WNMs only). e, Binary projection target matrix ordered first by MET-type and then by normalized cortical depth. Transgenic mouse line and soma depth are also indicated with a color bar at the top. Histograms at the bottom show the total number of targets per neuron. A ”target” was defined as a CCFv3 brain region containing a branch node or tip. Targets shown were contacted either by at least three neurons or at least two neurons from the same MET-type. A full projection target matrix appears in Supplementary Data Table 1. Stars indicate ”local” neurons that do not project out of their soma region. f, Box-and-whisker plots showing the average number of targets per MET-type. To determine significant differences in the number of MET-type targets, Kruskal-Wallis tests were performed followed by post-hoc Dunn tests. g, Projection target histogram summaries ordered by MET-type. Mean (lines) +/− SEM (shaded regions).

