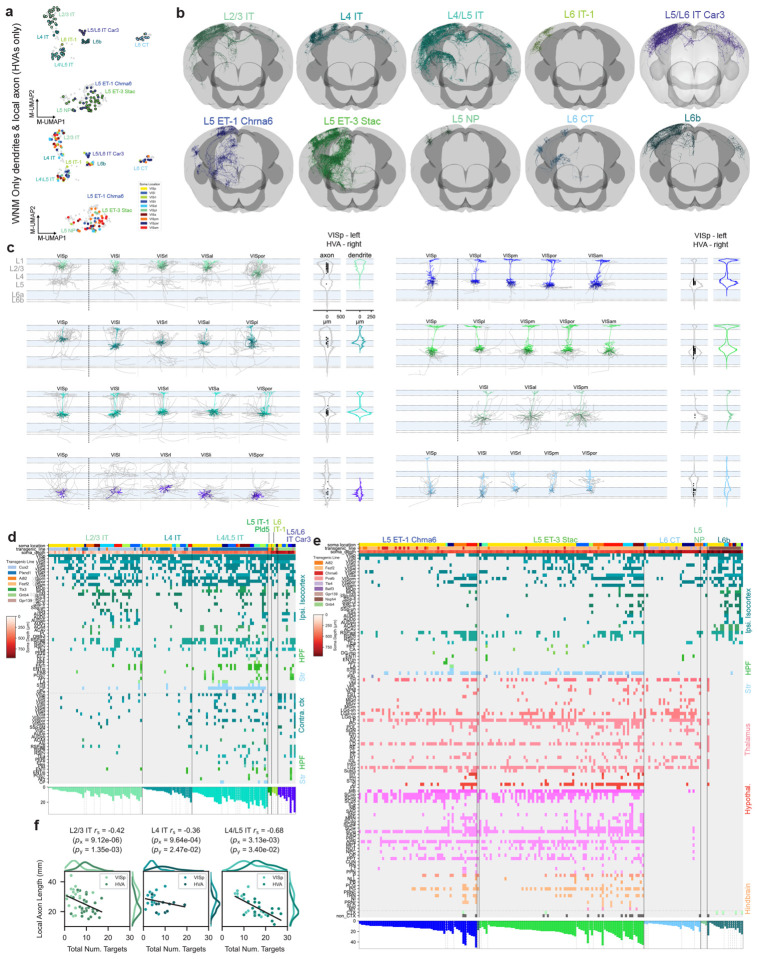
Figure 5: Local morphology and long-range projections of predicted MET-types in higher visual areas (HVAs), compared to VISp.
a, Top: UMAP based on principal components of dendritic and local axon morphology. HVA neurons are colored by MET-type; VISp neurons appear in gray. Middle: VIS cortical flatmap colored by structure. Bottom: UMAP based on principal components of dendritic and local axon morphology. HVA neurons are colored by soma location; VISp neurons appear in gray. Only WNMs shown in top and bottom. b, WNM of example neurons registered to CCFv3 by predicted IT MET-types and non-IT MET-types. c, Example local morphologies of predicted IT MET-types and non-IT MET-types in different VIS brain regions. Dendrites appear in MET-type colors. Local axon, which was not collected for the Patch-seq dataset, appears in gray. Only abundantly represented MET-types are shown in the figure. d, Binary projection target matrices for IT MET-types. Matrix is ordered first by MET-type, then by brain region sorted by the smallest to largest number of projection targets per region. Transgenic mouse line and soma depth are also indicated with a color bar at the top of the matrix. Histograms at the bottom show the total number of targets per neuron. e, Binary projection target matrices for non-IT MET-types. Matrix is ordered first by MET-type, then by brain region sorted by the smallest to largest number of projection targets per region. Transgenic mouse line and soma depth are also indicated with a color bar at the top of the matrix. Histograms at the bottom show the total number of targets per neuron. f, Scatter plots illustrating the relationship between local axon total length and the number of projection targets for IT MET-types in VISp and HVA neurons.

