Abstract
Topographical abnormality in corneal tissue is a common diagnostic marker for many eye diseases and injuries. Using an asynchronous optical sampling terahertz time-domain spectroscopy setup, we developed a non-contact and normal-incidence imaging system to measure topographic changes along the surface of spherical samples. We obtained orthogonal 1D scans of calibration spheres to evaluate the minimum axial resolution of our system. We determined the axial and spatial resolution of the scanner using 3D-printed spherical cross and Boehler star targets. Furthermore, we characterized the asymmetrical performance of the scanner due to the use of an off-axis parabolic mirror. Finally, we developed an edge-detection filter to aid with improving the topographic scans. We showed that when imaging samples were comparable in size to the human cornea, the axial and spherical spatial resolutions were limited to about 15 μm and 1 mm, respectively.
Corneal topography is a key parameter when diagnosing many eye diseases, such as keratoconus [1]. However, current techniques to measure corneal topography, such as optical coherence tomography or videokeratography, are hindered by a limited field-of-view (FOV) and inability to concurrently provide spectroscopic information. Terahertz (THz) reflectometry has been proposed as a new approach for hydration sensing in the human cornea, because THz radiation is non-ionizing and is sensitive to absorption by tissue water content [2]. Previous in vivo hydration sensing studies have used THz source centered at 650 GHz in a collocated reflection configuration, but were unable to assess the surface profile or map the topography of the cornea [3]. The discrepancies between the quasi-optical theory and the THz imaging results were explained using coupling coefficient fits attributed to optical misalignments. Importantly, the axial and spatial resolution limits of this spherical scanning setup over its wide FOV were not determined. Here we present galvano scanner beam steering [3,4] combined with a novel time-domain methodology to accurately align a spherical scanner and quantitatively determine its optical performance. The terahertz time-domain spectroscopy (THz-TDS) scanner proposed here would allow for a unique combination of concurrent hyperspectral imaging [5,6] (e.g., for hydration sensing [7]) and topography of the cornea and other spherical targets.
By navigating a THz beam perpendicular to the surface of a spherical target, changes in the time of arrival (TOA) of the reflected beam to the detector can be used to extract topographical information. In this Letter, we integrated a collocated THz-TDS system with a gimballed mirror for precise alignment and coupling of the THz beam to an off-axis parabolic mirror (OAPM), to enable raster scanning of spherical targets and measurement of surface profile variations. We determined the limits of the scanner’s ability to measure surface heights and depth profiles. We characterized the limitations imposed by the asymmetric FOV of the OAPM and the beam spot size variations. Finally, we used 3D-printed spherical targets to determine its spatial and axial resolution limits.
To accurately assess the surface topography in a collocated geometry, normal incidence at all scanned locations along the sample curvature is needed to prevent any lateral beam displacement, which can limit the accessible depth in the sample [8]. To achieve this objective, as shown in Fig. 1, a 90° OAPM was mounted such that its focal point was coincident with the center of curvature of the spherical sample. An OAPM with an effective focal length of and a diameter of 76.2 mm (Edmunds Optics, U.S.) was used, because the total FOV would be sufficient for future human cornea scanning [4].
Fig. 1.
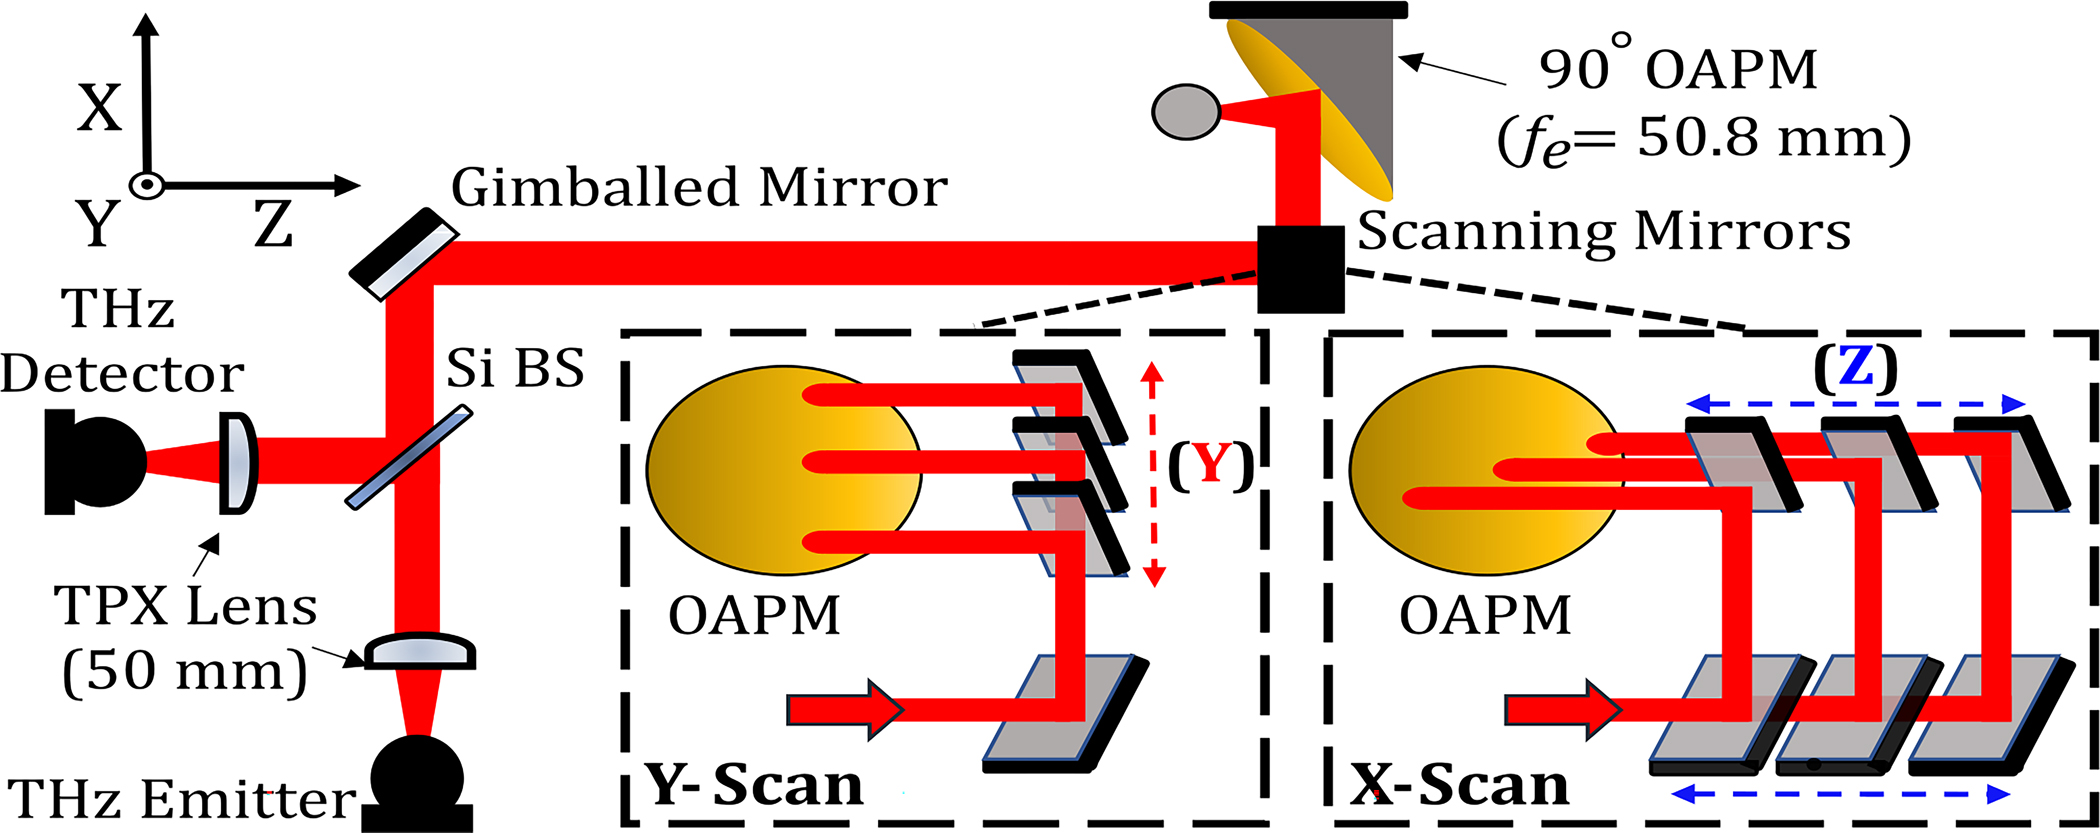
Schematic of the THz-TDS scanner for topography of spherical targets. A collimated THz beam is produced from a co-located reflection and is steered across the aperture of an OAPM using two translating scanning mirrors as detailed in the insets.
Figure 1 shows the integration of a THz-TDS reflection setup with the spherical scanner. A photoconductive antenna emitter and detector (Menlo Systems, Inc.) are used to generate/acquire a THz beam and are optically co-located together using a high-resistivity silicon wafer beam splitter. Upon a reflection off an optional 45° gimballed flat mirror added for precise alignment, the collimated beam is then reflected off two 45° flat mirrors, each mounted on a stepper motorized stage. These two “scanning” mirrors steer the collimated beam across the aperture of the OAPM. The focused beam achieved normal incidence on the spherical sample using the principle discussed in the previous paragraph. Upon reflection and returning through the same path to the beam splitter, the beam is refocused onto the detector. The THz signal is recorded through asynchronous optical sampling (ASOPS) using 1550 nm mode-locked femtosecond laser pulses (100 MHz repetition rate and 100 Hz difference frequency), eliminating the need for a delay-stage and resulting in a fast data acquisition rate of 10 milliseconds/pixel.
To align the collimated THz beam, an optically flat target was mounted at the location of the OAPM. Two orthogonal profile measurements were obtained on the target surface. A constant TOA over the FOV of the scanning mirrors would indicate the accurate alignment of the collimated beam. In agreement to prior simulations, the smallest change in surface height variation that the limited bandwidth of our THz-TDS system could measure was around 20 μm [9]. This limit was used to determine if the beam was well-aligned in subsequent line scans. The elevational and azimuthal stepper motors of the gimballed mirror were adjusted, ensuring that the collimated beam is perpendicular to the flat mirror. Additionally, beam alignment was further optimized to ensure that the peak–peak amplitude of the pulse was constant over the range of line scans. Next, the flat target was replaced with the OAPM. This alignment procedure using TOA and THz amplitude proved to be critical to achieve excellent agreement between the theoretical calculations and experimental results described below.
Spatial sampling of images was based on equiangular scanning, translation of the beam such that pixels are spaced in equal increments of angles and , defined in Fig. 2. The geometrical transformations used to calculate the equiangular scan for an OAPM with focal length are given by [3]
| (1) |
| (2) |
where and are the positions of the collimated beam along the OAPM aperture. These scanning trajectories of the collimated beam directed to the OAPM are shown in Fig. 3(a), with the resulting distribution of pixels on an 8 mm sphere in Fig. 3(b).
Fig. 2.

Definition of and at the OAPM’s focal point.
Fig. 3.
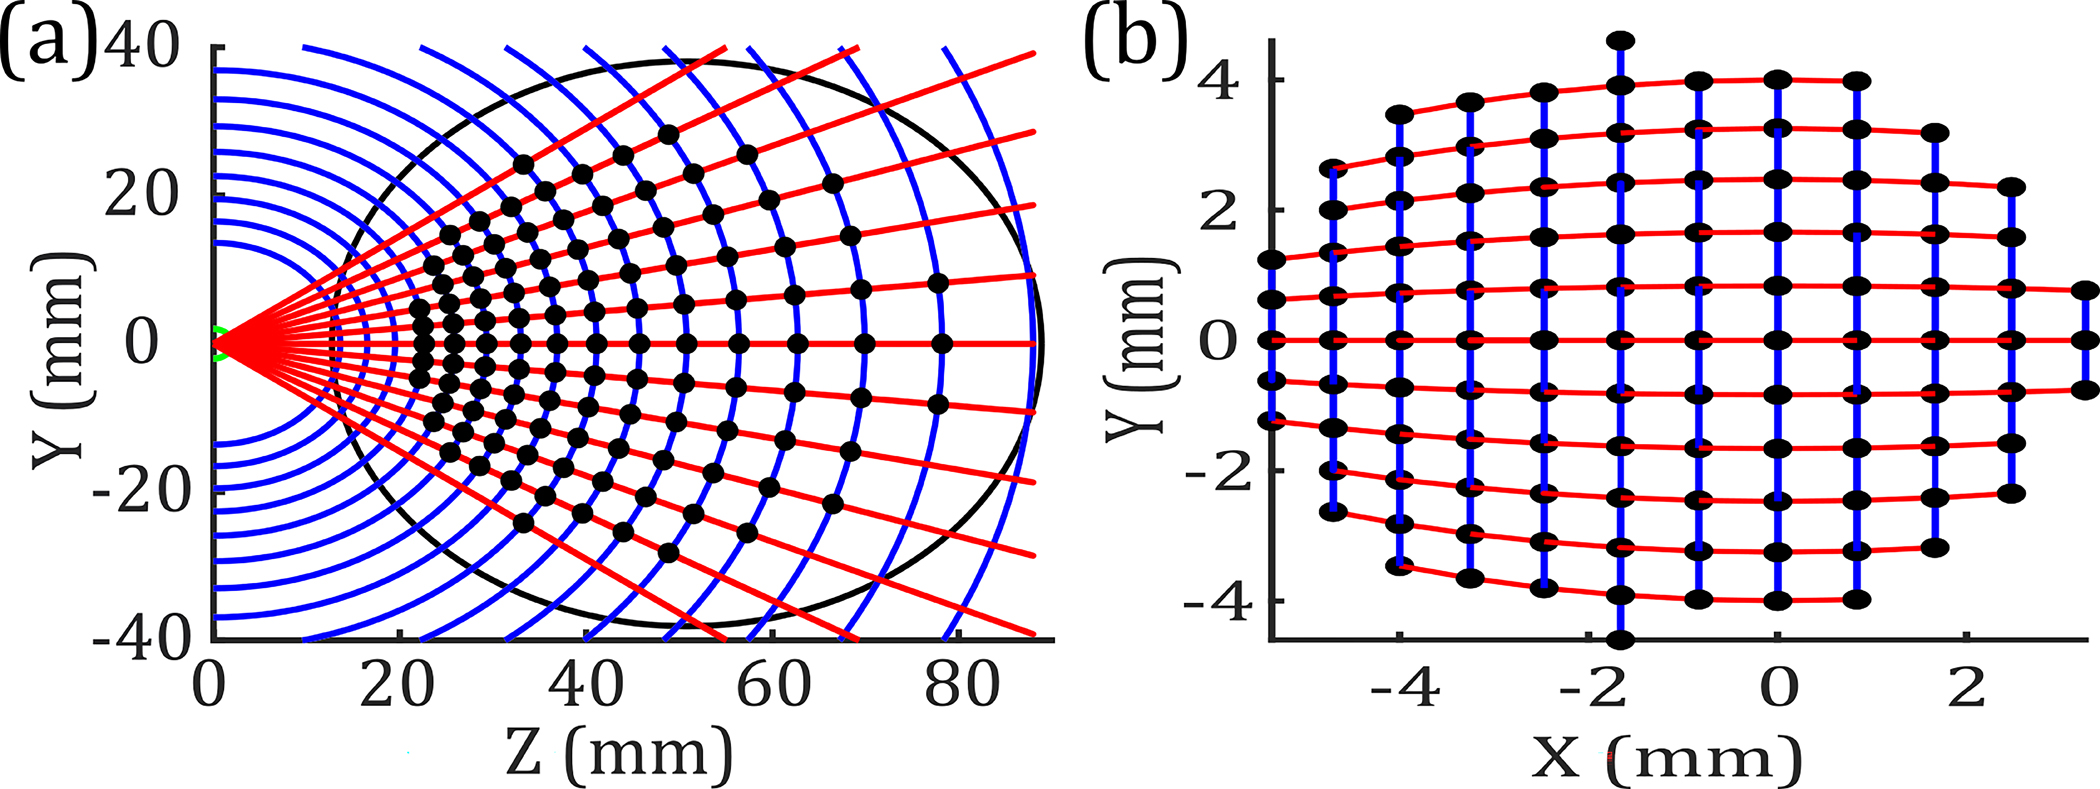
(a) Optical paths of evenly spaced (blue) and (red) along the aperture of the OAPM. The black markers show the center of the collimated beam to equiangularly scan the sample. (b) Distribution of pixels along the surface of an 8 mm radius sphere.
Here topography refers to the surface height calculated using the TOA of the reflected beam, which is measured with a 0.01 ps resolution. A baseline measurement was defined as the TOA of the focused beam on the spherical sample corresponding to . The difference in TOA between any measurement and the baseline provides the difference in depth or surface height by a simple conversion. However, when using TOA to extract the surface profile, a correction must be made to account for the change in the beam path, shown in Fig. 3(a), within the scanning section of the apparatus. This change was calculated easily using the combined linear displacement of the stages used for beam steering.
To determine the system’s axial resolution in measuring surface height variations, two stainless steel spheres of different radii were used ( and ). Each sphere was separately aligned to the OAPM, and two orthogonal scans along the and axes were measured. The TOA of each pixel was compared to a baseline measurement obtained at the intersection of the two orthogonal scans . Variations in corrected TOA from the baseline for an ideal sphere were converted to surface height profiles, as shown in Figs. 4(b) and 4(c). The maximum deviation from an ideal sphere, attributed to the systematic error, was measured to be about 15 μm, smaller than the TOA resolution limit of our system. In addition, the random error of the system was measured by the drift in the TOA of the THz pulse on a fixed position (apex of the metallic sphere) over the course of 5 min. This random error, attributed to the laser timing jitter, was equal to 0.05 ps (~10 μm). Therefore, we concluded that the spheres were smooth and well-aligned within the tolerance of the spherical scanner.
Fig. 4.
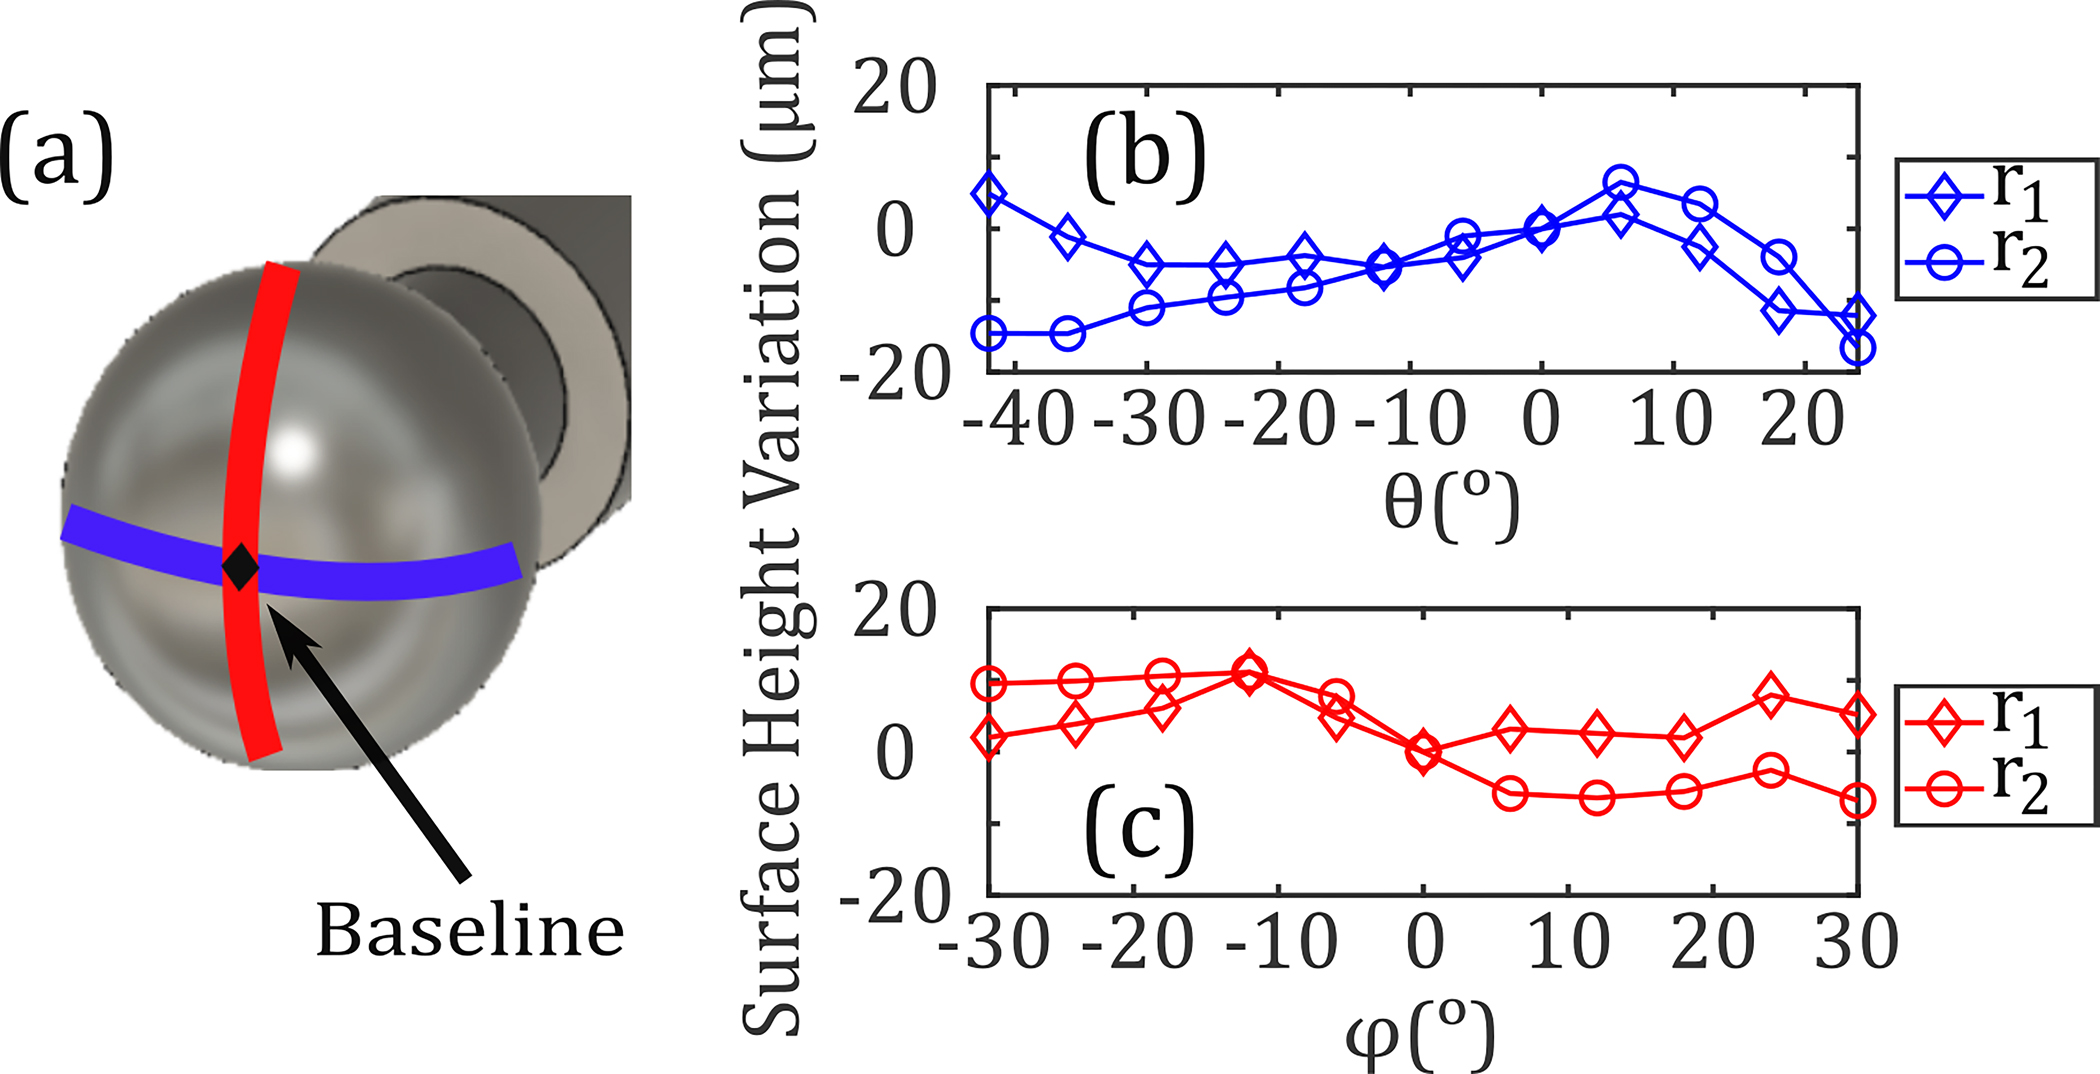
(a) Orthogonal (blue) and (red) equiangular scans along two stainless steel spheres with radii and are shown. The surface profiles along the (b) and (c) directions are plotted; the maximum deviation with respect to a baseline measurement obtained at was approximately 15 μm.
Figure 5 characterizes the performance of the scanner in topographic imaging. Five spherical samples having 8 mm radii but with unique surface features were 3D printed with 25 μm resolution (Formlabs, Inc.). Three samples consisted of four regions of variable depth, resulting in a cross-shaped target shown in Fig. 5(a). Verification of the printing process is shown in Fig. 5(b) using optical profilometry (Zygo Corp.). A line scan obtained along the axes [blue line in Fig. 5(a)] displayed a significant increase in the full-width at half-maximum (FWHM) of the time-domain pulse when passing along the edges of the 100 and 50 μm deep regions. This broadening is due to the time-domain system’s limitation in resolving two distinct pulses, whose TOA difference is smaller than the FWHM of a THz-TDS signal. Therefore, the superposition of two pulses results in increased FWHM. We developed an edge-detection algorithm based on a FWHM filter as described in the following. The expected FWHM was determined from an equiangular scan of the stainless steel sphere of the same radius. We calculated the mean FWHM for all pixels to be 0.49 ps with a standard deviation of 0.01 ps. This information was used to develop a FWHM filter for evaluating depth profiles of the 3D-printed targets. The pixels corresponding to the edges are located using the change in the FWHM, resulting in three regions identified in Fig. 5(c). Within each region, the median depth value, , was calculated. For any given pixel, if the difference between its FWHM and the expected value was greater than three times the standard deviation, the depth value was replaced with of the region. The median value was chosen based on the median filter technique, commonly used to highlight edge detection [10].
Fig. 5.
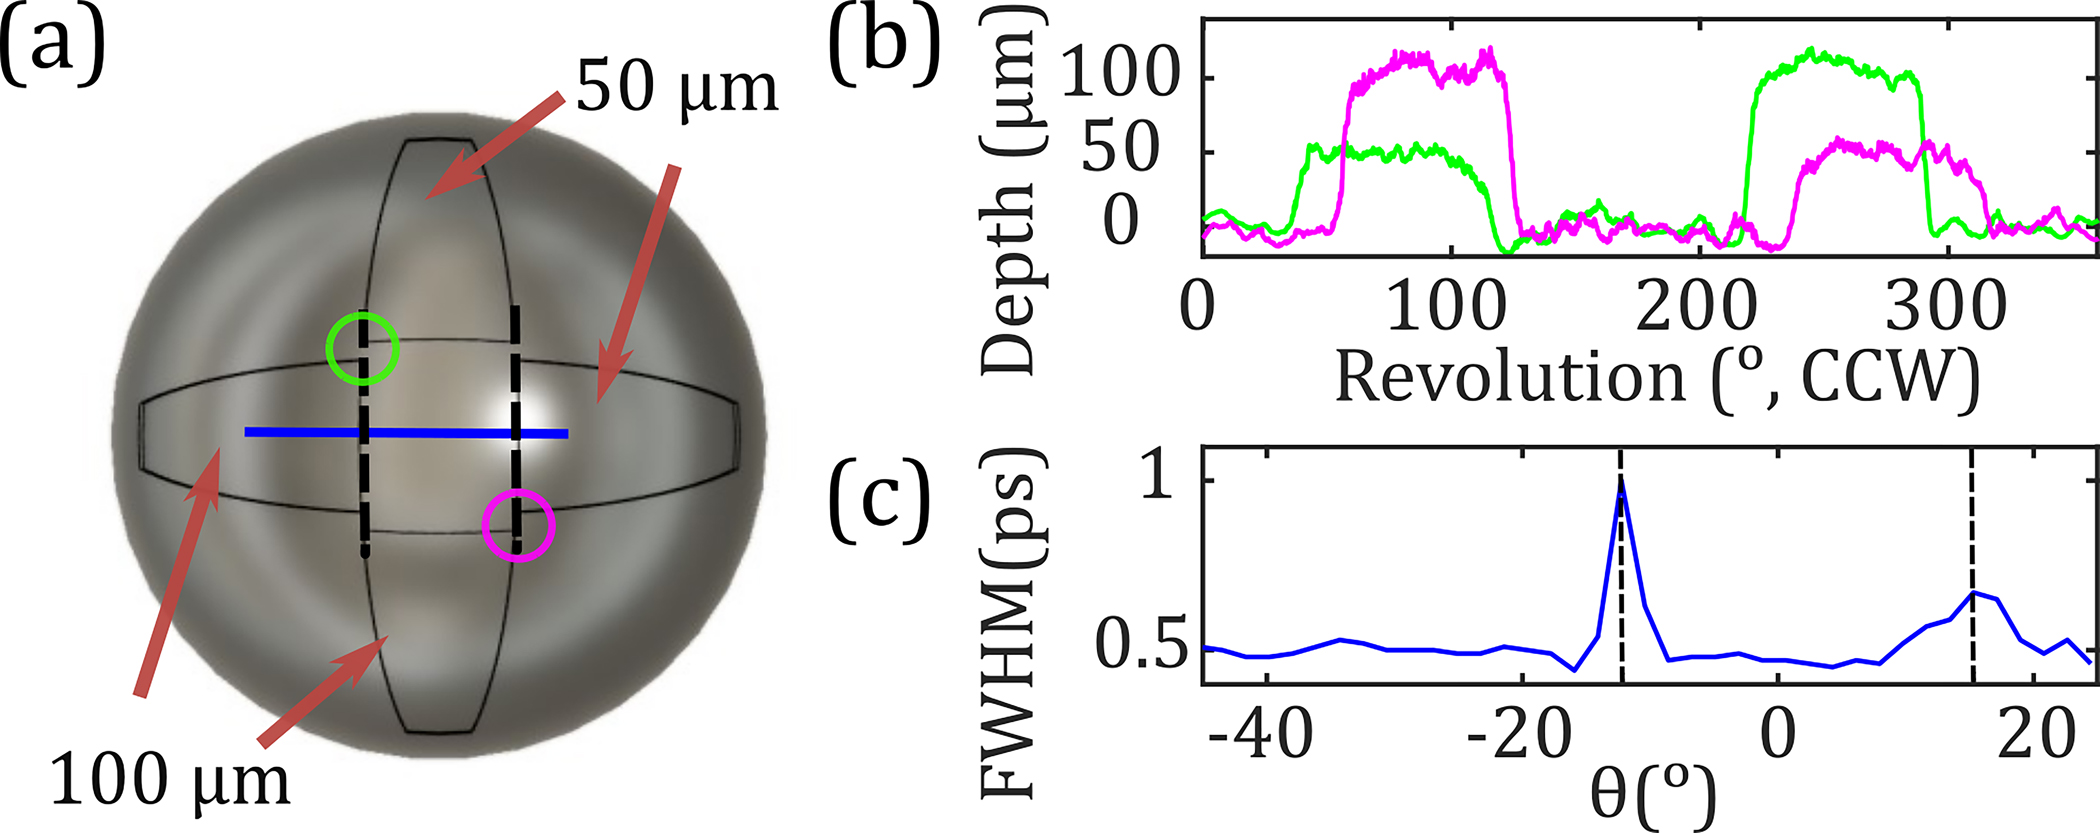
(a) Picture of a 3D-printed sample. (b) Depth profiles moving CCW around the circles in (a) measured using optical profilometry. (c) FWHM of the detected TD pulse along the blue line in (a) with dashed vertical lines showing at the edges.
Figure 6(a) shows a 50 × 22-pixel equiangular scan ( and ) of the sample in Fig. 5(a). Using the FWHM filter, the depth profiles were extracted along the horizontal, vertical, and diagonal axes of the image. These depth profiles were plotted in Fig. 6(b) as a function of the deflection angle, , which is defined as the angle the focused beam makes with the surface normal when . The diagonal green and pink lines in Fig. 6(a) do not pass through the wedges created on the sample surface. Therefore, the extracted surface height variations are approximately zero within the scanner measurement resolution of 15 μm. Meanwhile, the horizontal (blue) and vertical (black) trajectories pass through the 100 and 50 μm regions, in agreement with the measured surface depth profiles shown in Fig. 6(b).
Fig. 6.
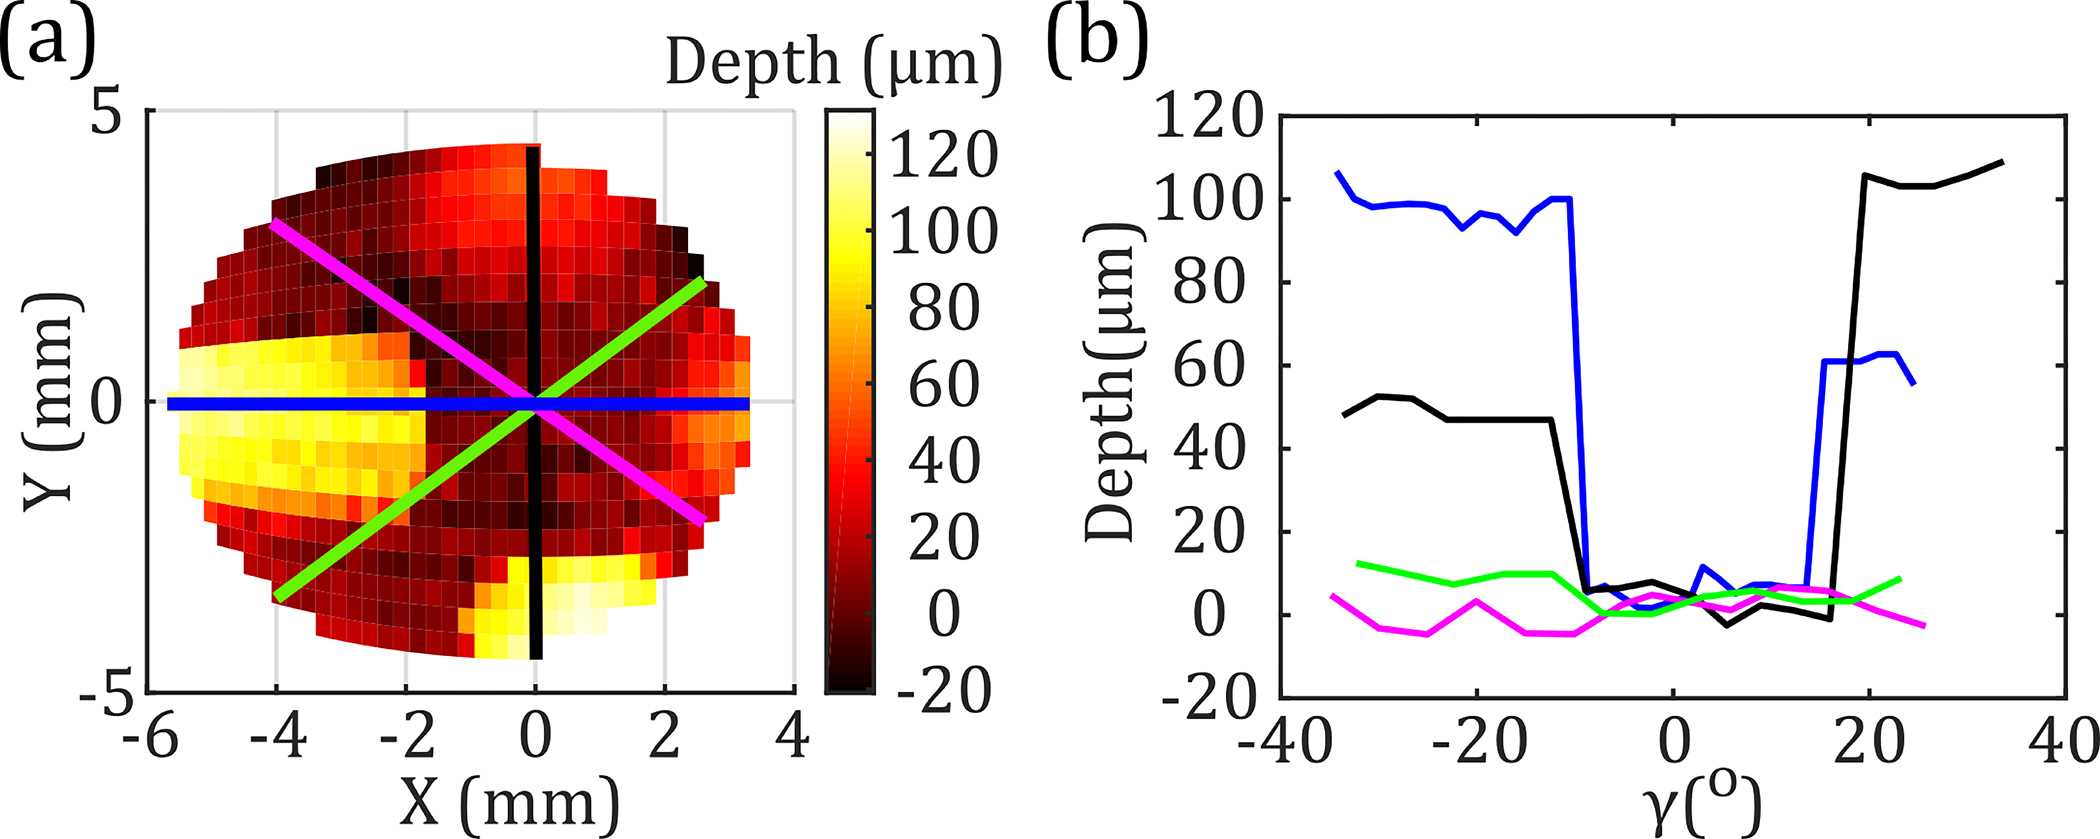
(a) Equiangular scan of the target shown in Fig. 5(a). (b) Surface profiles along the colored lines in (a) are shown with respect to angular deflection , after applying a FWHM filter.
Additionally, we can see in Figs. 5(b) and 6(b) that the horizontal (blue) traces are not symmetrical around the axis due to the asymmetric range of the OAPM along the axis {−62.8° to 30.7°} [4]. To characterize the effect of this asymmetrical FOV, a sample consisting of a symmetrically centered cross [Fig. 7(a)] was compared to a sample with a cross deliberately offset by 10.4° towards negative [Fig. 7(b)]. The offset shift was precisely calculated to center the obtained equiangular THz image, shown in Figs. 7(c) and 7(d), respectively. Using the described FWHM filter, the horizontal (blue) and vertical (black) traces in Figs. 7(e) and 7(f) show the recessed regions of the samples having depth measurements within 15 μm of the expected values. In addition, the diagonal profiles of each sample show similar baseline zero-depth readings. Evaluating the horizontal (blue) depth profiles of the centered [Fig. 7(e)] and offset [Fig. 7(f)] crosses, we observe a symmetrical and -shifted sampling of the right 50 μm depth region for the offset cross. These results confirm the 10.4° asymmetrical rotation observed in the FOV of equiangular images in the axis.
Fig. 7.
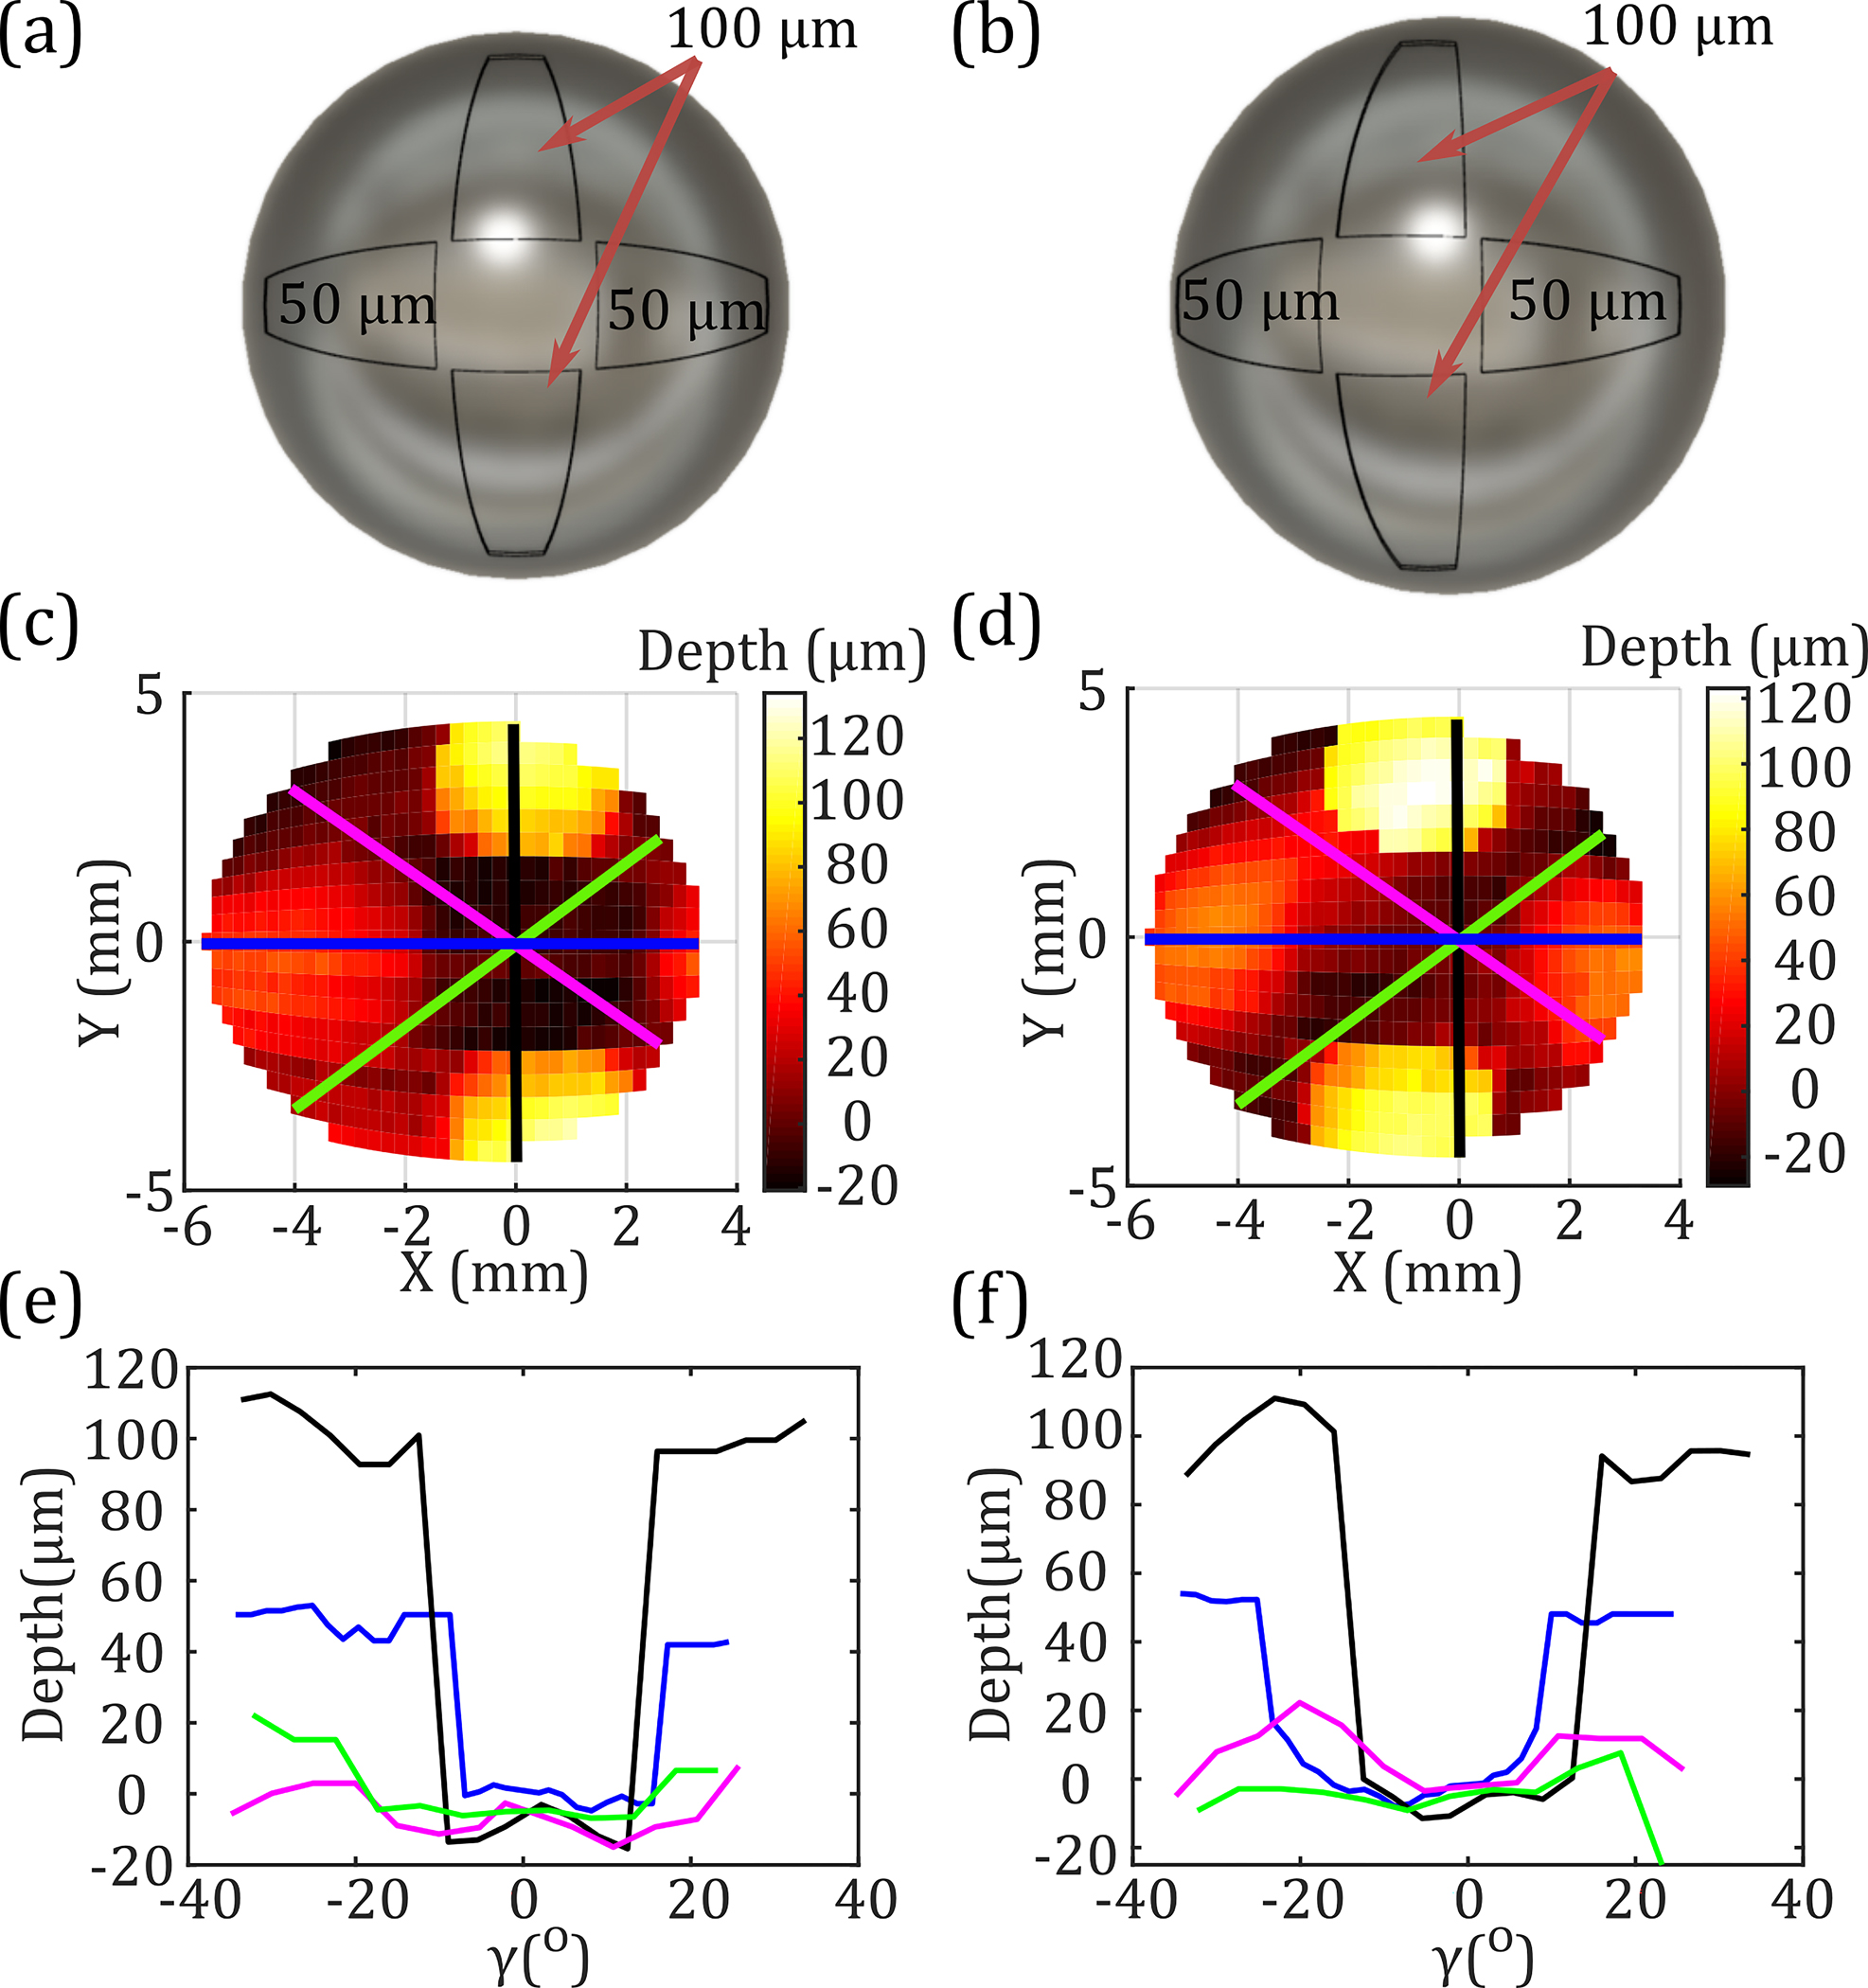
CAD models of (a) centered and (b) offset cross shapes 3D-printed with symmetrical 50 and 100 μm indentations. Equiangular THz images of the surface height of the two samples (c) and (d). Depth profiles extracted similarly to Fig. 6(b) are shown in (e) and (f).
Finally, the spatial resolution of the system as a function of the asymmetrical FOV was determined using a novel adaptation of two Boehler stars [11] resin-printed on spherical targets. Each 8 mm radius sphere consists of four petals having 100 μm deep indentations, as shown in Figs. 8(a) and 8(b). In spherical spatial resolution measurements, all scanned pixels had the same arclength distance, defined as the so-called orthodromic scanning. In an orthodromic trajectory, the following transform for is needed, whereas no correction is necessary for [3]:
| (3) |
where is the angle a great circle makes with respect to the focus. Then and were used in Eqs. 1 and 2 to find the necessary translation of the beam along the OAPM. Both stars were scanned in a 37 × 46-pixel orthodromic image , shown in Figs. 8(c) and 8(d). It should be noted that the shift in the center of Boehler star in Fig. 8(c) as compared to the CAD model agrees with the asymmetrical nature of the OAPM discussed earlier.
Fig. 8.
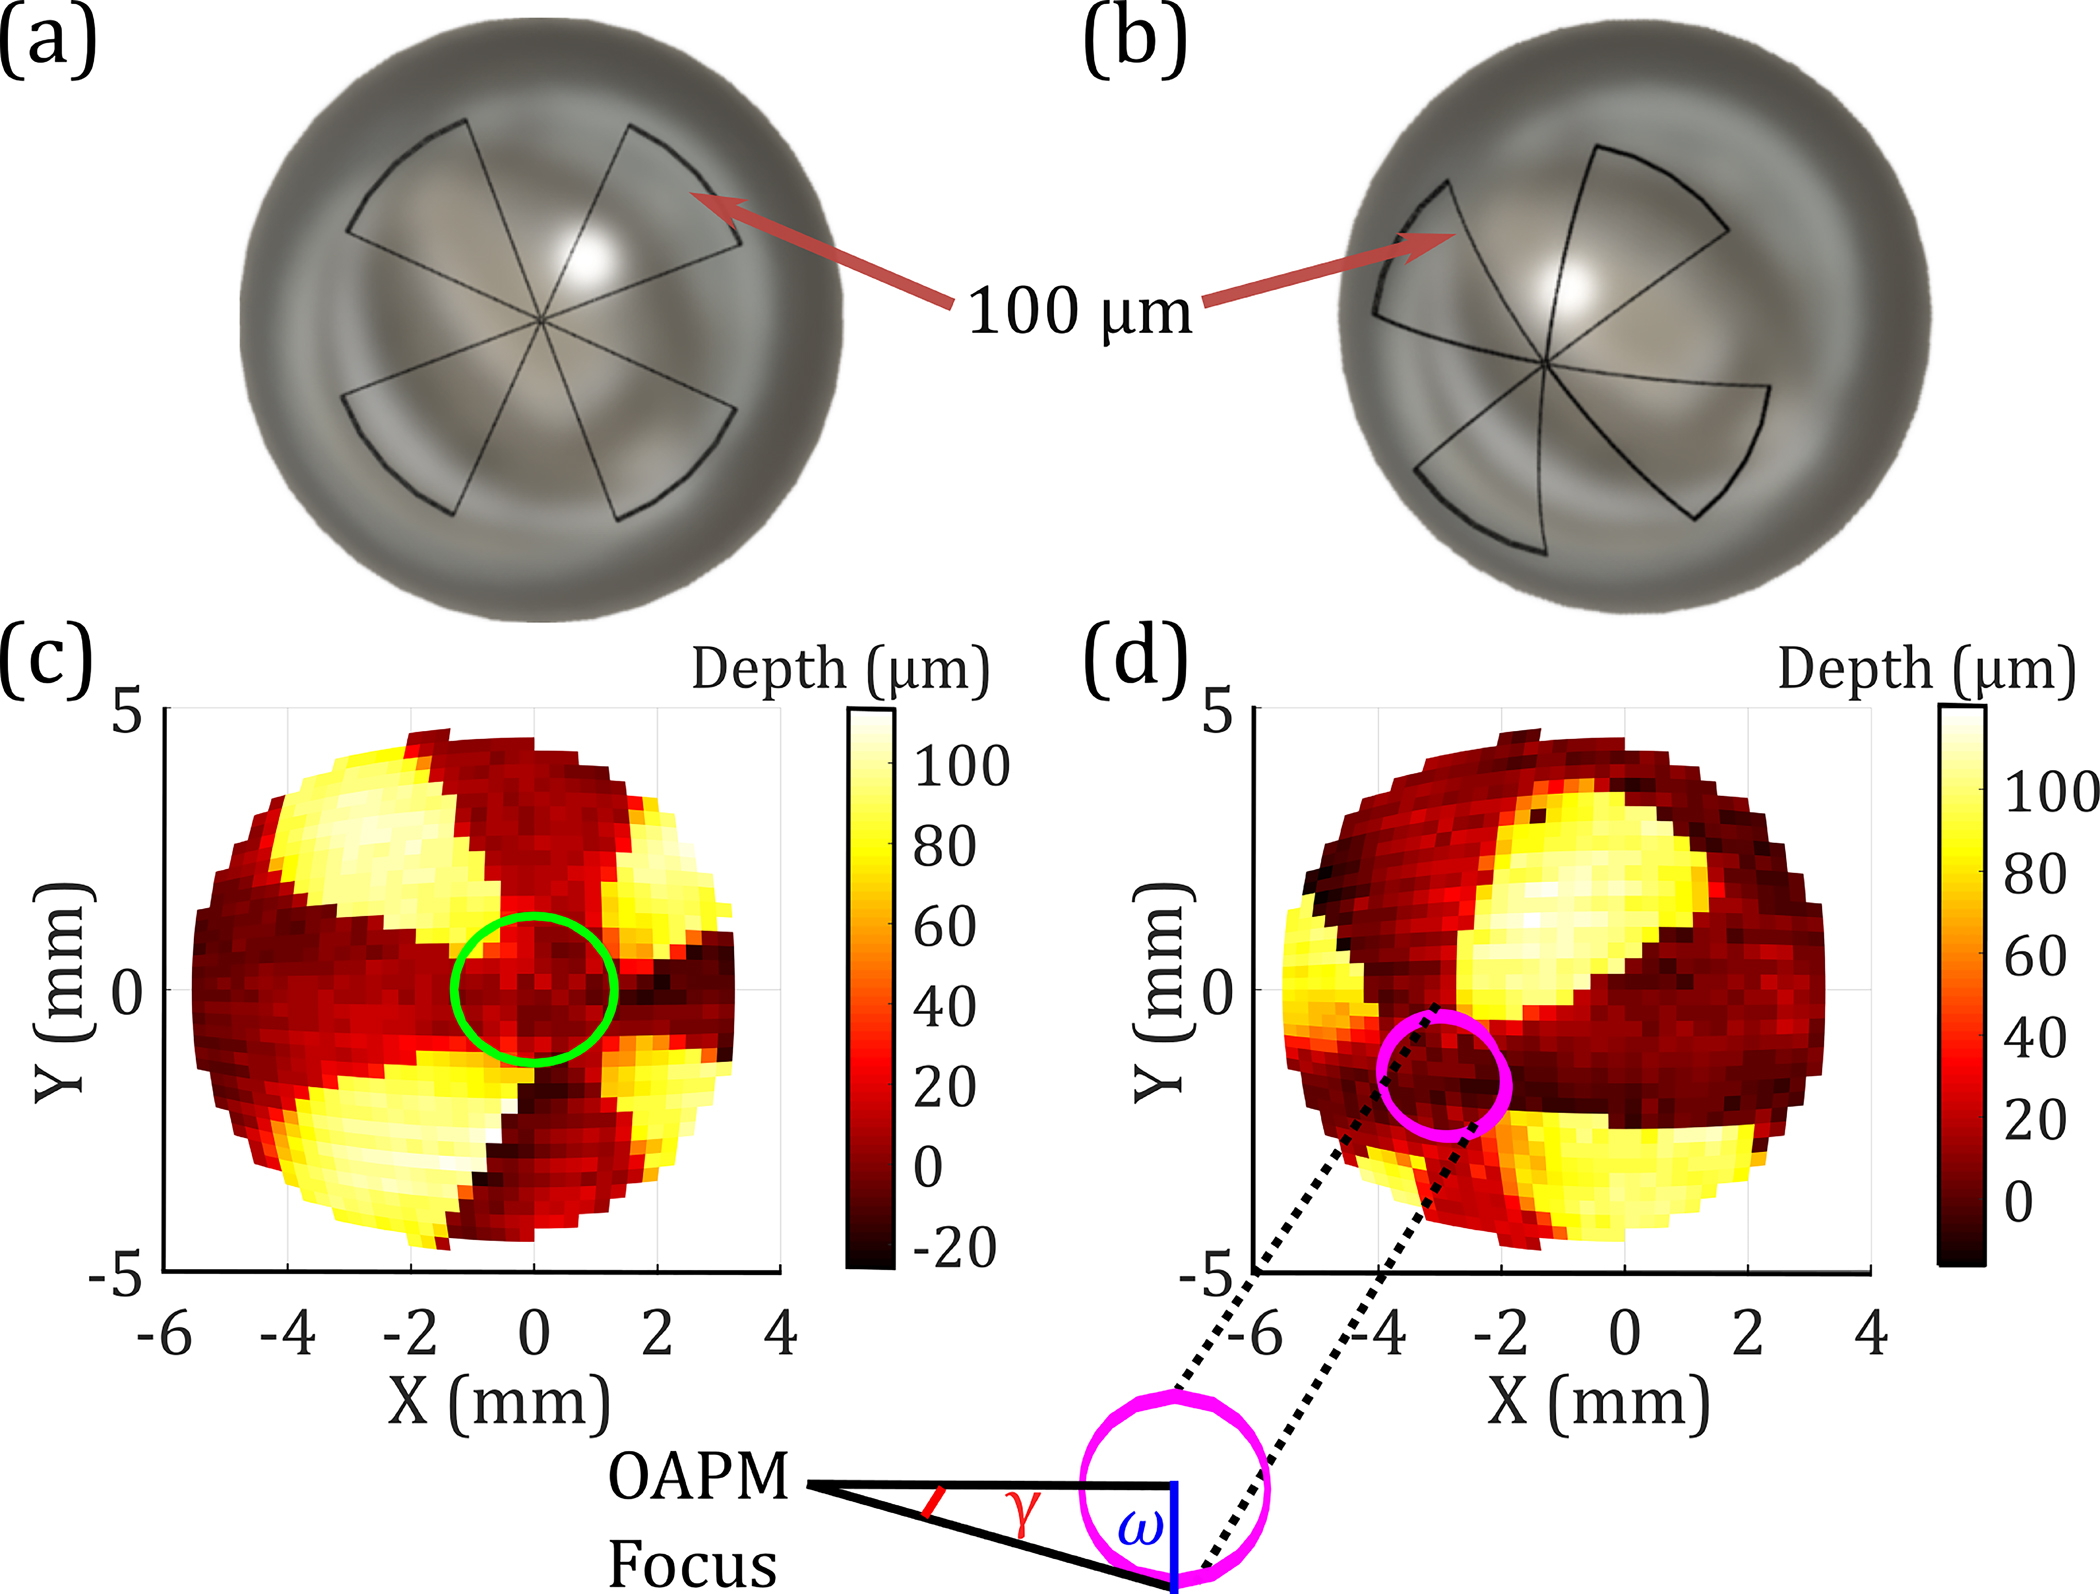
CAD model of the (a) centered and (b) offset spherical Boehler star. (c), (d) An orthodromic THz scan of the targets.
To extract the spherical spatial resolution, , concentric rings around the center of each star were evaluated. Each ring is treated as the base of a cone, whose vertex was at the focal point of the OAPM, as shown in Fig. 8(d). Each cone’s base radius, , is related to the deflection angle, . For each ring, the Fourier transform of the THz image is calculated for the unwrapped surface height of all measured pixels, shown in Fig. 9(a). We examined the spectral amplitude of the fourth spatial harmonic. For each value of , we determined the cone base radius , which was then used to calculate the spherical spatial resolution, , using the formula , where is the number of petals. Figure 9(b) shows the normalized fourth spatial harmonic of the spectral amplitude of the centered and offset samples as a function of resolution, . By setting the cutoff of the fourth spatial harmonic to 25% of its maximum (the dashed line), we determined the spatial resolution to be 1 mm for the centered and 0.8 mm for the offset positions.
Fig. 9.
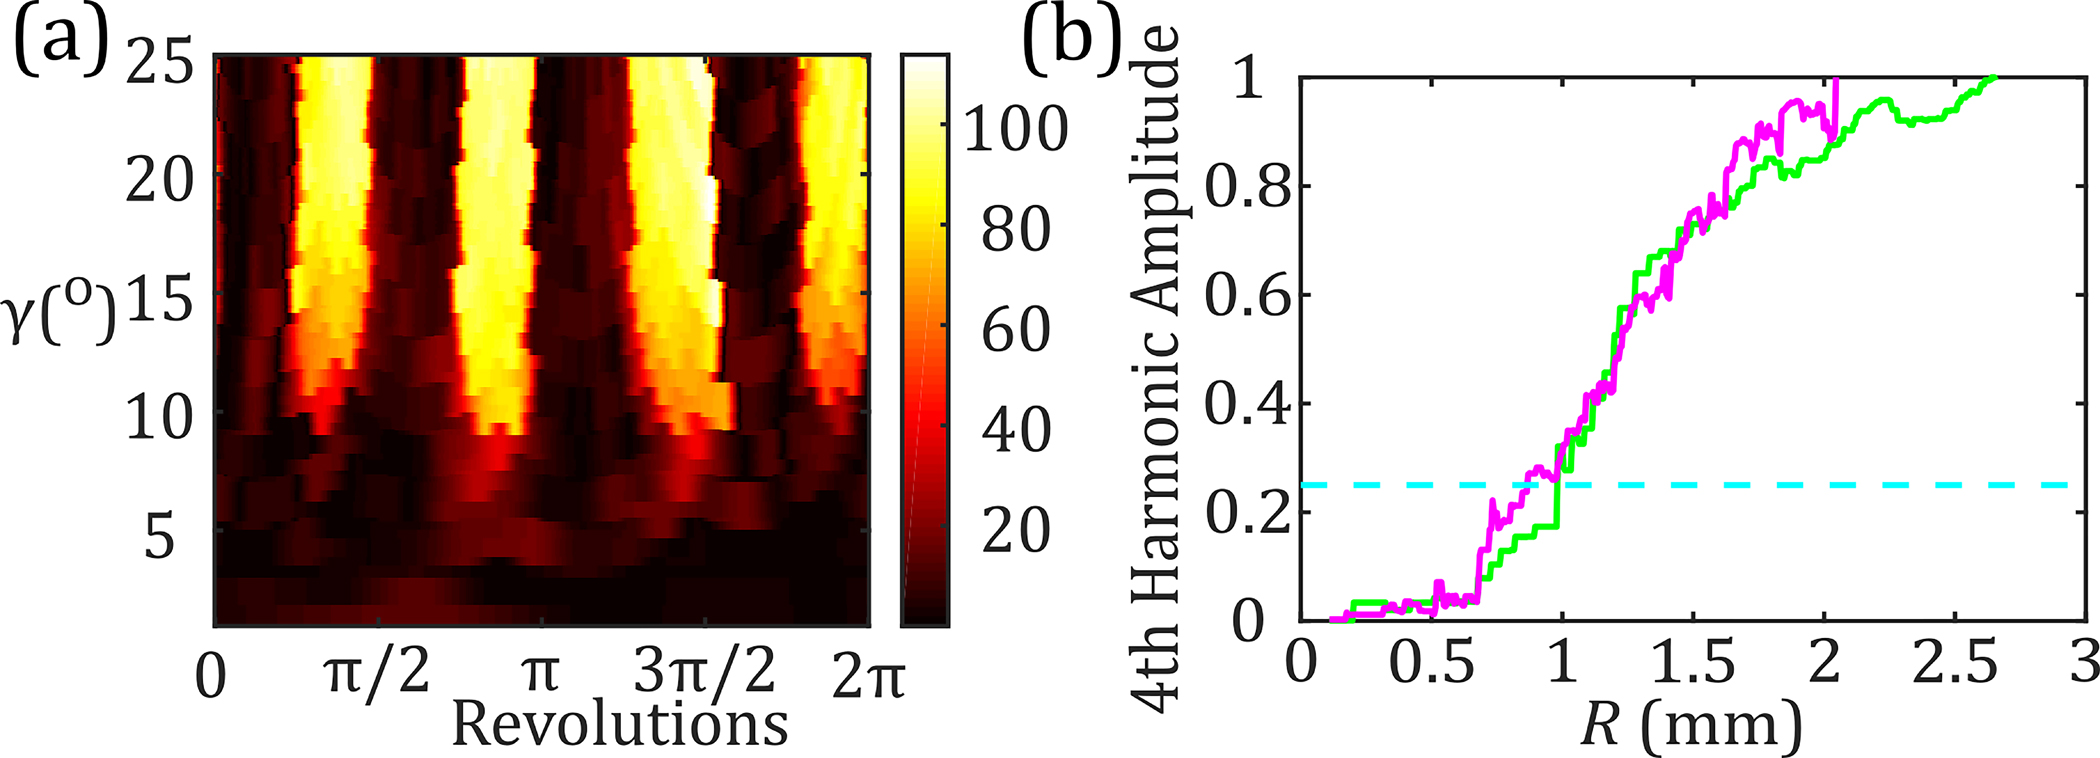
(a) Unwrapped depth along a series of concentric rings defined by , plotted as a function of revolution around the rings. (b) Normalized amplitude of the fourth harmonic as a function of resolution for the centered (green) and offset (magenta) stars.
In summary, inspired by the trail-blazing work described in [3] to apply THz imaging to hydration sensing in corneal tissue, we designed a new time-domain scanner and experimental procedure to evaluate the axial and spherical spatial resolution of such systems. We described a detailed alignment procedure using the TOA and signal amplitude to align a gimballed mirror resulting in improved surface profile mapping. Upon obtaining time-domain calibration data from stainless steel spherical targets, we determined the minimum axial resolution of the system to be approximately 15 μm. We created several 3D-printed targets with unique depth-varying features. We characterized these features with an error of about 15 μm or less using a FWHM filter for edge detection. In addition, we highlighted the asymmetric qualities of the OAPM-based scanning system. Finally, we examined the spatial resolution of the focused beam on spherical targets comparable in size to the human cornea. We showed that this resolution was approximately 1 mm for the centered target and 0.8 mm for the offset target over the asymmetrical FOV provided by the OAPM. Future studies will involve ex vivo and in vivo topographic imaging of corneal tissue, which can be modeled as an ideal sphere with respect to the free-space THz wavelengths [4]. However, translation to in vivo measurements will necessitate significant instrumentation to improve the robustness of the scanner in the presence of potential misalignments due to sample movements.
Acknowledgment.
The authors thank Dr. Brandon Kovarovic for 3D printing and Zygo Corp. for optical profilometry of samples.
Funding.
Stony Brook University; National Institute of General Medical Sciences (R01GM112693).
Footnotes
Disclosures. The authors declare no conflicts of interest.
REFERENCES
- 1.Cavas-Martínez F, De la Cruz Sánchez E, Nieto Martínez J, Fernández Cañavate FJ, and Fernández-Pacheco DG, Eye Vis. 3, 5 (2016). [DOI] [PMC free article] [PubMed] [Google Scholar]
- 2.Bennett DB, Taylor ZD, Tewari P, Singh RS, Culjat MO, Grundfest WS, Sassoon DJ, Johnson RD, Hubschman J-P, and Brown ER, J. Biomed. Opt. 16, 057003 (2011). [DOI] [PMC free article] [PubMed] [Google Scholar]
- 3.Sung S, Selvin S, Bajwa N, Chantra S, Nowroozi B, Garritano J, Goell J, Li A, Deng SX, Brown E, Grundfest WS, and Taylor ZD, IEEE Trans. Terahertz Sci. Technol. 8, 27 (2018). [DOI] [PMC free article] [PubMed] [Google Scholar]
- 4.Sung S, Dabironezare S, Llombart N, Selvin S, Bajwa N, Chantra S, Nowroozi B, Garritano J, Goell J, Li A, Deng SX, Brown E, Grundfest WS, and Taylor ZD, IEEE Trans. Terahertz Sci. Technol. 8, 1 (2018). [DOI] [PMC free article] [PubMed] [Google Scholar]
- 5.Arbab MH, Winebrenner DP, Dickey TC, Klein MB, Chen A, and Mourad PD, in Conference on Lasers and Electro-Optics (CLEO) (2012), paper CTu3B.3. [Google Scholar]
- 6.Osman OB, Tan TJ, Henry S, Warsen A, Farr N, McClintic A, Wang Y, Arbabi S, and Arbab MH, Biomed. Opt. Express 11, 6528 (2020). [DOI] [PMC free article] [PubMed] [Google Scholar]
- 7.Chen A, Osman O, Harris ZB, Abazri A, Honkanen R, and Arbab MH, Biomed. Opt. Express 11, 1284 (2020). [DOI] [PMC free article] [PubMed] [Google Scholar]
- 8.Brunner FD, Schneider A, and Günter P, Opt. Express 17, 20684 (2009). [DOI] [PubMed] [Google Scholar]
- 9.Yasuda T, Iwata T, Araki T, and Yasui T, Appl. Opt. 46, 7518 (2007). [DOI] [PubMed] [Google Scholar]
- 10.Hamza AB, Luque-Escamilla PL, Martínez-Aroza J, and Román-Roldán R, J. Math. Imaging Vis. 11, 161 (1999). [Google Scholar]
- 11.Harris ZB, Virk A, Khani ME, and Arbab MH, Opt. Express 28, 26612 (2020) [DOI] [PMC free article] [PubMed] [Google Scholar]


