

Summary
The hedonic value of salt fundamentally changes depending on the internal state. High concentrations of salt induce innate aversion under sated states, whereas such aversive stimuli transform into appetitive ones under sodium depletion. Neural mechanisms underlying this state-dependent salt valence switch are poorly understood. Using transcriptomics state-to-cell-type mapping and neural manipulations, we show that positive and negative valences of salt are controlled by anatomically distinct neural circuits in the mammalian brain. The hindbrain interoceptive circuit regulates sodium-specific appetitive drive while behavioral tolerance of aversive salts is encoded by a dedicated class of neurons in the forebrain lamina terminalis (LT) expressing prostaglandin E2 (PGE2) receptor, Ptger3. We show that these LT neurons regulate salt tolerance by selectively modulating aversive taste sensitivity partly through a PGE2-Ptger3 axis. These results reveal the bimodal regulation of appetitive and tolerance signals toward salt, which together dictate the amount of sodium consumption under different internal states.
In Brief
Sodium intake is controlled by appetitive drive signals and aversion tolerance signals through multiple brain nodes, where the prostaglandin E2-Ptger3 axis plays a key role in controlling aversive salt tolerance and preference.
Graphical Abstract
Introduction
The same sensory stimuli often drive distinct behavioral responses depending on the internal nutrient state1–5. Such state-dependent changes in nutrient value represent a fundamental basis of energy and fluid homeostasis. As the most abundant extracellular cation, sodium has critical roles in many physiological functions, including osmoregulation and neural transduction6,7. While sufficient sodium ingestion is vital for animals, overconsumption can cause acute and chronic disorders, e.g., hypertension8–10. To achieve optimal ingestion, the brain modulates sodium saliency (palatability) based on internal state and salt concentration11,12. Under sodium-sated conditions, animals show modest attraction toward low concentrations of sodium (<100 mM) and strong aversion toward higher concentrations (>300 mM). This behavioral preference drastically switches when sodium is depleted in the body. Sodium-depleted animals vigorously ingest salt at higher concentrations that are normally aversive3,13–16. Thus, sodium depletion elevates both appetitive drive and behavioral tolerance toward salt. This internal-state- and concentration-dependent valence regulation allows animals to minimize sodium overconsumption under sated states while maximizing the chance of sodium ingestion under depletion. Such flexible ingestion requires the brain to precisely control both appetitive drive and aversion tolerance toward salt.
At the peripheral level, salts activate multiple taste pathways involved in appetitive and aversive behavioral responses. Low salt is detected by specific taste cells that express the epithelial sodium channel (ENaC)17–19. These signals mediate behavioral attraction under depleted conditions. Moderate to high concentrations of salt generally trigger behavioral aversion in sated animals by recruiting additional aversive taste pathways (Figure S1A)13,20. Unlike the sodium-specific ENaC pathway, aversive salt pathways are promiscuous and activated by salts in general.
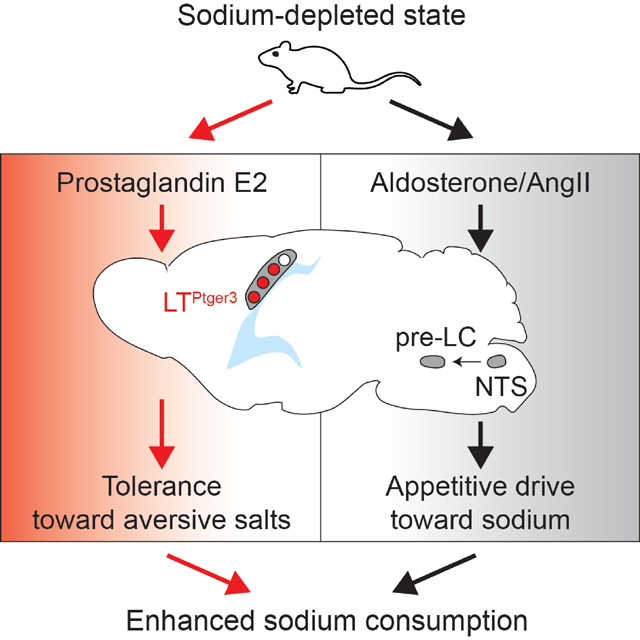
At the central level, sodium ingestion is controlled by at least two neural modules in the forebrain and hindbrain. First, specific neurons in the solitary nucleus tract (NTS) respond to internal sodium depletion through the action of aldosterone and angiotensin21–24. These signals are transmitted to their downstream brain areas, including the pre-locus coeruleus (pre-LC), to drive salt-ingestive behavior25,26. Second, sodium depletion activates neurons in the sensory organs of forebrain LT comprised of the subfornical organ (SFO) and organum vasculosum of the LT (OVLT)7,27–29. Although the genetic identity of the forebrain neurons is unknown, they were suggested to contribute to sodium preference30,31. Despite the accumulating evidence on interoceptive circuits, it is still unclear how the brain modulates positive and negative sensory valences in an internal-state-dependent manner.
Results
Toward circuit-level understanding of sodium homeostasis, we examined whether appetitive drive and behavioral tolerance toward salt are independently regulated. Under sodium-depleted conditions, animals robustly consume both low (60 mM) and high (500 mM) salt solutions (Figure 1A and Figures S1B–C). Notably, these mice tolerate low salt containing aversive minerals such as KCl, CalCl2 and MgCl2 that frequently coexist with sodium in natural resources32. In sharp contrast, sated or thirsty animals only accepted pure water and low salt with no tolerance toward aversive minerals (Figure 1A and Figures S1B–C). Similar results were obtained with a bitter compound: sodium-depleted animals consumed low salt supplemented with quinine, which was totally refused by sated or thirsty animals. These results show that sodium depletion regulates sensory valence of salt in two ways: 1) enhancing sodium-specific appetitive drive, and 2) suppressing behavioral aversion toward aversive compounds (Figures 1B–C).
Figure 1. Independent regulation of appetitive drive and tolerance toward salt.

(A) Consumption assay under sodium depleted (-Sodium, left), osmotic thirst (Thirst, middle), or sated (Sated, right) conditions. Animals were tested with pure water, KCl (500 mM), low salt (60 mM NaCl), high salt (500 mM NaCl), low salt + 440 mM KCl, low salt + 40 mM CaCl2, and low salt + 40 mM MgCl2, and low salt + 0.25 mM quinine (n = 6–21 mice).
(B) A diagram of state-dependent salt tolerance. Sodium-depleted animals accept aversive high salt or low salt with additional aversive stimuli. Conversely, sated or thirsty animals reject the same solutions.
(C) A bimodal regulation model of salt consumption under sodium depletion.
(D) Comparison of pre-LCPdyn-stimulated and sodium-depleted conditions. Left, a scheme of acute photostimulation of pre-LCPdyn neurons. Middle and right, Cumulative consumption curves of pre-LCPdyn-stimulated (blue) and sodium depleted (red) conditions during a 30-min session. Low and high salt (60 and 500 mM NaCl) was accepted by both pre-LCPdyn-stimulated and sodium-depleted animals. Only sodium-depleted animals tolerated low salt with KCl or quinine but not photostimulated animals (n = 9–15 mice).
Data are expressed as mean ± SEM, *p < 0.05, **p < 0.01, ***p < 0.001.
We investigated if these two sensory modulations are controlled by independent neural circuits. Previously, we showed that specific excitatory neurons in the hindbrain pre-LC (pre-LCPdyn) neurons receive inputs from NTS interoceptive neurons and are causally linked to sodium ingestion25,33. We investigated whether pre-LCPdyn neurons mediate both appetitive drive and aversion tolerance or only one of the two aspects. Channelrhodopsin (ChR2) was expressed in pre-LCPdyn neurons using adeno-associated virus (AAV) carrying Cre-dependent ChR2, and animals were tested with different concentrations of salt with or without aversive taste (Figure 1D). As expected, both sodium-depleted and pre-LCPdyn–stimulated animals consumed to low and high salt (Figure 1D and Figure S1D, 60 and 500 mM NaCl). However, compared to sodium depletion, pre-LCPdyn–stimulated animals preferred low salt over high salt despite stronger appetitive signals through the ENaC pathway by high salt (Figure S1E). These results suggest that pre-LCPdyn–mediated sodium intake may lack the normal salt tolerance observed under sodium depletion. Indeed, only sodium-depleted, but not pre-LCPdyn-stimulated animals tolerated aversive KCl or quinine in low salt solutions (Figure 1D and Figure S1D, 60 mM NaCl with KCl or quinine). Furthermore, in the presence of a potent ENaC blocker, amiloride, photostimulation of pre-LCPdyn neurons no longer induced sodium consumption (Figure S1F). These behavioral results demonstrate that the hindbrain circuit mainly controls sodium-specific appetitive drive, and that the attraction and aversion components toward salt are separable in the brain.
Where is aversive salt tolerance encoded in the brain? Besides the hindbrain interoceptive circuit, the forebrain LT has been suggested to regulate sodium intake31,34. Given sodium-specific appetite regulation by the hindbrain circuit, we hypothesized that forebrain LT neurons regulate aversive taste modulation and behavioral tolerance toward salt. In accordance with previous work31,34, we found sparse but robust activation of LT neurons under sodium depletion based on an immediate early gene expression (Figure 2A and Figure S2A). To identify specific cell types activated under sodium depletion, we adapted stimulus-to-cell-type mapping30,35 on the 10x Chromium platform. We compared transcriptomic data between sated and sodium-depleted conditions by collecting the SFO, enzymatically dissociating the tissue, and performing scRNA-seq experiments in the presence of a transcription blocker. Approximately 40,000 cells were collected from the SFO of sated and sodium-depleted animals, of which ~10,000 neurons were used for further analyses. The data from sodium-depleted animals were compared with those from sated animals (Figure 2B). Among all neurons, sodium depletion activated a single excitatory neuron type (Glut1) (Figure 2C). Gene expression comparison between neuron types (Figure 2D) identified that prostaglandin receptor type 3 mRNA (Ptger3) was selectively expressed in the sodium-depletion-activated Glut1 cluster (Figures 2E–F). Interestingly, Ptger3-positive neurons (SFOPtger3) comprise a small population of neuron types activated under hypovolemic thirst, a condition where both water and salt are depleted (Figures S2B–C).
Figure 2. Sodium depletion activates selective excitatory neuron types in the LT.

(A) Representative images of Fos (red) immunofluorescence signals in the forebrain SFO, and hindbrain pre-LC under sodium depletion and sated states. The SFO was counterstained by an excitatory marker nNos (blue) while the pre-LC was counterstained by Foxp2 (blue). The locations of the SFO and pre-LC are −5.52 and −0.7 mm relative to Bregma, respectively.
(B) Stimulus-to-cell-type scRNA-seq mapping of neurons activated under sodium depletion. Left, experimental diagram of scRNA-seq. Right, UMAP embedding of SFO neurons. Data from sodium-depleted and sated mice were integrated using CCA alignment (sated n = 3380 neurons, sodium depleted n = 4439 neurons).
(C) UMAP embedding for Fos log-normalized expression (red) in SFO excitatory neurons under sated (left) and sodium-depleted conditions (right).
(D) Identification of Glut1-enriched genes. Log-normalized average gene expression in Glut1 cluster was compared to other excitatory neural clusters. Glut1- and Glut2–5-enriched genes were shown outside the dotted lines (Table S2).
(E) UMAP embedding of Ptger3 log-normalized expression demonstrates faithful expression of Ptger3 in the Glut1 cluster.
(F) Violin plots of Fos (red) and Ptger3 (blue) under sated (left) and sodium-depleted (right) conditions. Ptger3 is selectively expressed in Glut1 (bottom) and Glut1 was specifically activated during sodium depletion in the SFO (top).
(G) SeqFish analysis of the SFO. Left, spatial distribution of all major cell types in representative anterior (top) and posterior (bottom) sections. After segmentation, cells were color-coded as indicated. Right, A total of 1,567 cells from five anterior sections and 1,614 cells from five posterior sections are quantified. Percentage of individual cell type is presented in the pie chart. Exc. Neurons, excitatory neurons; Inh. Neurons, inhibitory neurons; LT Astro, LT astrocytes; Astro, astrocytes; LT endo, LT endothelial cells; Endo, Endothelial cells; VSMCs, vascular smooth muscle cells; Ependy, Ependymal cells; Oligo, oligodendrocytes.
(H) Spatial distribution of all cells is plotted according to the original cell center coordinates. Excitatory neurons are highlighted in colors (red and blue). The Glut1/Ptger3 cluster (red) is separate from other excitatory neuron clusters (blue). Neurons in gray represent excitatory neurons showing gene expression of multiple cluster markers.
(I) Violin plots showing the log-normalized expression of Fos (red) and Ptger3 (blue) in SFO excitatory neurons. Fos expression was found specifically in the Glut1 cluster under sodium depletion.
Scale bar, 100 μm (A), 50 μm (G-H).
To test if the SFOPtger3 population is anatomically distinct in the SFO, we performed spatial transcriptomic analyses using seq-FISH36,37. We selected 192 genes for mRNA hybridization based on transcriptomic data and annotated them in the anterior and posterior areas of the SFO (Figure 2G). By analyzing ~1700 neurons, we validated that Ptger3-expressing neurons are anatomically distinct from other neural populations (Figure 2H and Figure S2D). Moreover, SFOPtger3 neurons were the only active population under sodium depletion (Figure 2I), in accordance with our scRNA-seq results.
To gain genetic access to Ptger3-positive neurons, we generated transgenic mice with IRES-Cre recombinase:GFP fusion protein targeted to the Ptger3 locus (abbreviated as Ptger3Cre, also see Figure S3A). Fluorescent in situ hybridization validated faithful Cre expression in endogenous Ptger3-expressing neurons (Figure 3A). To test the activation spectrum of these neurons, we exposed animals to different internal states and stimuli including various nutrient depletion, visceral malaise, pain, and inflammation (Figure 3B). Quantification of Fos immunofluorescence signals showed that SFOPtger3 neurons are narrowly tuned to sodium-need states (Figure S3B). Interestingly, the only exception was inflammatory pain, which partially activated these neurons.
Figure 3. SFOPtger3 neurons mediate salt tolerance.

(A) The genetic structure of the Ptger3Cre mouse line (top). Light and dark blue shades indicate UTRs and exons of Ptger3. Cre is inserted into the first exon, resulting in Ptger3 disruption. In situ hybridization showing co-expression of Ptger3 (green) and Cre:GFP (red) expression (bottom); 86% of Ptger3+ cells expressed Cre:GFP and 83% of Cre:GFP+ neurons expressed Ptger3 (n = 9 sections from 7 mice).
(B) Representative Fos immunofluorescence signals (red) under distinct internal states and noxious stimulus. SFOPtger3 neurons are labeled green. Activation was highly selective under sodium depletion with a minor activation level induced by inflammation. Pie charts display the percentage of Fos+/Ptger3+ cells in all Fos+ cells.
(C) Appetitive-drive test. Photostimulation of SFOPtger3 neurons did not induce salt consumption. Left, histological validation of Fos immunofluorescence signals (red) after photostimulation of ChR2-expressing SFOPtger3 neurons (green). Middle, the averaged lick numbers of water, low (60 mM), medium (250 mM) and high (500 mM) concentrations of sodium at 20 Hz stimulation. Right, the averaged lick numbers of high salt with different stimulation frequency (n = 4–11 mice).
(D) High-salt tolerance test. Left, representative raster plots of licking behavior toward high salt during a 5-sec session from a sated + photostimulated (black), thirsty (blue), or thirsty + photostimulated (red) animal. Right, quantified lick numbers without (blue) or with (red) photostimulation across different concentrations of sodium: water, 60 mM, 250 mM, 500 mM (n = 4–12 mice).
(E) Aversive-taste-tolerance test. The number of licks without (blue) or with (red) photostimulation for low salt supplemented with KCl or quinine (n = 6 mice).
(F) LTPtger3 neurons are required for normal salt tolerance. Left, a diagram of chemogenetic loss-of-function experiments. Middle, the number of licks for water or high salt during a 30-min session with vehicle (grey) or CNO (red) injection under osmotic thirst (n = 5–7 mice). Right, the same behavioral analyses under sodium depletion for low salt, low salt with KCl, or quinine (n = 7 mice).
Data are expressed as mean ± SEM, *p < 0.05, ***p < 0.001. Scale bar, 25 μm (magnified images), 50 μm (A), 100 μm (B-C).
In Ptger3Cre transgenic line, gene-targeted Cre insertion results in premature Ptger3 disruption. Thus, we used heterozygous Ptger3Cre/wt animals to test whether SFOPtger3 neurons mediate appetitive drive and/or aversion tolerance toward salt. To this end, we infected AAV-DIO-ChR2 in the SFO of Ptger3Cre/wt mice and implanted an optic fiber over the SFO (Figure S3C). Although photostimulation strongly activated SFOPtger3 neurons, it did not induce ingestive behavior toward fluids with any stimulation parameters tested (Figure 3C). We next examined whether these neurons mediate behavioral tolerance. While thirsty mice showed dose-dependent aversion toward salt, SFOPtger3-stimulated animals exhibited greatly increased consumption of aversive high salt (Figure 3D, Figures S3D–E, and Videos S1–2). Importantly, photostimulation did not affect water or low-salt consumption, excluding the possibility that SFOPtger3 neurons mediate general appetite modulation. The same photostimulation paradigm also enhanced behavioral tolerance toward aversive compounds presented with low salt (Figure 3E). Unlike pre-LCPdyn neurons, amiloride had no effect on SFOPtger3-mediated salt tolerance (Figure S3F). We note that the levels of SFOPtger3-induced tolerance were comparable to those under sodium depletion (Figure S3G).
We also investigated if LTPtger3 neurons are functionally required for salt tolerance. Because a subset of OVLT neurons also expressed Ptger3 (Figure S3H), and were activated under sodium depletion, we expressed an inhibitory DREADD in Ptger3 neurons of these areas by transducing AAV-DIO-hM4Di. Inhibition of SFO/OVLTPtger3 neurons by a synthetic DREADD ligand, CNO, drastically suppressed tolerance toward aversive salt under sodium-depleted or hypovolemic state (Figure 3F and Figure S3I). LTPtger3-inhibited mice no longer tolerated low salt with quinine or KCl, whereas the same inhibition had no effect on solute intake under osmotic thirst conditions where Ptger3 neurons are not activated (Figure 3F). The blunted tolerance was also observed when only SFOPtger3 neurons were inhibited (Figure S3J). Taken together, our neural perturbation experiments revealed an essential role of SFOPtger3 neurons in regulating aversion tolerance, but not in appetitive drive toward salt.
Given the distinct functions of forebrain and hindbrain circuits for salt ingestion, we asked whether sodium depletion activates pre-LCPdyn and SFOPtger3 neurons independently or in series (Figure 4A). To test this, we genetically probed pre-LCPdyn → SFOPtger3 and SFOPtger3 → pre-LCPdyn projections by expressing ChR2-EYFP/ChR2-mCherry in either neural population. While both populations send axonal projections to downstream areas, practically no anatomical interaction was observed between pre-LCPdyn and SFOPtger3 neurons (Figures 4B–C, top). Optogenetic stimulation of each excitatory population did not activate neurons in the other nucleus, showing functional independence between these two neural populations (Figures 4B–C, bottom). Moreover, ablation of either pre-LCPdyn or LTPtger3 by Cre-dependent expression of caspase did not affect Fos immunofluorescence signals in the remaining nucleus under sodium depletion (Figures 4D–E). Thus, forebrain and hindbrain circuits are independently activated under depleted states.
Figure 4. Parallel and independent activation of fore- and hindbrain circuits under sodium depletion.

(A) Two distinct circuit models between fore- and hindbrain neurons related to sodium ingestion. Left, a parallel model where sodium depletion independently activates SFOPtger3 and pre-LCPdyn neurons. Right, a serial-activation model depicting the hierarchical relationship between the two neural circuits.
(B) Testing pre-LCPdyn → SFOPtger3 projections. AAV-DIO-ChR2-EYFP was transduced in pre-LCPdyn neurons. Top, representative images showing axonal projections to the ventral bed nucleus of stria terminalis (vBNST) and SFO. Note that the vBNST is a known downstream area of pre-LCPdyn neurons. Bottom, similarly, photostimulation-induced Fos immunofluorescence signals were observed in the BNST but not SFO. Right, the number of Fos+ cells was compared between SFO (red) and pre-LC (grey, n = 4 sections from 4 mice).
(C) Testing SFOPtger3 → pre-LCPdyn projections. Top, SFOPtger3 neurons showed no projection to the pre-LC when compared to the MnPO, a known downstream target of the SFO. Bottom, no activation was found in pre-LCPdyn neurons after photostimulating SFOPtger3 neurons. Right, the number of Fos+ cells by photostimulation (n = 4–6 sections from 3 mice).
(D) Activation of SFOPtger3 neurons under sodium depletion did not rely on functioning pre-LCPdyn neurons. AAV-FLEX-taCasp3-TEVP was injected into the pre-LC bilaterally in PdynCre or wild-type mice. Middle, representative images of sodium-depletion-induced Fos in the SFO and pre-LC. Right, the numbers of Fos+ cells in the SFO and pre-LC were quantified in transgenic (Cre, red, n = 4–6 sections from 3 mice) and wild-type mice (WT, grey, n = 5–8 sections from 4 mice).
(E) Pre-LC activation with ablated LTPtger3 neurons. AAV-FLEX-taCasp3-TEVP was injected to the SFO and OVLT in Ptger3Cre/wt or wild-type mice. Middle, representative images of sodium-depletion-induced Fos. Right, quantified Fos+ cells in the SFO and pre-LC. Ablation of LTPtger3 neurons had no effect on the pre-LC activity (red, n = 4 sections from 2 mice; grey, n = 4 sections from 3 mice for SFO, and red, 4 sections from 2 mice and 5 sections from 3 mice for pre-LC).
Data are shown as mean ± SEM, *p < 0.05, **p < 0.01, ***p < 0.001. Scale bar, 100 μm.
See also Table S1.
In the mammalian taste system, high salt activates aversive taste pathways, including bitter and sour13,20. Genetic silencing of aversive taste signals (e.g., Trpm5−/− 38,39) greatly reduced behavioral avoidance toward salt (Figure S4A). We suspected that the activity of Ptger3 neurons might control the sensitivity or saliency of aversive taste signals. If this was true, we anticipated that the stimulation of SFOPtger3 neurons should reduce behavioral aversion toward bitter or sour taste stimuli. Indeed, while animals exhibited dose-dependent aversion toward bitter and sour tastes, acute stimulation of SFOPtger3 neurons drastically blunted aversive responses to quinine and to a lesser degree, citric acid (Figures 5A–B). Because acids activate multiple oral sensory pathways40–42, these multimodal signals may have masked the tolerance effects by SFOPtger3 neurons. By contrast, such aversive taste tolerance was not induced by photostimulation of pre-LCPdyn neurons (Figure S4B). The behavioral responses to an attractive taste such as sweet was unaffected by the same neural manipulation (Figure 5C). Moreover, SFOPtger3-mediated behavioral tolerance was not generalized to conditioned taste aversion or capsaicin, a non-taste oral noxious stimulus43 (Figure S4C and Figure 5D). Taken together, our data demonstrate that behavioral effects through SFOPtger3 neurons are selective toward aversive taste stimuli (Figure 5E). Consistent with this model, the same neural manipulation had no effect on behavioral tolerance toward other aversive stimuli including heat, acute, and inflammatory pain (Figures S4D–G).
Figure 5. Selective modulation of aversive taste saliency by SFOPtger3 neurons.

(A) Dose-dependent behavioral aversion toward bitter tastes. Left, the number of licks was quantified for water, 0.125, and 0.25 mM quinine under osmotic thirst conditions in the absence (black) or presence (red) of photostimulation to SFOPtger3 neurons. Right, preference changes are shown as a ratio by calculating the lick numbers with photostimulation divided by those without photostimulation (n = 5–8 mice). Lick number of water was reanalyzed from Figure 3D.
(B) Similar analyses as (A) using sour taste. Water, 10, and 20 mM citric acid were used to quantify taste preference (n = 8–11 mice). Lick number of water was reanalyzed from Figure 3D.
(C) Acute stimulation of SFOPtger3 neurons did not change preference toward attractive tastant under food deprivation. Average lick numbers for water, 0.5, 1, and 2 mM AceK are shown without (black) or with (red) photostimulation (n= 4–7 mice).
(D) Dose-dependent behavioral aversion toward capsaicin, a non-taste oral aversive compound. 0, 0.3, and 1 μM capsaicin were used to calculate avoidance curve (n = 4–5 mice).
(E) Saliency modulation by SFOPtger3 neurons was specific toward aversive stimuli through the taste system. The effect was not generalized to non-oral aversive stimuli.
(F) Stimulation of Ptger3 neurons alleviate aversive taste response under hunger. Shown are raster plots from representative food-deprived mice to sweet (2 mM AceK), sweet with bitter (2 mM AceK with 0.125 mM quinine), and the same mixture with photostimulation. With the photostimulation of SFOPtger3 neurons, the bitter taste was tolerated.
(G) The effect of photostimulation of SFOPtger3 neurons on glucose (500 mM), AceK (2 mM) and monopotassium glutamate + inosine monophosphate (30 mM + 0.6 mM) supplemented with bitter. The average lick numbers toward pure attractive tastants (blue), mixture with 0.125 mM quinine (grey), and together with photostimulation (red) are shown (n = 7–10 mice).
Data are shown as mean ± SEM, *p < 0.05, **p < 0.01, ***p < 0.001.
We reasoned that if SFOPtger3 neurons encode aversive taste tolerance, artificial stimulation of this neural population should increase general taste palatability. To test this idea, food-deprived animals were given access to sugars (glucose and acesulfame K44) with or without an additional bitter component (Figure 5F). Because sugar and bitter taste mixture is less palatable than the pure sugar solution, mice show reduced preference toward the mix (Figure 5F and Figure 5G, left). However, stimulation of SFOPtger3 neurons suppressed the aversiveness of the mixture, and animals showed increased preference toward the mixture comparable to the pure sugar solution. Similar results were obtained for umami taste (Figure 5G, right).
Ptger3 is a receptor for prostaglandins (mainly PGE2), and is involved in various physiological responses45–48. Since Ptger3 is a dominant PGE2 receptor subtype expressed in the SFO (Figure S5A), we speculated that PGE2-Ptger3 signaling may be involved in salt taste modulation and ingestion. To test this hypothesis, we examined the role of Ptger3 using a global receptor knockout animal model, Ptger3−/− (or Ptger3Cre/Cre Figures 6A–C) and local Ptger3 knockdown in the SFO (Ptger3 KD, Figures 6D–F). Ptger3−/− mice were obtained as homozygous Ptger3Cre/Cre animals due to premature gene disruption. Deletion of Ptger3 expression was confirmed by in situ hybridization in both cases (Figures 6A and 6D). Compared to control animals, Ptger3Cre/Cre and Ptger3 KD significantly reduced Fos immunofluorescence signals under sodium depletion (Figures 6B and 6E, SFO), whereas neural activation in the pre-LC was unchanged (Figures 6B and 6E, pre-LC). To test the behavioral consequences, we examined salt preference in Ptger3Cre/Cre and Ptger3 KD mice. Consistent with histological results, animals lacking Ptger3 no longer tolerated aversive stimuli including high salt, KCl, and quinine (Figure 6C, Figure 6F and Figure S5B). While Ptger3 is required for salt tolerance, Ptger3 KD in the background of Trpm5−/− did not abolish salt tolerance (Figure S5C), indicating that behavioral tolerance through Ptger3 requires intact taste signals. Collectively, these data demonstrate that the function of Ptger3 is required for activation of SFOPtger3 neurons and normal salt tolerance under sodium-depleted conditions.
Figure 6. Ptger3 in the SFO is required for salt tolerance.

(A) Fluorescence in situ hybridization validates the lack of Ptger3 transcripts in the SFO in homozygous Ptger3Cre/Cre (Ptger3−/−) animals compared to heterozygous Ptger3Cre/wt (Ptger3+/−) animals. 89% of Ptger3 signals were abolished in Ptger3Cre/Cre mice (n = 4 sections from 3 mice) compared to Ptger3Cre/wt mice (n = 5 sections from 3 mice).
(B) Left, Representative images of the SFO and pre-LC under sodium depletion in Ptger3Cre/wt (grey) and Ptger3Cre/Cre (red) animals. Sodium depletion activated the SFO in a Ptger3-dependent manner but Fos immunofluorescence signals in pre-LC were unaffected. Right, quantification of the cell activation (grey, n = 4 sections from 4 mice; red, n = 5 sections from 5 mice for SFO, and grey, n = 7 sections from 4 mice; red, n = 6 sections from 3 mice for pre-LC).
(C) Aversion tolerance is abolished in Ptger3Cre/Cre mice. Left, the number of licks toward water, low salt (60 mM NaCl), high salt (500 mM NaCl), and low salt with KCl or quinine in Ptger3Cre/wt (grey) and Ptger3Cre/Cre (red) mice under sodium depletion (n = 4–10 mice). (D) Fluorescence in situ hybridization validates the lack of Ptger3 transcripts in the Ptger3-shRNA-injected animals. Compared to scramble-shRNA-injected animals, 87% of Ptger3 signals were abolished in Ptger3-shRNA-injected mice (n = 4 sections from 2 mice) compared to scramble-shRNA-injected mice (n = 4 sections from 2 mice).
(E) Left, representative images of the SFO and pre-LC under sodium depletion in scramble- (grey) and Ptger3- (red) shRNA-injected mice. Right, quantification of the cell activation (grey, n = 5 sections from 5 mice; red, n = 5 sections from 5 mice).
(F) Aversion tolerance is abolished in Ptger3 KD mice. Left, a diagram of gene knockdown and behavioral paradigm. Right, consumption of the same solutions as Figure 6C was tested in scramble- (grey) and Ptger3- (red) shRNA-injected mice (n = 5–13 mice). Data are expressed as mean ± SEM, *p < 0.05, **p < 0.01, ***p < 0.001. Scale bar, 25 μm (A right, and D), 100 μm (A left, B, and E).
We next asked whether PGE2 plays a role in salt taste modulation and tolerance. Considering that SFOPtger3 neurons are activated under sodium depletion and inflammation (Figure 3B), we tested if sodium depletion elevates PGE2 levels. Our ELISA measurement confirmed that circulating PGE2 is significantly increased under sodium depletion, but we did not observe such elevation for other inflammation-related molecules such as progesterone or serotonin (Figure 7A and Figure S6A). We synthesized PGE2 conjugated with a small fluorescent dye (PGE2-AMCA) to test whether peripheral PGE2 have access to the SFO. Our acute SFO preparation confirmed that fluorescent levels of PGE2-AMCA increased selectively in the SFO within 5 min of peripheral injection (Figure 7B). This rapid PGE2 penetration is presumably due to the lack of the normal blood brain barrier in the SFO. Moreover, photometry recording from SFOPtger3 neurons that express GCaMP7s (AAV-Flex-GCaMP7s) demonstrated time-locked calcium increases by peripheral PGE2 injections (Figure 7C). These calcium responses were not observed under osmotic thirst, hunger, or visceral malaise (Figure S6B). Consistently, we found strong Fos immunofluorescence signals in the SFO by peripheral PGE2 injection in a Ptger3-dependent fashion (Figures S6C–D).
Figure 7. Functional roles of PGE2-Ptger3 signaling for salt taste modulation.

(A) ELISA measurement of the circulating PGE2 level. PGE2 was measured from sated (grey), and sodium depleted/repleted (red), and formalin-injected (blue) animals (n = 6–9 mice).
(B) Rapid PGE2 access to the SFO. Ex vivo imaging of the SFO was performed after intravenous injection of PGE2-AMCA. Top, experimental diagram and the chemical structure of a synthesized PGE2-AMCA. Bottle left, representative images showing fluorescence of PGE2-AMCA in acutely dissected SFO. Fluorescence levels were quantified across indicated white lines. Bottom middle, representative traces of relative fluorescence levels in vehicle- or PGE2-AMCA-injected animals. Bottom right, quantification of the relative fluorescence level (n = 7 mice for PBS, and 9 mice for PEG2-AMCA).
(C) Photometry recording from SFOPtger3 neurons. Shown are calcium dynamics and quantified responses (normalized ΔF/F) from SFOPtger3 neurons after subcutaneous injection of vehicle (grey) and PGE2 (red, n = 6 recordings from 5 mice for PGE2, and 7 recordings from 5 mice for vehicle).
(D) Peripheral injection of PGE2 induces salt tolerance in a Ptger3-dependent manner. High-salt consumption after subcutaneous vehicle (grey) or PGE2 (red) injection in Ptger3Cre/wt and Ptger3Cre/Cre animals was analyzed (n = 4–5 mice). PGE2 did not induce a drive to consume salt under sated conditions. Under thirst condition, Ptger3Cre/wt, but not Ptger3Cre/Cre, animals showed enhanced salt tolerance with PGE2 injection.
(E) Ptger3 KD mice did not tolerate high salt upon PGE2 administration. Scramble- (grey) and Ptger3- (red) shRNA- injected mice were tested in high salt consumption assay (n = 5–10 mice).
(F) Anti-inflammatory drugs (NSAIDs) partially decreased salt tolerance in sodium depletion. Sodium-depleted mice supplemented with ibuprofen (drinking water) and aspirin (i.p. injection) showed decreased tolerance toward high salt (n = 4–5 mice).
(G) Enhanced dopamine signals toward high salt with PGE2 injection. Left, dopamine release in the NAc was monitored with dLight1.3b during high-salt consumption was measured. Middle and right, averaged dLight1.3b dynamics and quantified data are shown under sodium depletion, thirst, and thirst with PGE2 subcutaneous injection. Lick frequency is shown under dLight traces (n = 8–9 mice).
(H) Activation of SFOPtger3 neurons induced dopamine release during high-salt consumption. Left, an experimental diagram for virus injection and salt consumption assay. Middle and right, averaged dLight1.3b dynamics and quantified data are shown after i.p. vehicle (grey) or CNO (red) injection (n = 8 mice).
Data are expressed as mean ± SEM, *p < 0.05, **p < 0.01, ***p < 0.001. Scale bar, 100 μm.
To directly test tolerance regulation, we examined the effects of PGE2 injection on taste preference. Indeed, like SFOPtger3 neuron stimulation, PGE2-injected wild-type or Ptger3Cre/wt animals exhibited increased salt tolerance under osmotic thirst (Figure 7D and Figures S6E) and food-deprived conditions (Figure S6F), but PGE2 itself did not induce any appetite under sated conditions. Importantly, PGE2-mediated tolerance was largely abolished in Ptger3Cre/Cre animals and Ptger3 KD animals, showing that PGE2-induced high-salt tolerance is mediated through Ptger3 (Figures 7D–E and Figures S6G–H). Furthermore, we tested whether prostaglandin production is required for the induced salt tolerance using anti-inflammatory drugs (NSAIDs: ibuprofen and aspirin), a commonly used method to reduce prostaglandin production49–51. We found that NSAID treatments significantly reduced salt tolerance under sodium depletion (Figure 7F). Conversely, formalin-induced inflammation increased the PGE2 levels (Figure 7A) and partially induced high salt tolerance (Figure S6I). While these studies highlighted the contribution of the PGE2-Ptger3 axis to salt taste modulation, Ptger3 is also activated by other prostaglandin-related molecules52. It is feasible that these molecules may play additional roles in sensory modulation under physiological conditions.
Ingestive behavior is intimately linked to the activity of reward circuits53–56. We tested whether sodium depletion and SFOPtger3 neuron activity alter the activity of dopamine release in the nucleus accumbens (NAc) using genetically encoded biosensor, dLight57,58. We injected AAV-syn-dLight1.3b and an optic fiber into the Nac for real-time optical imaging of dopamine release. We found that dLight signals rapidly increased when sodium-depleted animals consumed high salt while the same animals under osmotic thirst exhibited minimal activation (Figure 7G). After subcutaneous PGE2 injection, thirsty mice showed increased high-salt consumption and enhanced dopamine release (Figure 7G). To test if this effect is recapitulated by the stimulation of SFOPtger3 neurons, we expressed an activation DREADD, hM3Dq, into SFOPtger3 neurons. We then tested dLight signals from the Nac while activating SFOPtger3 neurons by CNO. Compared to vehicle-injected control animals, dopamine signals in the Nac were greatly enhanced during high-salt ingestion only when SFOPtger3 neurons are chemogenetically activated (Figure 7H). These results further extend our results by showing that the perceived quality of high salt is altered in the presence of salt tolerance signals from the SFO.
Discussion
We demonstrated that two critical aspects of salt ingestion, sodium-specific appetitive drive and general salt tolerance are modulated by separate neural populations in an internal-state-specific manner. Our neural perturbation experiments showed that appetitive drive is regulated by the hindbrain neural pathway, while aversion tolerance is regulated by forebrain SFOPtger3 neurons (Figure S7A). Such a bimodal neural architecture reveals a flexible regulatory mechanism of sodium ingestion by modulating the saliency of sodium taste depending on internal need.
Although sodium depletion suppresses the apparent sensitivity of aversive tastes, such sensory modulation may occur at the peripheral or/and central levels59–62. Our results favor the central modulation model, as peripheral taste signals were minimally unaffected by sodium deletion or SFOPtger3 neuron activity. We stimulated the tongue with different concentrations of NaCl while recording peripheral taste nerves using in vivo electrophysiology63,64 and observed that the response threshold and amplitude to NaCl were largely unchanged under sated, thirsty, sodium-depleted, or SFOPtger3-stimulated conditions (Figures S7B–D). Although the precise pathways of taste modulation remain to be investigated, these results suggest that regulation of behavioral sensitivity to aversive taste stimuli is likely mediated at the central levels.
While the LT is involved in water and sodium balance16,19,31, how individual LT cell-types are involved in these regulations has been elusive30. Here we show that a genetically defined neuron class that expresses Ptger3 mediates a specific aspect (tolerance) of fluid ingestion. These findings provide key insights into central coding logic of internal water-sodium balance. Under sodium depletion or hypovolemia, SFOPtger3 neurons are activated to promote salt ingestion21,23,25. Conversely, osmotic thirst activates non-SFOPtger3 LT neurons to drive pure water intake25,65. Thus, each class of LT neurons are activated in an internal-state-dependent manner, yet encodes a specific physiological function (e.g., SFOPtger3 for mineral tolerance). It is currently unclear how SFOPtger3 and other LT neurons exert salt tolerance and fluid ingestion through downstream brain areas (Figure S7E). Future brain-wide downstream analyses will reveal how multiple neuron types regulate water and sodium balance under fluid imbalance.
Brain interoceptive circuits monitor internal states through various molecules. Angiotensin and aldosterone are well-characterized molecules that regulate water and sodium ingestion. This study identified PGE2 as an additional candidate molecular mediator underlying salt tolerance. However, the origin and pathway of PGE2 production awaits further studies. Moreover, since Ptger3 is activated by various ligands besides PGE266, other molecules may also be involved in salt taste modulation. Brain-derived PGE2 is known to regulate core body temperature67,68, while peripheral-derived PGE2 modulates sensory sensitivity, including nociception69–71. Since sodium depletion has no obvious thermoregulatory effects72, we speculate that the source of PGE2 is from peripheral organs such as the kidney73–75, which leads to activation of SFOPtger3 neurons through Ptger3. Future research will be required to clarify if PGE2 is the only molecule that regulates salt tolerance, and whether other brain areas contribute to this sensory modulation process.
Previous studies have observed elevated tolerance toward aversive stimuli under hunger states5,76,77. However, the underlying mechanisms appear distinct from salt tolerance. Stimulation of hunger neurons in the arcuate nucleus drives feeding and suppresses various noxious stimuli in parallel through their downstream projections5,77. By contrast, sodium appetite and tolerance are encoded by distinct neural circuits. Why do different interoceptive circuits employ distinct appetitive/tolerance mechanisms? It is well established that the valence of sodium switches in a concentration- and internal-state-dependent fashion. Thus, it is conceivable that the hindbrain pre-LCPdyn neurons mediate internal-state-specific regulation while forebrain SFOPtger3 neurons encode concentration-dependent regulation toward sodium salts. Such neural architecture would allow interoceptive and exteroceptive signal integration to optimize sodium consumption.
Unlike non-caloric artificial sweeteners such as sugar substitutes, sodium is the only safe cation that exhibits salty taste78. Even though salt overconsumption is a significant health risk factor, modulation of salt consumption has been challenging due to the lack of sodium substitutes. Our findings shed light on a potential strategy to modulate salt taste by saliency control. We showed that activation and inhibition of SFOPtger3 neurons bidirectionally regulated sodium tolerance and consumption (Figures 3D–F). The SFO lacks the normal blood-brain barrier, making it accessible to compounds in systemic blood circulation such as PGE2. Thus, identifying compounds that activate or inhibit LTPtger3 neurons may provide a salt-taste-modifying strategy to control sodium consumption.
Limitations of the study
The effects of PGE2 on salt ingestion were analyzed using homozygous Ptger3Cre/Cre mice, where Cre:GFP-polyA was inserted right before the initiation codon of Ptger3. Although this transgene insertion should prevent Ptger3 expression, there may be low levels of residual expression of the downstream reading frame. Ptger3 binds various ligands other than PGE2, and we cannot exclude the contribution of other molecules to salt taste modulation in vivo. Further studies are needed to test if other Ptger3 ligands are involved in salt ingestion. PGE2 is produced both in the brain and body. While our study used formalin injection as an inflammation model, our data do not directly show that PGE2 released during sodium depletion endogenously stimulates Ptger3 to suppress aversion. Thus, a more thorough investigation will be required to test the function of PGE2 from different sources during sodium depletion. GCaMP7s fluorescence is a proxy for neuronal firing, and in vivo voltage recordings during salt depletion or inflammation will be important to reveal the activation patterns of SFOPtger3 neurons. Our study employed a standard sodium depletion model by injecting a diuretic compound and testing behavior or histology at a fixed time (24 hr). In future studies, it will be important to test whether the development of sodium-specific appetite and general salt tolerance may have different time scales in the brain.
STAR Methods
Resource availability
Lead contact
Further information and requests for resources and reagents should be directed to and will be fulfilled upon reasonable request by the lead contact, Dr. Yuki Oka (yoka@caltech.edu).
Materials availability
We generated Ptger3Cre mouse line which is deposited to Jackson lab (035575). We generated AAV9-GFP-U6-m-Ptger3-shRNA (shAAV-269740) which is now available on Vector Biosystems (7000). We generated PGE2-AMCA which is now available on AAT Bioquest (Q2303063).
Data and code availability
The scRNA-seq data were deposited at Gene Expression Omnibus repository and and are publicly available as of the date of publication. The seqFish data were deposited at Zenodo. DOIs are listed in the key resources table.
Data reported in this paper will be shared by the lead contact upon request.
Any additional information required to reanalyze data reported in this paper is available from the lead contact upon request.
Key resources table.
| REAGENT or RESOURCE | SOURCE | IDENTIFIER |
|---|---|---|
| Antibodies | ||
| Rabbit anti-FOS | Cell Signaling | No. 2250 |
| Sheep anti-Foxp2 | R&D Systems | AF5647 |
| Chicken anti-GFP | Abcam | ab13970 |
| Rat anti-mCherry | Invitrogen | 16D7 |
| Goat anti-nNos | R&D Systems | AF2416 |
| Bacterial and virus strains | ||
| AAV5-EF1a-DIO-ChR2-EYFP | Penn Vector Core | N/A |
| AAV2-EF1a-DIO-ChR2-mCherry | UNC Vector Core | N/A |
| AAV2-EF1a-DIO-mCherry | UNC Vector Core | N/A |
| AAV8-hSyn-DIO-hM4D(Gi)-mCherry | Addgene | Addgene number:44362 |
| AAV2-hSyn-DIO-hM3D(Gq)-mCherry | Addgene | Addgenenumber: 44361 |
| AAV2-Flex-taCaso3-Tevp | UNC Vector Core | N/A |
| AAV5-Flex-taCasp3-Tevp | UNC Vector Core | N/A |
| AAV9-syn-dLight1.3b | Addgene | Addgene number: 135762 |
| AAV1-syn-FLEX-jGCaMP7s-WPRE | Addgene | Addgene number: 104491 |
| AAV9-GFP-U6-scrmb-shRNA | Vector Biosystems Inc | No. 7777 |
| AAV9-GFP-U6-m-Ptger3-shRNA | Vector Biosystems Inc | No. 7000 |
| Chemicals, peptides, and recombinant proteins | ||
| PGE2 | Sigma | D2250000/P0409-1MG |
| Furosemide | Sigma | F4381 |
| Low-sodium diet | ENVIGO, TD | No.90228 |
| CNO | Sigma | C0832 |
| Formalin | Sigma | HT. 5012 |
| Mannitol | Sigma | M9647 |
| PGE2-AMCA | AAT Bioquest | Q2303063 |
| Papain | Sigma | P3125 |
| Actinomycin D | Sigma | A1410 |
| DNase I | Thermo Scientific | 90083 |
| Ovomucoid inhibitor | Worthington | OI-BSA |
| Ghrelin | Phoenix pharmaceuticals | 031-31 |
| Deposited data | ||
| scRNA-seq | Gene Expression Omnibus | GSE 244245 |
| SeqFish | Zenodo | Zenodo 8381359 |
| Experimental models: Organisms/strains | ||
| C57BL/6J | Jackson Laboratory | No. 0664 |
| PdynCre | Jackson Laboratory | No.027958 |
| Trpm5−/− | Jackson Laboratory | No.013068 |
| Ptger3Cre | Jackson Laboratory | No.035575 |
| Software and algorithms | ||
| MATLAB R2022a | MathWorks | N/A |
| Prism 9.3.1 | GraphPad | N/A |
| LASX | Leica | N/A |
| Photoshop CS5/CC | Adobe | N/A |
| Illustrator CS5/CC | Adobe | N/A |
| Zen Black 2.3 | ||
| VS-ASW-S6 2.8 | Olympus | N/A |
| Python 3.9.12 | Python Software Foundation | N/A |
| R 4.1.2 and 4.1.1 | R Core Team | N/A |
Experimental Model and Study Participant Details
Animals
All procedures followed the US NIH guidance for the care and use of laboratory animals and were approved by the California Institute of Technology Institutional Animal Care and Use Committee (protocol: 1694–14). Male and Female mice at least 8 weeks were used for behavioral tests and histology characterization. No sex difference is observed in this study. For scRNA-seq experiments, 7–8-week-old C57BL/6J mice were used. C57BL/6J were purchased (000664) from the Jackson Laboratory. PdynCre mice were a gift from B. Lowell and M. Krashes (Jackson lab, 027958). Heterozygous PdynCre mice were used for all experiments. Trpm5−/− mice were generously provided by C. Zuker (Jackson lab, 013068). Mice were housed in temperature-controlled and humidity-controlled rooms with a 13:11 hr light:dark cycle. Mice are provided with ad libitum access to chow and water unless mentioned in the nutrient deprivation experiments.
Generation of the Ptger3Cre mouse line
Ptger3Cre animals were generated by inserting mnCre:GFP cassette just 5’ of the initiation codon of Ptger3 gene and deleting the first 40 amino acids. The cassette had a Myc-tag and nuclear localization signals at the N-terminus. The targeting construct was electroporated into G4 ES cells (C57Bl/6 × 129 Sv hybrid) and correct targeting was identified by Southern blot. The frt-flanked SV-Neo gene was removed via breeding with Gt(Rosa)26Sor-FLP recombinase mice and then backcrossing to C57BL/6J mice for >6 generations. Homozygous Ptger3Cre/Cre mice are equivalent to Ptger3−/− because of the amino acid deletion.
Viral constructs
We used the following viruses: AAV5-EF1a-DIO-ChR2-EYFP, 3.0 × 10¹³ viral genomes per ml. AAV2-EF1a-DIO-ChR2-mCherry, 5.1 × 10¹² viral genome copies per ml. AAV2-EF1a-DIO-mCherry, 4.6 × 10¹² genome copies per ml. AAV8-hSyn-DIO-hM4D(Gi)-mCherry, 1.9 × 10¹³ viral genomes per ml. AAV2-hSyn-DIO-hM3D(Gq)-mCherry, 6.5 × 10¹² viral genomes per ml. AAV2-Flex-taCaso3-Tevp, 1.8 ×10¹² viral genome copies per ml. AAV5-Flex-taCasp3-Tevp, 4.2 × 10¹² viral genome copies per ml. AAV9-syn-dLight1.3b, 2.6 × 10¹³ viral genomes per ml. AAV1-syn-FLEX-jGCaMP7s-WPRE, 1.9 × 10¹³ viral genomes per ml. AAV9-GFP-U6-scrmb-shRNA, 3 × 10¹³ viral genomes per ml. AAV9-GFP-U6-m-Ptger3-shRNA (shAAV-269740), 1.5 × 10¹³ viral genomes per ml.
Method details
Surgery
Surgery procedures were performed as described25. Briefly, ketamine (1 mg/ml) and xylazine (10 mg/ml) in saline were injected intraperitoneally at a dose of 10 ml per kg body weight (BW) for anaesthesia. Ketoprofen was injected subcutaneously at a dose of 5 ml per kg BW. Surgery was performed with a stereotaxic apparatus (Narishige, SR-5M-HT) on a heating pad at 37 °C. Virus was delivered with a microprocessor-controlled injection system (World Precision Instruments, Nanolitre 2000) at 100 nl/min. The following coordinates were used: for pre-LC: anterior–posterior (AP), 9,000, medial–lateral (ML), 1,000, ventral–dorsal (VD), 3,800; for SFO: AP, 4,000, ML, 0, VD, 2,500; for OVLT: AP, 2,475, ML, 0, VD, 4,750; for dorsal part of the NAc medial shell: AP, 2,100, ML, 700, VD, 4,000. For optogenetic experiments, virus was delivered unilaterally at a volume of 120–200 nl. Implants were made by gluing a 200-μm fibre bundle (Thorlabs, FT200EMT) to a ceramic ferrule (Thorlabs, CF230–10) with epoxy. The fibre implant was placed 200 μm above the virus injection site. For fiber photometry experiments, virus was delivered at a volume of 150–200 nl (calcium measurement) or 500 nl (dopamine measurement) per region. A 400-μm fiber bundle (Thorlabs, FT400UMT) was used instead. For chemogenetic inhibition experiments, virus was delivered at 180–200 nl per region. For ablation experiments, virus was delivered at 200–250 nl per region. For local knockdown experiments, virus was delivered at 150–200 nl per region. At the end of experiments, all animals were euthanized for histological examination.
Internal state induction
Sodium depletion:
Mice were injected intraperitoneally with furosemide at a dose of 50 mg per kg BW and maintained with a low-sodium diet for 24 hr before behavioral assays or immunohistological staining79.
Sodium repletion:
Mice were injected intraperitoneally with furosemide at a dose of 50 mg per kg BW 24 hr before the experiment and maintained on a normal diet.
Osmotic thirst:
Mice were injected intraperitoneally with either 2 M NaCl (5 ml per kg BW) or mannitol solution (10 ml per kg BW) and maintained with no food or water for 10 min before the behavioral assay or 1 hr before immunohistological staining. Mannitol was used for long-term consumption assay and Fos immunostaining, and NaCl was used for short-term consumption assay. We did not find significant differences between the results obtained with these two solutions.
Sodium depletion with osmotic thirst:
Mice were sodium depleted via furosemide as mentioned above. Mice were injected intraperitoneally with 2M mannitol solution (10 mg per kg BW) and maintained with no food or water for 10 min before behavioral assay.
Hunger:
Mice were food deprived for 24 hr before the behavior test or immunohistological staining.
Hypovolemic thirst:
Mice were injected intraperitoneally with furosemide at a dose of 50 mg per kg BW and maintained with no food or water for 3 hr before behavior test or 4 hr immunohistological staining.
PGE2-induced behavior:
PGE2 was injected subcutaneously at a dose of 1 mg per kg BW. Animals had no food or water for 15–90 min before behavioral experiments. For immunohistochemistry, PGE2 was injected at a dose of 3 mg per kg BW and maintained with no food or water for 60 min before euthanasia.
Visceral malaise:
Mice were injected intraperitoneally with 0.15 M LiCl at a dose of 15 ml per kg BW and euthanized 1 hr after injection for immunohistological staining.
Solution preparation
Tastants:
We chose the concentrations of taste/salt solutions based on previous literature13,80. In the mammalian taste system, aversive components of high salt and KCl share the same taste pathways81. Thus, we supplemented KCl in low-salt solutions to increase the aversiveness of salt solution without changing activity of the low-salt specific ENaC pathway.
Capsaicin82:
Capsaicin was prepared as 3 mM stock in 30% ethanol. For brief access assay, the solution was further diluted to 1 or 0.3 μM with water. Water containing ethanol equal to 1 μM capsaicin was used for control.
Prostaglandin:
PGE2 powder was diluted in DMSO at 50 mg/ml as stock. For behavioral assay, we used the final concentration of 1 mg per kg BW in PBS containing 1.7% DMSO (v/v). The same vehicle with DMSO was used as control.
Behavioral assays
All assays were performed in a custom gustometer (Dialog Instruments). All animals were at least trained with osmotic thirst and sodium depletion prior to the behavior trials. Animals were trained to drink at least 200 licks for 500 mM NaCl in 30 min under sodium depletion. Generally, two training sessions with sodium depletion are sufficient to achieve this criterion. Animals often show neophobia to a new solution even if it was an attractive stimulus. To prevent this, all tastants at lower concentrations were exposed to animals before experiment. In this study, we used one-bottle consumption assay for most tolerance tests.
For 30-min access assay, mice were presented with 1 bottle for 30 min and consumption was measured.
For 5-sec brief access assay, mice were presented with 1 bottle of solution for 30 sec per trial for maximum waiting time before the first lick, and 40 sec between trials. After an initial lick, animals were allowed to drink the solution for additional 5 sec before a shutter closed. To avoid taste conditioning effect, animals were tested with only one solution per day. After testing aversive solutions, bitter and high salt, animals sometimes refused to drink any solution. These animals were retrained with water and low salt until their behavioral level recovers to our criteria stated above.
Optogenetic and chemogenetic manipulation
For optogenetic activation, 473-nm laser-pulse sequences were delivered via an optic cable (Doric Lenses, MFP-FC-ZF) with pulse generators (World Precision Instruments, SYS-A310 or Quantum composers, Sapphire 9200). The laser intensity was maintained at 10 mW at the tip of the fiber. For 30-min access assay, the light stimulation was given at 20 Hz with a 1-sec on 3-sec off paradigm. For 5-sec brief access assay, the light stimulation was given at 20 Hz throughout the trial except the paradigm in Figure 3C. For chemogenetic experiments, clozapine N-oxide (CNO) was administered intraperitoneally at doses of 10 mg per kg BW for inhibition or 1 mg per kg BW for activation 20 min before the consumption trial started. Pure water instead of saline was used as vehicle to avoid sodium repletion.
Long term consumption assay
Liquid consumption level was monitored in the Biodaq system (Research Diets)83. Mice were individually housed and acclimated in the cage at least for 24 hr before the data collection. We considered that animals were acclimated when they consumed more than 1 g of water and low salt overnight. Animals were offered only one type of liquid overnight and were provided with water during the daytime to replete. 60 mM NaCl, 60 mM NaCl with 440 mM KCl, 60 mM NaCl with 40 mM CaCl2, 60 mM NaCl with 40 mM MgCl2, 500 mM NaCl and water were applied. Data for consumption were analyzed from 6 to 9 pm. Prolonged measurement with aversive solutions often causes dehydration if animals refuse to drink. To avoid internal state transition over time, we measured consumption within a limited time window.
Pain induction
Acute Pain (foot shock):
Animals were acclimatized in the operant conditioning chamber for 10 min (MedAssociates). A constant current of 0.25 mA was delivered to the metal grid floor. Animals moved freely in the setting. The shock was delivered for a continuous 5-sec window followed by a 10-sec rest. Each trial lasted 2 min. For immunohistological staining, mice were euthanized 1 hr after exposure. The light stimulation was given at 20 Hz with a 1-sec on 3-sec off paradigm.
Thermal pain (heat shock):
A hotplate (Columbus instruments, 93291) was maintained at 52°C. Animals were placed onto the hotplate and the latency for licking paws was recorded. To test the effect of optogenetic stimulation, animals were tested on the hotplate, and re-tested following stimulations of 15 and 45 min. The light stimulation was given at 20 Hz with a 1-sec on 3-sec off paradigm.
Mechanical threshold (von Frey Test):
Mice were habituated on a metal grid floor, and were tested with von Frey filaments (Bioseb, BIO-VF-M) in ascending order. Each filament was tested 5 times. The withdrawal threshold was determined when the mice withdrew the paw for more than 3 times as the filament was applied until bent. To test the effect of optogenetic stimulation, mice were tested before stimulation and following a stimulation of 60 min. The light stimulation was given at 20 Hz with a 1-sec on 3-sec off paradigm.
Inflammatory pain (formalin test):
Mice were injected with 2% formalin (20 μl) in the dorsal hindpaw and placed in behavior chamber. Videos were taken for 1 hr following the injection and analyzed for the time mice spent licking the dorsal hindpaw. Mice with more than 30-sec licking paw time in the first 5 min after injection were used for video analysis. Each mouse was subjected to formalin injection twice: in one hind paw under sated conditions, and another under either sodium depleted or photostimulated conditions. To test the effect of optogenetic stimulation, light stimulation was given at 20 Hz with a 1-sec on 3-sec off paradigm for 60 min. For ELISA assay, blood was collected 30 or 90 min after formalin injection.
Taste aversion
Animals accessed 2 mM AceK in the gustometer after 24 hr food deprivation. Within 5 min after the trials finished, animals were given 0.15 M LiCl intraperitoneally, at a dose of 15 ml per kg BW. After one day rest, animals were food deprived again for 24 hr, and exposed to 2mM AceK in the gustometer. Photostimulation was given alternatively in 10 trials. Lick number was quantified respectively for the light stimulation on and off sessions.
Inflammation and consumption
Formalin-induced tolerance:
Mice were injected with formalin or PBS in the dorsal hindpaw 45–60 min prior to the lick access. Osmotic thirst was induced 10–15 min prior to the lick access. Lick number was recorded for 30 min.
NSAIDs-induced loss-of-tolerance:
NSAIDs were used to suppress PGE2 production84,85. Mice were given water supplemented with ibuprofen (1 mg per ml) for three days. On the second day, mice were injected with furosemide to induce sodium depletion. On the third day, aspirin (40 mg per kg BW) was injected intraperitoneally 1–2 hr prior to the lick access. Lick number was recorded for 30 min.
Fiber photometry
Calcium measurement from SFOPtger3 neurons:
Mice were headfixed to eliminate the interference from movement. Photometry recording was performed using a commercial photometry system (Neurophotometrics, FP3002). Two LED of different wavelength (470nm and 415nm) were bandpass filtered and a patch cord (0.48NA, Doric lenses) was attached to the photometry system via a 20x objective. The sampling rate was fixed at 40Hz. Data were acquired with Bonsai (Neurophotometrics) by drawing a region of interest and calculating the mean pixel value, and then were exported to MATLAB for further analysis. The isosbestic signal (415 nm) was fit with a biexponential model and was then linearly scaled to the calcium signal (470 nm). The ΔF/F was calculated as (raw 470-nm signal – fitted 415-nm signal)/ (fitted 415-nm signal). For all sessions, stimulus time was recorded through a customized TTL button. During PGE2 activation experiment (Figure 7C), mice were given PGE2 at a dose of 1 mg per kg BW or DMSO in 100 μl PBS subcutaneously. During other internal-state treatments, mice were exposed to the following stimuli via intraperitoneal injection: 2M mannitol (10 ml per kg BW); 10 μg of ghrelin (in 100 μl PBS), and 0.15M LiCl (15 ml per kg BW). All analysis used the average of 5 min prior to the stimulus as a baseline mean. Normalized ΔF/F was calculated by subtracting the baseline ΔF/F from the mean ΔF/F between 100 and 1500 sec after the stimulus.
Dopamine measurement:
Mice were freely moving in the chamber with gustometer. Bulk fluorescence signals were collected with a fiber photometry setting as described56 with the light of 405 nm and 490 nm. The ΔF/F was calculated as (raw 490-nm signal – fitted 405-nm signal)/ (fitted 405-nm signal). Mice were induced with osmotic thirst 10–15 min, or sodium depletion 24 hr before the access of 500 mM NaCl. For wild-type mice, under PGE2 activation condition, mice were injected PGE2 at a dose of 1 mg per kg BW subcutaneously 1 hr before the shutter open. For Ptger3Cre mice, mice were injected with either CNO or vehicle 20 min before the shutter opened. Lick number was recorded simultaneously with the fluorescence signal collection. The first lick bout was identified with the lick rate more than 3.5 and lick number more than 5, with less than 1-sec interval to the subsequent lick. If no lick bout was detectable (observed with osmotic thirst), any first lick event was included into the data. All baseline signals were calculated by averaging signals between 10–20 sec prior to the first lick. Response amplitude (normalized ΔF/F) was calculated by subtracting the baseline ΔF/F from the mean ΔF/F between 0 and 10 sec after the lick initiated.
PGE2-AMCA dye infusion
PGE2 was conjugated to AMCA as a synthesized dye. Mice were anaesthetized with ketamine (1 mg/ml) and xylazine (10 mg/ml) at a dose of 10 ml per kg BW. Mice was administrated with the dye or vehicle via tail vein at a dose of 1 mg per kg BW. Five minutes post-injection, fresh brain was extracted, and SFO was dissected under a microscope, Several drops of PBS was added onto the slice to prevent tissue dryness. Slices were imaged under LSM 880 with Fast Airyscan using 20x z-stack (Airyscan SR Mode, detector-1.25 AU). SFO was identifiable between two paralleled blood vessels. For analysis in ImageJ, the image was rotated to an angle that the two blood vessels were vertical. Fluorescence was extraced by an arbitrary horizontal line at the dorsal side. The ΔF/F was calculated as (fluorescence from 100-μm in SFO – average of fluorescence from dorsal and ventral 100-μm outside of SFO) / (average of fluorescence from dorsal and ventral 100-μm outside of SFO).
Immunohistochemistry
Mice were euthanized with CO2 and perfused with PBS and 4% paraformaldehyde. Extracted mouse brains were fixed overnight at 4 °C in 4% PFA and sectioned coronally to 100-μm slides via vibratome (Leica, VT-1000 S). The sections were blocked (10% donkey serum, 0.2% Triton X-100 in PBS) for 1 hr at room temperature and incubated with primary antibody at 4 °C overnight. The following primary antibodies were used: rabbit anti-FOS (1:500), sheep anti-Foxp2 (1:2,000), chicken anti-GFP (1:3,000), rat anti-mCherry (1:500), and goat anti-nNos (1:500). The sections were washed three times with PBS and incubated with the secondary antibody (1:500; Jackson Immunoresearch) and DAPI (2 μg/ml) for 4 hr under room temperature. After three times wash with PBS, the sections were mounted on the glass slide. All slides were imaged with confocal microscope (Leica, TCS SP8) or slide scanner (Olympus, BX61VS).
Plasma PGE2, progesterone, and serotonin concentration measurement
Mice were anaesthetized with isoflurane. Blood was collected via heart puncture into EDTA-coated tubes (BD Microtainer, 365974) and kept on ice. Plasma was then separated by centrifugation at 1,500 g for 20 min. ELISA assays were performed following the protocols of PGE2 ELISA kit (Cayman Chemical, 514531), serotonin ELISA kit (Eagle Bio, SER39-K01), and progesterone ELISA kit (Cayman Chemical, 582601).
Taste nerve recording
Surgery and recording procedures were performed as described13,86. Briefly, mice were anesthetized with pentobarbital (100 mg per kg BW) and placed in a custom-made head-fixation setup, with body temperature maintained at 37 °C. Tracheotomy was performed. The right branch of the chorda tympani nerve was exposed, and recording was performed with a high-impedance tungsten electrode hooking the nerve bundle. Tastant stimuli were delivered with a pressurized perfusion system (AutoMate Scientific) for 20 sec, with a 40-sec wash with artificial saliva. The artificial saliva was made with 20x stock and on the day of experiment, was diluted with the addition of 6 mM KHCO3 and 6 mM NaHCO3. The pH was adjusted to 7.2–7.6. For recording, each mouse underwent two sets of experiments in a specific internal state. Two sets of experiments were in a randomized order and each experiment was repeated with 2–3 trials according to the mice condition. For the NaCl experiment, 10/30/60/120/250/500 mM NaCl and 4 mM AceK were applied. For multiple tastant experiments, the following taste stimuli were used: 60 mM NaCl (salty), 10 mM citric acid (sour), 4 mM acesulfame potassium (sweet), 50 mM monopotassium glutamate plus 1 mM inosine monophosphate (umami), 500 mM KCl (bitter), and 1 mM quinine (bitter). Signals were recorded with Axon Digidata 1550B Low-Noise Data Acquisition System, and Grass RPS312 RM Power Supply with P511 AC Amplifier (Natus Neurology).
The data were processed using a custom Matlab code. Briefly, the original data (sampled at 10k Hz) were time-binned at 0.1 sec. The recording traces were visualized by processing time-binned data with a rolling-median of 3 sec. A 3-sec time window before each stimulus served as a baseline. A 30-sec response window was quantified, starting when the signals exceeded 3 standard deviations (SD) above baseline. The data were normalized to the average of two consecutive 4 mM AceK trials. For photostimulation trials, when the tastants washed through, light was delivered at 20 Hz, 10 mW for 30 sec.
Single cell RNA sequencing
Tissue processing into single-cell suspensions:
For the sodium-depleted condition, 15–20 mice, 7–8 weeks old, were sodium depleted for 24 hr. For sated condition, 15 sated mice were used. The tissue processing procedure was performed as described. Briefly, upon isoflurane anaesthesia, the brains were exacted from the mice and kept in ice-cold carbogenated NMDG-HEPES-ACSF. Brains were sectioned to 2 mm, SFO was harvested into ice-cold NMDG-HEPES-ACSF by peeling the tissue (SFO) microdissection under microscope. After tissue collection, NMDG-HEPES-ACSF was replaced with trehalose-HEPES-ACSF containing papain (80 U/ml; pre-activated with 2.5 mM cysteine and a 30-min incubation at 34 °C with 0.5 mM EDTA) and 15 μM actinomycin D. Extracted SFO tissue was incubated at 34 °C with gentle carbogenation for 60–90 min. The tissue was pipetted periodically every 10 min during this digestion. At the end of enzymatic digestion, the medium was replaced with 200 μl of trehalose-HEPES-ACSF with 3 mg/ml ovomucoid inhibitor 25 U/ml DNase I and 15 μM actinomycin D. The SFO tissue was gently triturated with 600, 300 and 150 μm-diameter fire-polished glass Pasteur pipettes in less than 10 mins. The tissue was processed into a uniform single-cell suspension and the total volume was brought up to 1 ml with trehalose-HEPES-ACSF with 3 mg/ml ovomucoid inhibitor. The suspension was filtered through a 40-μm cell strainer (Falcon, 352340) into a new microcentrifuge tube and was centrifuged with 300 g for 5 min at 4 °C. The supernatant was discarded, and the cell pellet was resuspended with fresh ice-cold resuspension buffer and kept on ice while cell densities were quantified with a hemocytometer. The final cell suspension volume estimated to retrieve ~10,000 single-cell transcriptomes were added to the 10x Genomics RT reaction mix and loaded to the 10X Single Cell G chip (10x Genomics, PN-1000127). The Chromium Single Cell 3′ GEM, Library and Gel Bead Kit v3.1 (PN-1000128) and the Single Index Kit T Set A (PN-1000213) were used. The cDNA and library amplification underwent 11 and 12 cycles respectively.
Sequencing data pre-processing and analysis
The scRNA-seq sequencing libraries were sequenced on an NovaSeq S4 lane. The sequencing reads were mapped to the custom-made pre-mRNA reference transcriptome, and gene-cell matrices were generated via the 10x Genomics Cell Ranger pipeline as previously described87. Subsequent gene expression analyses were conducted in R (4.1.2) using Seurat (4.0.3) as previously described30,88. Cells were filtered if possessing fewer than 1,000 or more than 45,000 unique transcripts, or more than 15% of mitochondrial transcripts. Transcriptomic cell types were identified and cell clusters co-expressing two or more markers for canonical cell classes were excluded. Both sodium depletion and sated conditions included two trials collected from different time points for the consistency of the data. Four data sets were merged into a single-gene expression-matrix and canonical correlation analysis was applied. This yielded an SFO data set of 7819 neurons (four sets merged). Dimensionality reduction was performed with 25 principal components for major cell classes and 10 to 13 principal components for neural subtypes. The resolution of clustering was 0.8 for all cell classes and 0.6 – 2 for neural subtypes. Canonical correlation analysis was performed to adjust the misalignment of transcriptomic neuron types due to physiological-state-derived transcriptional changes. We normalized the gene expression with identified integration anchors based on the top 200 differentially expressed gene sets from the untreated neural data set. For Figure S2B, neuron matrix from sated- and sodium-depleted states were analyzed together with the previous hypovolemia neuron matrix.
Spatial transcriptomics
SeqFISH gene panel design:
A custom seqFISH panel was designed to incorporate canonical cell-type-marker genes based on our scRNA-seq dataset analysis36. The panel contained 192 genes of which 174 were detected using barcoded seqFISH imaging and 18 were identified serially via single-molecule FISH. The panel was custom ordered by Spatial Genomics, Inc.
SeqFISH sample collection and preparation:
Adult (8–12 weeks old) C57BL/6J male mice under sated or sodium depleted states were euthanized (n = 5 mice per state). Each brain was dissected, freshly embedded in Tissue-Tek O.C.T. Compound (Sakura, 4583), and then flash-frozen in liquid nitrogen. Cryosections of 10-μm thickness containing the SFO were cut and mounted onto treated coverslips. Immediately post-collection, sections were fixed in fresh 4% paraformaldehyde (Thermo Scientific, 28908) for 15 min at room temperature. After rinsing three times in 1X PBS for 5 min each, sections were dehydrated using 70% ethanol for 30 sec at room temperature. The sections were air-dried at room temperature for approximately 15 min and stored at −80C. SeqFISH experiments were performed using the seqFISH+ protocol with some modifications at Spatial Genomics, Inc. Briefly, the fixed tissue sections underwent permeabilization in 70% ethanol followed by clearing, rinsing, and air-drying steps. The coverslip containing each section was assembled into Spatial Genomics custom flow cells. The flow cells were then hybridized with the seqFISH primary probe panel and incubated in a humidified chamber at 37 °C for 24 hr. After hybridization, samples were washed with buffers for subsequent imaging.
seqFISH imaging via Gene Positioning System:
Imaging was performed using the Gene Positioning System (GenePS, Spatial Genomics, Inc.), which enables automated image acquisition, reagent delivery, and data processing. The SFO was selected as a region of interest (ROI) for the experiment based on the brightfield and/or DAPI images. Automated experiment execution was initiated post-ROI selection. Each experiment proceeded through multiple rounds of decode probe hybridization, imaging, and signal removal until all the hybridization rounds were complete.
Image processing and analyses:
Raw-image files were processed on-instrument to align images across multiple hybridization rounds and detect RNA fluorescent signals. The data were further analyzed using custom Spatial Genomics analysis software to decode the transcript identities and segment cells. Cell segmentation was performed using a machine learning algorithm based on the nuclear DAPI stain. The decoded RNA molecules were then assigned to individual cells, generating cell-by-gene count matrices and individual cell center coordinates for each ROI. For the downstream data analysis, cells that had unique gene counts of less than 10 were filtered. The images of the spatial distribution of the major cell types in the SFO with cell segmentation boundaries and color-coded cell type identities were directly generated by the Spatial Genomics analysis software. The spatial distribution of neurons was plotted according to cell center coordinates using Python (3.9.12). Individual neuron types were labeled with different colors based on raw transcripts of the neuronal subtype marker genes after manual curation. UMAP and violin plots were generated using Seurat (4.2.1) in R (4.1.1).
RNAscope-based multicolour in situ hybridization
In situ hybridization was performed with the RNAscope Multiplex Fluorescent Assay versions 1 or 2 (Advanced Cell Diagnostics, 320850). Fixed-frozen brains from C57BL/6J, Ptger3Cre/wt and Ptger3Cre/Cre (equivalent to knockout) were prepared following the manufacturer’s protocols. Following probes were applied to the samples: Cre (312281), Ptger3 (504481 and 501831), GFP (409011), and Pdyn (318771). The samples were imaged with confocal microscopy and visualized via z-stacks.
Quantification and Statistical Analysis
No statistical methods were used to predetermine sample size. The experiments were not randomized, and investigators were not blinded to allocation during experiments and outcome assessment. Data are presented as means ± SEMs in figures. Wilcoxon test, Mann-Whitney test, and one- or two-way ANOVA with post hoc tests were applied to decide the significance level. Significant threshold was maintained at α = 0.05 (ns p > 0.05, *p < 0.05, **p < 0.01, ***p < 0.001).
Supplementary Material
Figure S1. Salt tolerance is enhanced under sodium depletion but not under thirst or pre-LCPdyn-induced appetite, related to Figure 1.
(A) A diagram of appetitive and aversive salt taste pathways. Low concentrations of salt only activate the appetitive ENaC pathway, and animals exhibit a behavioral attraction. Higher concentrations of salt recruit additional aversive taste pathways (bitter and sour), driving strong behavioral aversion despite the activation of appetitive ENaC pathway. (B-C) Cumulative consumption curves under osmotic thirst and sodium-depleted conditions from the data in Figure 1A.
(D) The total lick numbers were quantified from the data in Figure 1D. Unstimulated control data (grey) were shown together.
(E) Left, Comparison of low- and high-salt consumption in pre-LCPdyn-stimulated animals (blue) and sodium-depleted animals (red). Right, consumption ratio between low salt and high salt. pre-LCPdyn-stimulated animals preferred low salt while sodium-depleted animals consumed significantly more high salt (n = 12–15 mice). The data were reanalyzed from Figure 1D.
(F) Sodium-selective, behavioral attraction is mediated by pre-LCPdyn neurons. The number of licks toward high salt (500 mM NaCl) was quantified during pre-LCPdyn photostimulation with or without 30 μM amiloride. High salt consumption induced by pre-LCPdyn neurons was ENaC dependent (n = 5–6 mice).
Data are expressed as mean ± SEM, *p < 0.05, **p < 0.01, ***p < 0.001. See also Table S1.
Figure S2. Neural activation of SFO and OVLT under sodium depletion and hypovolemia, related to Figure 2.
(A) Representative images of OVLT activation in sated (top) and sodium-depleted (bottom) conditions. The OVLT was visualized with nNos (blue) and Fos (red) activation was compared between conditions.
(B) Violin plots of Fos (red) and Ptger3 (blue) in the SFO under hypovolemia conditions. Ptger3-expressed neurons were a partial population active in hypovolemia.
(C) Representative Fos immunofluorescence signals (red) under hypovolemia in the SFO. Ptger3 neurons are labeled in green.
(D) Spatial distribution of all cells according to the original cell center coordinates. Individual excitatory neuron types are highlighted in colors (as indicated).
Scale bar, 25 μm (C, magnified images), 100 μm (A, C, and D). See also Table S1.
Figure S3. Functional characterization of SFOPtger3 neurons, related to Figure 3.
(A) Characterization of Ptger3Cre transgenic line in the whole brain. Shown are representative GFP signals from a Ptger3Cre/wt animal. Strong GFP signals were found in the SFO, island of Calleja major (ICjM), preoptic area (POA), paraventricular thalamus (PVT), cortex, periaqueductal gray (PAG), and raphe pallidus (RPa).
(B) Quantified Fos+ cells in the SFO that overlapped with Ptger3-GFP signals. Shown are the ratio of activated Ptger3+ neurons divided by total Fos+ cells (n = 2–6 sections from 2–5 mice).
(C) Representative images of Ptger3-Cre:GFP (green) overlap with AAV-DIO-ChR2-mCherry (red). 88% of mCherry+ neurons expressed Ptger3-Cre:GFP, and 72% of Cre:GFP+ neurons were mCherry+ (n = 7 sections from 6 mice).
(D) Relationship between virus expression level and salt tolerance. The number of ChR2+ neurons per section and lick numbers toward high salt are shown for individual animals tested. Note that salt tolerance and the number of ChR2+ neurons have a high correlation coefficient (n = 16 mice).
(E) Control experiments for ChR2 photostimulation using mCherry (n = 5 mice).
(F) Amiloride did not affect salt tolerance induced by SFOPtger3. Unlike pre-LCPdyn neurons, SFOPtger3 -induced tolerance is independent of the ENaC pathway (n = 5 mice).
(G) Sodium-depletion-induced tolerance in thirsty mice. Mice were subjected to osmotic thirst (grey) and osmotic thirst + sodium depletion (red), and the number of licks toward 250 and 500 mM NaCl were quantified (n = 6–12 mice). The thirst data for 250 mM NaCl included the data from Figure 3D.
(H) A representative image of Ptger3 (green) and Fos (red) immunofluorescence signals in the OVLT.
(I) LTPtger3 neurons are required for normal salt tolerance under hypovolemia. The number of licks toward 500 mM NaCl during a 30-min trial with vehicle (grey) or CNO (red) injection under hypovolemia (n = 6 mice).
(J) SFOPtger3 neurons are required for normal salt tolerance. Left, a diagram of chemogenetic loss-of-function experiments. AAV-DIO-hM4Di was injected into the SFO. Right, the number of licks for low salt, low salt with KCl or quinine was quantified during a 30-min session under sodium depletion. Before behavioral experiments, animals received intraperitoneal injection of either vehicle (grey) or CNO (red) (n = 6 mice).
Data are expressed as mean ± SEM, *p < 0.05, **p < 0.01, ***p < 0.001. Scale bar, 500 μm (A), 100 μm (C and H). See also Table S1.
Figure S4. Specificity of sensory modulation by SFOPtger3 neurons, related to Figure 5.
(A) Trpm5−/− animals that lack bitter, sweet, and umami tastes showed elevated tolerance toward aversive tastes. Left, consumption of water and 60 mM NaCl during a 30-min session under osmotic thirst in wild-type (grey) and Trpm5−/− mice (red, n = 3–14). Right, consumption of 500 mM NaCl, 60 mM NaCl with 440 mM KCl, and 60 mM NaCl with 0.25 mM quinine during a 30-min session under osmotic thirst in wild-type (grey) and Trmp5−/− mice (red) (n = 3–14). For wild-type control, the data were reanalyzed from Figure 1A. (B) Stimulation of pre-LCPdyn neurons did not affect behavioral aversion toward bitter tastes. The number of licks was quantified for water, 0.125 and 0.25 mM quinine under osmotic thirst conditions in the absence (black) or presence (red) of photostimulation to pre-LCPdyn neurons (n = 4–6 mice).
(C) Learned taste aversion was not alleviated by the activity of SFOPtger3 neurons. Left, a conditioned-taste-avoidance paradigm toward AceK (2 mM) by LiCl injection. Right, consumption of AceK before (grey) and after (−stim, blue; +stim, red) conditioning (n = 6). (D-E) Various aversive stimuli were presented to animals under sated, sodium-depleted, and SFOPtger3-stimulated conditions. Animals were subjected to noxious heat on a hot plate (D), and von Frey test (E). Neither sodium depletion nor SFOPtger3-stimulation blunted general aversive or tactile responses (n = 4–12 mice).
(F) Acute and inflammatory pain test. Left, a histogram showing the time spent paw-licking after formalin injection plotted in 5-min bins in sated and sodium-depleted conditions. Right, a cumulative time of paw-licking during the acute pain period (0–5 min after formalin injection) and the inflammatory pain period (15–45 min after formalin injection). The data were compared between sated (grey) and sodium-depleted (red) groups (n = 4 mice). (G) Photostimulation of SFOPtger3 neurons had no effects on pain responses. Left, a histogram showing the time spent paw-licking after formalin injection without (grey) or with (red) photostimulation. Right, quantified cumulative time of paw-licking (n = 4 mice). Data are expressed as mean ± SEM, *p < 0.05, **p < 0.01, ***p < 0.001. Scale bar, 100 μm. See also Table S1.
Figure S5. Ptger3 in the SFO plays a major function for aversive taste tolerance, related to Figure 6.
(A) UMAP embedding of Ptger1, Ptger2 and Ptger4 log-normalized expression in the SFO demonstrating minimal expression of these three prostaglandin receptors.
(B) Ptger3Cre/Cre mice did not show tolerance toward aversive taste under osmotic thirst (n = 4–9 mice).
(C) Knocking down of Ptger3 in the SFO in the background of Trpm5−/− animals did not reduce tolerance toward aversive salt under osmotic thirst. The lick number of water and 500 mM NaCl in scramble- (grey) and Ptger3- (red) shRNA- injected Trpm5−/− animals were shown (n = 5–6 mice).
Data are expressed as mean ± SEM, *p < 0.05, **p < 0.01. See also Table S1.
Figure S6. Functional characterization of the PGE2/Ptger3 axis for aversive taste tolerance, related to Figure 7.
(A) Measurement of inflammation-related factors in the circulation by ELISA. Progesterone and serotonin (5-HT) levels were measured from sated (grey), formalin-injected (blue), and sodium depleted (red) animals (n = 7–8 mice).
(B) Control stimuli for fiber photometry recording from SFOPtger3 neurons. These neurons showed no activation toward i.p. mannitol injection (2 M, 10 ml per kg BW; osmotic thirst), ghrelin (10 μg; hunger), or LiCl (0.15 M, 15 ml per kg BW; visceral malaise). Calcium dynamics and response amplitude (normalized ΔF/F) of SFOPtger3 neurons are shown (n = 5 mice).
(C) PGE2 activated the SFO in a Ptger3-dependent pattern. Representative images and quantification of Fos immunofluorescence signals after subcutaneous injection of PGE2 in Ptger3Cre/wt (grey, n = 4 mice) and Ptger3Cre/Cre mice (red, n = 4 mice).
(D) Ptger3 in the SFO is required for PGE2 responses. Representative images after subcutaneous injection of PGE2 in scramble- (top) and Ptger3- (bottom) shRNA-injected mice were shown. No Fos signal was found in the pre-LC.
(E) PGE2 induced tolerance in wild-type animals. Consumption of 500 mM NaCl was measured under sated and osmotic thirst after subcutaneous injection of vehicle (grey) or PGE2 (red, n =9 mice).
(F) PGE2-induced aversive taste tolerance in food-deprived, wild-type animals. Left, a diagram of the behavioral paradigm. Right, the number of licks toward 0.25 mM quinine with 500 mM glucose in food-deprived mice after vehicle (grey) or PGE2 injection (red, n = 6).
(G) Thirsty Ptger3Cre/Cre mice consumed pure water after vehicle (grey) or PGE2 (red) subcutaneous injection (n = 4 mice).
(H) Thirsty Ptger3 KD mice consumed pure water after vehicle (grey) or PGE2 (red) subcutaneous injection (n = 8–10 mice).
(I) Formalin-induced inflammation increased tolerance towards 500 mM NaCl during thirst (n = 5–10). Water intake was unaffected by the same treatment.
Data are expressed as mean ± SEM, *p < 0.05, **p < 0.01, ***p < 0.001. Scale bar, 100 μm. See also Table S1.
Figure S7. Bimodal modulations of attractive and aversive taste signals by the brain, related to Figure 7.
(A) A diagram of bimodal salt taste modulation. Low salt through the ENaC pathway and aversive high salt through bitter/sour pathways are modulated by two separate interoceptive circuits in the forebrain (SFO) and hindbrain (pre-LC) circuits. These circuits sense internal sodium balance and trigger bimodal modulation signals that affect the hedonic value of salt in a concentration- and internal-state-dependent manner.
(B-C) B. Representative taste responses from chorda tympani nerve under distinct internal states. C. 10, 30, 60, 120, 250, and 500 mM NaCl were applied to the tongue, and integrated nerve responses were quantified for each concentration (n = 5 mice).
(D) Taste nerve recording with SFOPtger3 photostimulation. Left, a diagram of chorda tympani nerve recording combined with optogenetics. Right, quantification of normalized responses to NaCl without (black), or with photostimulation (red) state (n = 3 mice). ChR2 expression was validated by immunohistology and behavioral tolerance induction.
(E) AAV-DIO-ChR2-EYFP was injected into SFOPtger3 and the downstream projections were visualized. Strong projections were found in the following brain areas: MnPO, vBNST, paraventricular nucleus of the thalamus (PVT), paraventricular nucleus of the hypothalamus (PVN), and dorsomedial hypothalamus (DMH). Scale bar, 100 μm.
Videos S1. SFOPtger3 induced salt tolerance, related to Figure 3. Representative drinking behavior toward high salt under osmotic thirst with photostimulation of SFOPtger3 neurons.
Videos S2. Control experiment for Video S1 without light, related to Figure 3. Representative drinking behavior toward high salt under osmotic thirst without photostimulation of SFOPtger3 neurons.
LIFE SCIENCE TABLE WITH EXAMPLES FOR AUTHOR REFERENCE
| REAGENT or RESOURCE | SOURCE | IDENTIFIER |
|---|---|---|
| Antibodies | ||
| Rabbit monoclonal anti-Snail | Cell Signaling Technology | Cat#3879S; RRID: AB_2255011 |
| Mouse monoclonal anti-Tubulin (clone DM1A) | Sigma-Aldrich | Cat#T9026; RRID: AB_477593 |
| Rabbit polyclonal anti-BMAL1 | This paper | N/A |
| Bacterial and virus strains | ||
| pAAV-hSyn-DIO-hM3D(Gq)-mCherry | Krashes et al.1 | Addgene AAV5; 44361-AAV5 |
| AAV5-EF1a-DIO-hChR2(H134R)-EYFP | Hope Center Viral Vectors Core | N/A |
| Cowpox virus Brighton Red | BEI Resources | NR-88 |
| Zika-SMGC-1, GENBANK: KX266255 | Isolated from patient (Wang et al.2) | N/A |
| Staphylococcus aureus | ATCC | ATCC 29213 |
| Streptococcus pyogenes: M1 serotype strain: strain SF370; M1 GAS | ATCC | ATCC 700294 |
| Biological samples | ||
| Healthy adult BA9 brain tissue | University of Maryland Brain & Tissue Bank; http://medschool.umaryland.edu/btbank/ | Cat#UMB1455 |
| Human hippocampal brain blocks | New York Brain Bank | http://nybb.hs.columbia.edu/ |
| Patient-derived xenografts (PDX) | Children’s Oncology Group Cell Culture and Xenograft Repository | http://cogcell.org/ |
| Chemicals, peptides, and recombinant proteins | ||
| MK-2206 AKT inhibitor | Selleck Chemicals | S1078; CAS: 1032350-13-2 |
| SB-505124 | Sigma-Aldrich | S4696; CAS: 694433-59-5 (free base) |
| Picrotoxin | Sigma-Aldrich | P1675; CAS: 124-87-8 |
| Human TGF-β | R&D | 240-B; GenPept: P01137 |
| Activated S6K1 | Millipore | Cat#14-486 |
| GST-BMAL1 | Novus | Cat#H00000406-P01 |
| Critical commercial assays | ||
| EasyTag EXPRESS 35S Protein Labeling Kit | PerkinElmer | NEG772014MC |
| CaspaseGlo 3/7 | Promega | G8090 |
| TruSeq ChIP Sample Prep Kit | Illumina | IP-202-1012 |
| Deposited data | ||
| Raw and analyzed data | This paper | GEO: GSE63473 |
| B-RAF RBD (apo) structure | This paper | PDB: 5J17 |
| Human reference genome NCBI build 37, GRCh37 | Genome Reference Consortium | http://www.ncbi.nlm.nih.gov/projects/genome/assembly/grc/human/ |
| Nanog STILT inference | This paper; Mendeley Data | http://dx.doi.org/10.17632/wx6s4mj7s8.2 |
| Affinity-based mass spectrometry performed with 57 genes | This paper; Mendeley Data | Table S8; http://dx.doi.org/10.17632/5hvpvspw82.1 |
| Experimental models: Cell lines | ||
| Hamster: CHO cells | ATCC | CRL-11268 |
| D. melanogaster: Cell line S2: S2-DRSC | Laboratory of Norbert Perrimon | FlyBase: FBtc0000181 |
| Human: Passage 40 H9 ES cells | MSKCC stem cell core facility | N/A |
| Human: HUES 8 hESC line (NIH approval number NIHhESC-09-0021) | HSCI iPS Core | hES Cell Line: HUES-8 |
| Experimental models: Organisms/strains | ||
| C. elegans: Strain BC4011: srl-1(s2500) II; dpy-18(e364) III; unc-46(e177)rol-3(s1040) V. | Caenorhabditis Genetics Center | WB Strain: BC4011; WormBase: WBVar00241916 |
| D. melanogaster: RNAi of Sxl: y[1] sc[*] v[1]; P{TRiP.HMS00609}attP2 | Bloomington Drosophila Stock Center | BDSC:34393; FlyBase: FBtp0064874 |
| S. cerevisiae: Strain background: W303 | ATCC | ATTC: 208353 |
| Mouse: R6/2: B6CBA-Tg(HDexon1)62Gpb/3J | The Jackson Laboratory | JAX: 006494 |
| Mouse: OXTRfl/fl: B6.129(SJL)-Oxtrtm1.1Wsy/J | The Jackson Laboratory | RRID: IMSR_JAX:008471 |
| Zebrafish: Tg(Shha:GFP)t10: t10Tg | Neumann and Nuesslein-Volhard3 | ZFIN: ZDB-GENO-060207-1 |
| Arabidopsis: 35S::PIF4-YFP, BZR1-CFP | Wang et al.4 | N/A |
| Arabidopsis: JYB1021.2: pS24(AT5G58010)::cS24:GFP(-G):NOS #1 | NASC | NASC ID: N70450 |
| Oligonucleotides | ||
| siRNA targeting sequence: PIP5K I alpha #1: ACACAGUACUCAGUUGAUA | This paper | N/A |
| Primers for XX, see Table SX | This paper | N/A |
| Primer: GFP/YFP/CFP Forward: GCACGACTTCTTCAAGTCCGCCATGCC | This paper | N/A |
| Morpholino: MO-pax2a GGTCTGCTTTGCAGTGAATATCCAT | Gene Tools | ZFIN: ZDB-MRPHLNO-061106-5 |
| ACTB (hs01060665_g1) | Life Technologies | Cat#4331182 |
| RNA sequence: hnRNPA1_ligand: UAGGGACUUAGGGUUCUCUCUAGGGACUUAGGGUUCUCUCUAGGGA | This paper | N/A |
| Recombinant DNA | ||
| pLVX-Tight-Puro (TetOn) | Clonetech | Cat#632162 |
| Plasmid: GFP-Nito | This paper | N/A |
| cDNA GH111110 | Drosophila Genomics Resource Center | DGRC:5666; FlyBase:FBcl0130415 |
| AAV2/1-hsyn-GCaMP6- WPRE | Chen et al.5 | N/A |
| Mouse raptor: pLKO mouse shRNA 1 raptor | Thoreen et al.6 | Addgene Plasmid #21339 |
| Software and algorithms | ||
| ImageJ | Schneider et al.7 | https://imagej.nih.gov/ij/ |
| Bowtie2 | Langmead and Salzberg8 | http://bowtie-bio.sourceforge.net/bowtie2/index.shtml |
| Samtools | Li et al.9 | http://samtools.sourceforge.net/ |
| Weighted Maximal Information Component Analysis v0.9 | Rau et al.10 | https://github.com/ChristophRau/wMICA |
| ICS algorithm | This paper; Mendeley Data | http://dx.doi.org/10.17632/5hvpvspw82.1 |
| Other | ||
| Sequence data, analyses, and resources related to the ultra-deep sequencing of the AML31 tumor, relapse, and matched normal | This paper | http://aml31.genome.wustl.edu |
| Resource website for the AML31 publication | This paper | https://github.com/chrisamiller/aml31SuppSite |
PHYSICAL SCIENCE TABLE WITH EXAMPLES FOR AUTHOR REFERENCE
| REAGENT or RESOURCE | SOURCE | IDENTIFIER |
|---|---|---|
| Chemicals, peptides, and recombinant proteins | ||
| QD605 streptavidin conjugated quantum dot | Thermo Fisher Scientific | Cat#Q10101MP |
| Platinum black | Sigma-Aldrich | Cat#205915 |
| Sodium formate BioUltra, ≥99.0% (NT) | Sigma-Aldrich | Cat#71359 |
| Chloramphenicol | Sigma-Aldrich | Cat#C0378 |
| Carbon dioxide (13C, 99%) (<2% 18O) | Cambridge Isotope Laboratories | CLM-185-5 |
| Poly(vinylidene fluoride-co-hexafluoropropylene) | Sigma-Aldrich | 427179 |
| PTFE Hydrophilic Membrane Filters, 0.22 μm, 90 mm | Scientificfilters.com/TischScientific | SF13842 |
| Critical commercial assays | ||
| Folic Acid (FA) ELISA kit | Alpha Diagnostic International | Cat# 0365-0B9 |
| TMT10plex Isobaric Label Reagent Set | Thermo Fisher | A37725 |
| Surface Plasmon Resonance CM5 kit | GE Healthcare | Cat#29104988 |
| NanoBRET Target Engagement K-5 kit | Promega | Cat#N2500 |
| Deposited data | ||
| B-RAF RBD (apo) structure | This paper | PDB: 5J17 |
| Structure of compound 5 | This paper; Cambridge Crystallographic Data Center | CCDC: 2016466 |
| Code for constraints-based modeling and analysis of autotrophic E. coli | This paper | https://gitlab.com/elad.noor/sloppy/tree/master/rubisco |
| Software and algorithms | ||
| Gaussian09 | Frish et al.1 | https://gaussian.com |
| Python version 2.7 | Python Software Foundation | https://www.python.org |
| ChemDraw Professional 18.0 | PerkinElmer | https://www.perkinelmer.com/category/chemdraw |
| Weighted Maximal Information Component Analysis v0.9 | Rau et al.2 | https://github.com/ChristophRau/wMICA |
| Other | ||
| DASGIP MX4/4 Gas Mixing Module for 4 Vessels with a Mass Flow Controller | Eppendorf | Cat#76DGMX44 |
| Agilent 1200 series HPLC | Agilent Technologies | https://www.agilent.com/en/products/liquid-chromatography |
| PHI Quantera II XPS | ULVAC-PHI, Inc. | https://www.ulvac-phi.com/en/products/xps/phi-quantera-ii/ |
Highlight.
Sodium depletion increases appetite and tolerance toward salt.
Hindbrain and forebrain neural pathways regulate salt appetite and tolerance.
Specific neurons in the forebrain lamina terminalis encodes aversive salt tolerance.
Prostaglandin E2 and its receptor, Ptger3, regulate salt tolerance and consumption.
Acknowledgments:
We thank the members of the Oka laboratory and Sangjun Lee for helpful discussion and feedback comments. We thank Ashil Koranne and Jacob Hauser for maintaining and genotyping animal lines, and the Single Cell Profiling and Engineering Center (SPEC) in the Beckman Institute at Caltech. R.D.P thanks Serina Tsang and Kathy Kafer for help generating the Ptger3Cre mice and Susan Phelps for mouse husbandry. We thank Henry Lester and Anand k. Muthusamy for support for photometry recording setup, and Tomomi Karigo for Caspase virus. This work was supported by Startup funds from the President and Provost of California Institute of Technology and the Biology and Biological Engineering Division of California Institute of Technology. Y.O. is supported by New York Stem Cell Foundation, NIH (R01NS109997, R01NS123918), Alfred P. Sloan Foundation, Edward Mallinckrodt Foundation, and Heritage Medical Research Institute. Y.Z. was supported by Chen Graduate Fellowship.
Inclusion and Diversity
We support inclusive, diverse, and equitable conduct of research. While citing references scientifically relevant for this work, we also actively worked to promote gender balance in our reference list.
Footnotes
The authors declare no competing financial interests.
Declaration of interest
The authors declare no competing interests.
Publisher's Disclaimer: This is a PDF file of an unedited manuscript that has been accepted for publication. As a service to our customers we are providing this early version of the manuscript. The manuscript will undergo copyediting, typesetting, and review of the resulting proof before it is published in its final form. Please note that during the production process errors may be discovered which could affect the content, and all legal disclaimers that apply to the journal pertain.
References
- 1.Cabanac M (1971). Physiological Role of Pleasure. Science 173, 1103–1107. 10.1126/science.173.4002.1103. [DOI] [PubMed] [Google Scholar]
- 2.Berridge KC, and Schulkin J (1989). Palatability shift of a salt-associated incentive during sodium depletion. Q J Exp Psychol B 41, 121–138. [PubMed] [Google Scholar]
- 3.Berridge KC, Flynn FW, Schulkin J, and Grill HJ (1984). Sodium depletion enhances salt palatability in rats. Behav Neurosci 98, 652–660. 10.1037//0735-7044.98.4.652. [DOI] [PubMed] [Google Scholar]
- 4.Horio N, and Liberles SD (2021). Hunger enhances food-odour attraction through a neuropeptide Y spotlight. Nature 592, 262–266. 10.1038/s41586-021-03299-4. [DOI] [PMC free article] [PubMed] [Google Scholar]
- 5.Fu O, Iwai Y, Narukawa M, Ishikawa AW, Ishii KK, Murata K, Yoshimura Y, Touhara K, Misaka T, Minokoshi Y, et al. (2019). Hypothalamic neuronal circuits regulating hunger-induced taste modification. Nature communications 10, 4560. 10.1038/s41467-019-12478-x. [DOI] [PMC free article] [PubMed] [Google Scholar]
- 6.Fitzsimons JT (1978). Angiotensin, thirst, and sodium appetite: retrospect and prospect. Fed Proc 37, 2669–2675. [PubMed] [Google Scholar]
- 7.McKinley MJ, and Johnson AK (2004). The physiological regulation of thirst and fluid intake. News Physiol Sci 19, 1–6. [DOI] [PubMed] [Google Scholar]
- 8.Farquhar WB, Edwards DG, Jurkovitz CT, and Weintraub WS (2015). Dietary Sodium and Health: More Than Just Blood Pressure. J Am Coll Cardiol 65, 1042–1050. 10.1016/j.jacc.2014.12.039. [DOI] [PMC free article] [PubMed] [Google Scholar]
- 9.Jobin K, Stumpf NE, Schwab S, Eichler M, Neubert P, Rauh M, Adamowski M, Babyak O, Hinze D, Sivalingam S, et al. (2020). A high-salt diet compromises antibacterial neutrophil responses through hormonal perturbation. Science Translational Medicine 12, eaay3850. 10.1126/scitranslmed.aay3850. [DOI] [PubMed] [Google Scholar]
- 10.Wilck N, Matus MG, Kearney SM, Olesen SW, Forslund K, Bartolomaeus H, Haase S, Mähler A, Balogh A, Markó L, et al. (2017). Salt-responsive gut commensal modulates TH17 axis and disease. Nature 551, 585–589. 10.1038/nature24628. [DOI] [PMC free article] [PubMed] [Google Scholar]
- 11.Beauchamp GK, Bertino M, Burke D, and Engelman K (1990). Experimental sodium depletion and salt taste in normal human volunteers. The American journal of clinical nutrition 51, 881–889. [DOI] [PubMed] [Google Scholar]
- 12.Roper SD, and Chaudhari N (2017). Taste buds: cells, signals and synapses. Nat Rev Neurosci 18, 485–497. 10.1038/nrn.2017.68. [DOI] [PMC free article] [PubMed] [Google Scholar]
- 13.Oka Y, Butnaru M, von Buchholtz L, Ryba NJ, and Zuker CS (2013). High salt recruits aversive taste pathways. Nature 494, 472–475. 10.1038/nature11905. [DOI] [PMC free article] [PubMed] [Google Scholar]
- 14.Chandrashekar J, Hoon MA, Ryba NJ, and Zuker CS (2006). The receptors and cells for mammalian taste. Nature 444, 288–294. 10.1038/nature05401. [DOI] [PubMed] [Google Scholar]
- 15.Duriez A, Bergerot C, Cone JJ, Roitman MF, and Gutkin B (2023). Homeostatic Reinforcement Theory Accounts for Sodium Appetitive State- and Taste-Dependent Dopamine Responding. Nutrients 15, 1015. 10.3390/nu15041015. [DOI] [PMC free article] [PubMed] [Google Scholar]
- 16.Geerling JC, and Loewy AD (2008). Central regulation of sodium appetite. Experimental physiology 93, 177–209. 10.1113/expphysiol.2007.039891. [DOI] [PubMed] [Google Scholar]
- 17.Heck GL, Mierson S, and DeSimone JA (1984). Salt taste transduction occurs through an amiloride-sensitive sodium transport pathway. Science 223, 403–405. [DOI] [PubMed] [Google Scholar]
- 18.Chandrashekar J, Kuhn C, Oka Y, Yarmolinsky DA, Hummler E, Ryba NJ, and Zuker CS (2010). The cells and peripheral representation of sodium taste in mice. Nature 464, 297–301. 10.1038/nature08783. [DOI] [PMC free article] [PubMed] [Google Scholar]
- 19.Ninomiya Y (1996). Salt taste responses of mouse chorda tympani neurons: evidence for existence of two different amiloride-sensitive receptor components for NaCl with different temperature dependencies. J Neurophysiol 76, 3550–3554. 10.1152/jn.1996.76.5.3550. [DOI] [PubMed] [Google Scholar]
- 20.Lewandowski BC, Sukumaran SK, Margolskee RF, and Bachmanov AA (2016). AmilorideInsensitive Salt Taste Is Mediated by Two Populations of Type III Taste Cells with Distinct Transduction Mechanisms. The Journal of neuroscience : the official journal of the Society for Neuroscience 36, 1942–1953. 10.1523/JNEUROSCI.2947-15.2016. [DOI] [PMC free article] [PubMed] [Google Scholar]
- 21.Jarvie BC, and Palmiter RD (2017). HSD2 neurons in the hindbrain drive sodium appetite. Nature neuroscience 20, 167–169. 10.1038/nn.4451. [DOI] [PubMed] [Google Scholar]
- 22.Augustine V, Lee S, and Oka Y (2020). Neural Control and Modulation of Thirst, Sodium Appetite, and Hunger. Cell 180, 25–32. 10.1016/j.cell.2019.11.040. [DOI] [PMC free article] [PubMed] [Google Scholar]
- 23.Resch JM, Fenselau H, Madara JC, Wu C, Campbell JN, Lyubetskaya A, Dawes BA, Tsai LT, Li MM, Livneh Y, et al. (2017). Aldosterone-Sensing Neurons in the NTS Exhibit State-Dependent Pacemaker Activity and Drive Sodium Appetite via Synergy with Angiotensin II Signaling. Neuron 96, 190206 e7. 10.1016/j.neuron.2017.09.014. [DOI] [PMC free article] [PubMed] [Google Scholar]
- 24.Geerling JC, and Loewy AD (2006). Aldosterone-sensitive neurons in the nucleus of the solitary tract: efferent projections. The Journal of comparative neurology 497, 223–250. 10.1002/cne.20993. [DOI] [PubMed] [Google Scholar]
- 25.Lee S, Augustine V, Zhao Y, Ebisu H, Ho B, Kong D, and Oka Y (2019). Chemosensory modulation of neural circuits for sodium appetite. Nature 568, 93–97. 10.1038/s41586-019-1053-2. [DOI] [PMC free article] [PubMed] [Google Scholar]
- 26.Geerling JC, and Loewy AD (2007). Sodium deprivation and salt intake activate separate neuronal subpopulations in the nucleus of the solitary tract and the parabrachial complex. The Journal of comparative neurology 504, 379–403. 10.1002/cne.21452. [DOI] [PubMed] [Google Scholar]
- 27.Fitts DA, Freece JA, Van Bebber JE, Zierath DK, and Bassett JE (2004). Effects of forebrain circumventricular organ ablation on drinking or salt appetite after sodium depletion or hypernatremia. American journal of physiology. Regulatory, integrative and comparative physiology 287, R1325–34. 10.1152/ajpregu.00391.2004. [DOI] [PubMed] [Google Scholar]
- 28.Hiyama TY, Watanabe E, Okado H, and Noda M (2004). The subfornical organ is the primary locus of sodium-level sensing by Na(x) sodium channels for the control of salt-intake behavior. The Journal of neuroscience : the official journal of the Society for Neuroscience 24, 9276–9281. [DOI] [PMC free article] [PubMed] [Google Scholar]
- 29.Ch’ng SS, and Lawrence AJ (2019). The subfornical organ in sodium appetite: Recent insights. Neuropharmacology 154, 107–113. 10.1016/j.neuropharm.2018.08.012. [DOI] [PubMed] [Google Scholar]
- 30.Pool A-H, Wang T, Stafford DA, Chance RK, Lee S, Ngai J, and Oka Y (2020). The cellular basis of distinct thirst modalities. Nature 588, 112–117. 10.1038/s41586-020-2821-8. [DOI] [PMC free article] [PubMed] [Google Scholar]
- 31.Matsuda T, Hiyama TY, Niimura F, Matsusaka T, Fukamizu A, Kobayashi K, Kobayashi K, and Noda M (2017). Distinct neural mechanisms for the control of thirst and salt appetite in the subfornical organ. Nature neuroscience 20, 230–241. 10.1038/nn.4463. [DOI] [PubMed] [Google Scholar]
- 32.Wright J, and Colling A (1995). CHAPTER 6 - THE SEAWATER SOLUTION. In Seawater: its Composition, Properties and Behaviour (Second Edition), Wright J and Colling A, eds. (Pergamon; ), pp. 85–127. 10.1016/B978-0-08-042518-4.50011-6. [DOI] [Google Scholar]
- 33.Stein MK, and Loewy AD (2010). Area postrema projects to FoxP2 neurons of the pre-locus coeruleus and parabrachial nuclei: brainstem sites implicated in sodium appetite regulation. Brain Res 1359, 116–127. 10.1016/j.brainres.2010.08.085. [DOI] [PMC free article] [PubMed] [Google Scholar]
- 34.Vivas L, Pastuskovas CV, and Tonelli L (1995). Sodium depletion induces Fos immunoreactivity in circumventricular organs of the lamina terminalis. Brain Res 679, 34–41. 10.1016/0006-8993(95)00208-8. [DOI] [PubMed] [Google Scholar]
- 35.Wu YE, Pan L, Zuo YN, Li XM, and Hong WZ (2017). Detecting Activated Cell Populations Using Single-Cell RNA-Seq. Neuron 96, 313-+. 10.1016/j.neuron.2017.09.026. [DOI] [PubMed] [Google Scholar]
- 36.Eng CL, Lawson M, Zhu Q, Dries R, Koulena N, Takei Y, Yun J, Cronin C, Karp C, Yuan GC, et al. (2019). Transcriptome-scale super-resolved imaging in tissues by RNA seqFISH. Nature 568, 235–239. 10.1038/s41586-019-1049-y. [DOI] [PMC free article] [PubMed] [Google Scholar]
- 37.Lohoff T, Ghazanfar S, Missarova A, Koulena N, Pierson N, Griffiths JA, Bardot ES, Eng C-HL, Tyser RCV, Argelaguet R, et al. (2022). Integration of spatial and single-cell transcriptomic data elucidates mouse organogenesis. Nat Biotechnol 40, 74–85. 10.1038/s41587-021-01006-2. [DOI] [PMC free article] [PubMed] [Google Scholar]
- 38.Zhang Y, Hoon MA, Chandrashekar J, Mueller KL, Cook B, Wu D, Zuker CS, and Ryba NJ (2003). Coding of sweet, bitter, and umami tastes: different receptor cells sharing similar signaling pathways. Cell 112, 293–301. [DOI] [PubMed] [Google Scholar]
- 39.Pérez CA, Huang L, Rong M, Kozak JA, Preuss AK, Zhang H, Max M, and Margolskee RF (2002). A transient receptor potential channel expressed in taste receptor cells. Nat Neurosci 5, 1169–1176. 10.1038/nn952. [DOI] [PubMed] [Google Scholar]
- 40.Leffler A, Mönter B, and Koltzenburg M (2006). The role of the capsaicin receptor TRPV1 and acid-sensing ion channels (ASICS) in proton sensitivity of subpopulations of primary nociceptive neurons in rats and mice. Neuroscience 139, 699–709. 10.1016/j.neuroscience.2005.12.020. [DOI] [PubMed] [Google Scholar]
- 41.Teng B, Wilson CE, Tu Y-H, Joshi NR, Kinnamon SC, and Liman ER (2019). Cellular and Neural Responses to Sour Stimuli Require the Proton Channel Otop1. Curr Biol 29, 3647–3656.e5. 10.1016/j.cub.2019.08.077. [DOI] [PMC free article] [PubMed] [Google Scholar]
- 42.Zhang J, Jin H, Zhang W, Ding C, O’Keeffe S, Ye M, and Zuker CS (2019). Sour Sensing from the Tongue to the Brain. Cell 179, 392–402 e15. 10.1016/j.cell.2019.08.031. [DOI] [PubMed] [Google Scholar]
- 43.Caterina MJ, Schumacher MA, Tominaga M, Rosen TA, Levine JD, and Julius D (1997). The capsaicin receptor: a heat-activated ion channel in the pain pathway. Nature 389, 816–824. 10.1038/39807. [DOI] [PubMed] [Google Scholar]
- 44.Nelson G, Hoon MA, Chandrashekar J, Zhang Y, Ryba NJ, and Zuker CS (2001). Mammalian sweet taste receptors. Cell 106, 381–390. [DOI] [PubMed] [Google Scholar]
- 45.Ricciotti E, and FitzGerald GA (2011). Prostaglandins and Inflammation. Arterioscler Thromb Vasc Biol 31, 986–1000. 10.1161/ATVBAHA.110.207449. [DOI] [PMC free article] [PubMed] [Google Scholar]
- 46.Kawahara K, Hohjoh H, Inazumi T, Tsuchiya S, and Sugimoto Y (2015). Prostaglandin E2-induced inflammation: Relevance of prostaglandin E receptors. Biochimica et Biophysica Acta (BBA) - Molecular and Cell Biology of Lipids 1851, 414–421. 10.1016/j.bbalip.2014.07.008. [DOI] [PubMed] [Google Scholar]
- 47.Machado NLS, Bandaru SS, Abbott SBG, and Saper CB (2020). EP3R-Expressing Glutamatergic Preoptic Neurons Mediate Inflammatory Fever. J Neurosci 40, 2573–2588. 10.1523/JNEUROSCI.2887-19.2020. [DOI] [PMC free article] [PubMed] [Google Scholar]
- 48.Lazarus M, Yoshida K, Coppari R, Bass CE, Mochizuki T, Lowell BB, and Saper CB (2007). EP3 prostaglandin receptors in the median preoptic nucleus are critical for fever responses. Nat Neurosci 10, 1131–1133. 10.1038/nn1949. [DOI] [PubMed] [Google Scholar]
- 49.Vane JR (1971). Inhibition of Prostaglandin Synthesis as a Mechanism of Action for Aspirin-like Drugs. Nature New Biology 231, 232–235. 10.1038/newbio231232a0. [DOI] [PubMed] [Google Scholar]
- 50.Bacchi S, Palumbo P, Sponta A, and Coppolino MF (2012). Clinical pharmacology of non-steroidal anti-inflammatory drugs: a review. Antiinflamm Antiallergy Agents Med Chem 11, 52–64. 10.2174/187152312803476255. [DOI] [PubMed] [Google Scholar]
- 51.Vane JR, Bakhle YS, and Botting RM (1998). Cyclooxygenases 1 and 2. Annu Rev Pharmacol Toxicol 38, 97–120. 10.1146/annurev.pharmtox.38.1.97. [DOI] [PubMed] [Google Scholar]
- 52.Yamamoto T, Habuchi Y, Tanaka H, Suto F, Morikawa J, Kashima K, and Yoshimura M (1999). EP receptor-mediated inhibition by prostaglandin E(1) of cardiac L-type Ca(2+) current of rabbits. Am J Physiol 277, H1369–1374. 10.1152/ajpheart.1999.277.4.H1369. [DOI] [PubMed] [Google Scholar]
- 53.Verharen JPH, Roelofs TJM, Menting-Henry S, Luijendijk MCM, Vanderschuren LJMJ, and Adan RAH (2019). Limbic control over the homeostatic need for sodium. Sci Rep 9, 1050. 10.1038/s41598-018-37405-w. [DOI] [PMC free article] [PubMed] [Google Scholar]
- 54.Roitman MF, Schafe GE, Thiele TE, and Bernstein IL (1997). Dopamine and sodium appetite: Antagonists suppress sham drinking of NaC1 solutions in the rat. Behavioral Neuroscience 111, 606–611. 10.1037/0735-7044.111.3.606. [DOI] [PubMed] [Google Scholar]
- 55.Hsu TM, Bazzino P, Hurh SJ, Konanur VR, Roitman JD, and Roitman MF (2020). Thirst recruits phasic dopamine signaling through subfornical organ neurons. Proceedings of the National Academy of Sciences 117, 30744–30754. 10.1073/pnas.2009233117. [DOI] [PMC free article] [PubMed] [Google Scholar]
- 56.Augustine V, Ebisu H, Zhao Y, Lee S, Ho B, Mizuno GO, Tian L, and Oka Y (2019). Temporally and Spatially Distinct Thirst Satiation Signals. Neuron 103, 242–249 e4. 10.1016/j.neuron.2019.04.039. [DOI] [PMC free article] [PubMed] [Google Scholar]
- 57.Patriarchi T, Cho JR, Merten K, Howe MW, Marley A, Xiong WH, Folk RW, Broussard GJ, Liang R, Jang MJ, et al. (2018). Ultrafast neuronal imaging of dopamine dynamics with designed genetically encoded sensors. Science 360. 10.1126/science.aat4422. [DOI] [PMC free article] [PubMed] [Google Scholar]
- 58.Patriarchi T, Cho JR, Merten K, Marley A, Broussard GJ, Liang R, Williams J, Nimmerjahn A, von Zastrow M, Gradinaru V, et al. (2019). Imaging neuromodulators with high spatiotemporal resolution using genetically encoded indicators. Nat Protoc 14, 3471–3505. 10.1038/s41596-019-0239-2. [DOI] [PubMed] [Google Scholar]
- 59.Jin H, Fishman ZH, Ye M, Wang L, and Zuker CS (2021). Top-Down Control of Sweet and Bitter Taste in the Mammalian Brain. Cell 184, 257–271 e16. 10.1016/j.cell.2020.12.014. [DOI] [PubMed] [Google Scholar]
- 60.Inagaki HK, Panse K, and Anderson DJ (2014). Independent, reciprocal neuromodulatory control of sweet and bitter taste sensitivity during starvation in Drosophila. Neuron 84, 806–820. 10.1016/j.neuron.2014.09.032. [DOI] [PMC free article] [PubMed] [Google Scholar]
- 61.Devineni AV, Sun B, Zhukovskaya A, and Axel R (2019). Acetic acid activates distinct taste pathways in Drosophila to elicit opposing, state-dependent feeding responses. Elife 8, e47677. 10.7554/eLife.47677. [DOI] [PMC free article] [PubMed] [Google Scholar]
- 62.Shigemura N, Iwata S, Yasumatsu K, Ohkuri T, Horio N, Sanematsu K, Yoshida R, Margolskee RF, and Ninomiya Y (2013). Angiotensin II Modulates Salty and Sweet Taste Sensitivities. J. Neurosci. 33, 6267–6277. 10.1523/JNEUROSCI.5599-12.2013. [DOI] [PMC free article] [PubMed] [Google Scholar]
- 63.Inoue M, McCaughey SA, Bachmanov AA, and Beauchamp GK (2001). Whole-nerve chorda tympani responses to sweeteners in C57BL/6ByJ and 129P3/J mice. Chem Senses 26, 915–923. [DOI] [PMC free article] [PubMed] [Google Scholar]
- 64.Danilova V, and Hellekant G (2003). Comparison of the responses of the chorda tympani and glossopharyngeal nerves to taste stimuli in C57BL/6J mice. BMC Neurosci 4, 5. 10.1186/1471-2202-4-5. [DOI] [PMC free article] [PubMed] [Google Scholar]
- 65.Oka Y, Ye M, and Zuker CS (2015). Thirst driving and suppressing signals encoded by distinct neural populations in the brain. Nature 520, 349–352. 10.1038/nature14108. [DOI] [PMC free article] [PubMed] [Google Scholar]
- 66.Biringer RG (2021). A Review of Prostanoid Receptors: Expression, Characterization, Regulation, and Mechanism of Action. J Cell Commun Signal 15, 155–184. 10.1007/s12079-020-00585-0. [DOI] [PMC free article] [PubMed] [Google Scholar]
- 67.Scammell TE, Elmquist JK, Griffin JD, and Saper CB (1996). Ventromedial Preoptic Prostaglandin E2 Activates Fever-Producing Autonomic Pathways. J Neurosci 16, 6246–6254. 10.1523/JNEUROSCI.16-19-06246.1996. [DOI] [PMC free article] [PubMed] [Google Scholar]
- 68.Saper CB, and Breder CD (1994). The neurologic basis of fever. N Engl J Med 330, 1880–1886. 10.1056/NEJM199406303302609. [DOI] [PubMed] [Google Scholar]
- 69.Lipopolysaccharide-Induced Fever Depends on Prostaglandin E2 Production Specifically in Brain Endothelial Cells | Endocrinology | Oxford Academic; https://academic.oup.com/endo/article/153/10/4849/2424441. [DOI] [PubMed] [Google Scholar]
- 70.Jang Y, Kim M, and Hwang SW (2020). Molecular mechanisms underlying the actions of arachidonic acid-derived prostaglandins on peripheral nociception. Journal of Neuroinflammation 17, 30. 10.1186/s12974-020-1703-1. [DOI] [PMC free article] [PubMed] [Google Scholar]
- 71.Chen H, Hu B, Lv X, Zhu S, Zhen G, Wan M, Jain A, Gao B, Chai Y, Yang M, et al. (2019). Prostaglandin E2 mediates sensory nerve regulation of bone homeostasis. Nat Commun 10, 181. 10.1038/s41467-018-08097-7. [DOI] [PMC free article] [PubMed] [Google Scholar]
- 72.Cochran B (1999). Dehydration, Heat Stroke, or Hyponatremia? The Recognition, Treatment, and Prevention of Hyponatremia Caused by High Exercise Outdoor Activities. [Google Scholar]
- 73.Oliver JA, Pinto J, Sciacca RR, and Cannon PJ (1980). Increased renal secretion of norepinephrine and prostaglandin E2 during sodium depletion in the dog. J Clin Invest 66, 748–756. 10.1172/JCI109912. [DOI] [PMC free article] [PubMed] [Google Scholar]
- 74.Stahl RA, Jonassen AJ, Paravicini M, and Schollmeyer P (1982). Sodium chloride as regulator of renal prostaglandin E2 production in patients with essential hypertension. Klin Wochenschr 60, 579–581. 10.1007/BF01724215. [DOI] [PubMed] [Google Scholar]
- 75.Zapf AM, Grimm PR, Al-Qusairi L, Delpire E, and Welling PA (2022). Low Salt Delivery Triggers Autocrine Release of Prostaglandin E2 From the Aldosterone-Sensitive Distal Nephron in Familial Hyperkalemic Hypertension Mice. Frontiers in Physiology 12. [DOI] [PMC free article] [PubMed] [Google Scholar]
- 76.Verma D, Wood J, Lach G, Herzog H, Sperk G, and Tasan R (2016). Hunger Promotes Fear Extinction by Activation of an Amygdala Microcircuit. Neuropsychopharmacol 41, 431–439. 10.1038/npp.2015.163. [DOI] [PMC free article] [PubMed] [Google Scholar]
- 77.Alhadeff AL, Su ZW, Hernandez E, Klima ML, Phillips SZ, Holland RA, Guo CY, Hantman AW, De Jonghe BC, and Betley JN (2018). A Neural Circuit for the Suppression of Pain by a Competing Need State. Cell 173, 140-+. 10.1016/j.cell.2018.02.057. [DOI] [PMC free article] [PubMed] [Google Scholar]
- 78.Neal B, Wu Y, Feng X, Zhang R, Zhang Y, Shi J, Zhang J, Tian M, Huang L, Li Z, et al. (2021). Effect of Salt Substitution on Cardiovascular Events and Death. New England Journal of Medicine 385, 1067–1077. 10.1056/NEJMoa2105675. [DOI] [PubMed] [Google Scholar]
- 79.Park S, and Sohn J-W (2021). Protocol for sodium depletion and measurement of sodium appetite in mice. STAR Protocols 2, 101026. 10.1016/j.xpro.2021.101026. [DOI] [PMC free article] [PubMed] [Google Scholar]
- 80.Bachmanov AA, Beauchamp GK, and Tordoff MG (2002). Voluntary consumption of NaCl, KCl, CaCl2, and NH4Cl solutions by 28 mouse strains. Behav Genet 32, 445–457. 10.1023/a:1020832327983. [DOI] [PMC free article] [PubMed] [Google Scholar]
- 81.Eylam S, and Spector AC (2005). Taste discrimination between NaCl and KCl is disrupted by amiloride in inbred mice with amiloride-insensitive chorda tympani nerves. American journal of physiology. Regulatory, integrative and comparative physiology 288, R1361–8. 10.1152/ajpregu.00796.2004. [DOI] [PubMed] [Google Scholar]
- 82.Simons CT, Dessirier J-M, Jinks SL, and Carstens E (2001). An Animal Model to Assess Aversion to Intra-oral Capsaicin: Increased Threshold in Mice Lacking Substance P. Chemical Senses 26, 491–497. 10.1093/chemse/26.5.491. [DOI] [PubMed] [Google Scholar]
- 83.Augustine V, Gokce SK, Lee S, Wang B, Davidson TJ, Reimann F, Gribble F, Deisseroth K, Lois C, and Oka Y (2018). Hierarchical neural architecture underlying thirst regulation. Nature 555, 204–209. 10.1038/nature25488. [DOI] [PMC free article] [PubMed] [Google Scholar]
- 84.Frommel TO, Dyavanapalli M, Oldham T, Kazi N, Lietz H, Liao Y, and Mobarhan S (1997). Effect of aspirin on prostaglandin E2 and leukotriene B4 production in human colonic mucosa from cancer patients. Clin Cancer Res 3, 209–213. [PubMed] [Google Scholar]
- 85.Bin N-R, Prescott SL, Horio N, Wang Y, Chiu IM, and Liberles SD (2023). An airway-to-brain sensory pathway mediates influenza-induced sickness. Nature 615, 660–667. 10.1038/s41586-023-05796-0. [DOI] [PMC free article] [PubMed] [Google Scholar]
- 86.Zocchi D, Wennemuth G, and Oka Y (2017). The cellular mechanism for water detection in the mammalian taste system. Nature neuroscience 20, 927–933. 10.1038/nn.4575. [DOI] [PubMed] [Google Scholar]
- 87.Butler A, Hoffman P, Smibert P, Papalexi E, and Satija R (2018). Integrating single-cell transcriptomic data across different conditions, technologies, and species. Nature biotechnology 36, 411–420. 10.1038/nbt.4096. [DOI] [PMC free article] [PubMed] [Google Scholar]
- 88.Stuart T, Butler A, Hoffman P, Hafemeister C, Papalexi E, Mauck WM, Hao Y, Stoeckius M, Smibert P, and Satija R (2019). Comprehensive Integration of Single-Cell Data. Cell 177, 1888–1902 e21. 10.1016/j.cell.2019.05.031. [DOI] [PMC free article] [PubMed] [Google Scholar]
Associated Data
This section collects any data citations, data availability statements, or supplementary materials included in this article.
Supplementary Materials
Figure S1. Salt tolerance is enhanced under sodium depletion but not under thirst or pre-LCPdyn-induced appetite, related to Figure 1.
(A) A diagram of appetitive and aversive salt taste pathways. Low concentrations of salt only activate the appetitive ENaC pathway, and animals exhibit a behavioral attraction. Higher concentrations of salt recruit additional aversive taste pathways (bitter and sour), driving strong behavioral aversion despite the activation of appetitive ENaC pathway. (B-C) Cumulative consumption curves under osmotic thirst and sodium-depleted conditions from the data in Figure 1A.
(D) The total lick numbers were quantified from the data in Figure 1D. Unstimulated control data (grey) were shown together.
(E) Left, Comparison of low- and high-salt consumption in pre-LCPdyn-stimulated animals (blue) and sodium-depleted animals (red). Right, consumption ratio between low salt and high salt. pre-LCPdyn-stimulated animals preferred low salt while sodium-depleted animals consumed significantly more high salt (n = 12–15 mice). The data were reanalyzed from Figure 1D.
(F) Sodium-selective, behavioral attraction is mediated by pre-LCPdyn neurons. The number of licks toward high salt (500 mM NaCl) was quantified during pre-LCPdyn photostimulation with or without 30 μM amiloride. High salt consumption induced by pre-LCPdyn neurons was ENaC dependent (n = 5–6 mice).
Data are expressed as mean ± SEM, *p < 0.05, **p < 0.01, ***p < 0.001. See also Table S1.
Figure S2. Neural activation of SFO and OVLT under sodium depletion and hypovolemia, related to Figure 2.
(A) Representative images of OVLT activation in sated (top) and sodium-depleted (bottom) conditions. The OVLT was visualized with nNos (blue) and Fos (red) activation was compared between conditions.
(B) Violin plots of Fos (red) and Ptger3 (blue) in the SFO under hypovolemia conditions. Ptger3-expressed neurons were a partial population active in hypovolemia.
(C) Representative Fos immunofluorescence signals (red) under hypovolemia in the SFO. Ptger3 neurons are labeled in green.
(D) Spatial distribution of all cells according to the original cell center coordinates. Individual excitatory neuron types are highlighted in colors (as indicated).
Scale bar, 25 μm (C, magnified images), 100 μm (A, C, and D). See also Table S1.
Figure S3. Functional characterization of SFOPtger3 neurons, related to Figure 3.
(A) Characterization of Ptger3Cre transgenic line in the whole brain. Shown are representative GFP signals from a Ptger3Cre/wt animal. Strong GFP signals were found in the SFO, island of Calleja major (ICjM), preoptic area (POA), paraventricular thalamus (PVT), cortex, periaqueductal gray (PAG), and raphe pallidus (RPa).
(B) Quantified Fos+ cells in the SFO that overlapped with Ptger3-GFP signals. Shown are the ratio of activated Ptger3+ neurons divided by total Fos+ cells (n = 2–6 sections from 2–5 mice).
(C) Representative images of Ptger3-Cre:GFP (green) overlap with AAV-DIO-ChR2-mCherry (red). 88% of mCherry+ neurons expressed Ptger3-Cre:GFP, and 72% of Cre:GFP+ neurons were mCherry+ (n = 7 sections from 6 mice).
(D) Relationship between virus expression level and salt tolerance. The number of ChR2+ neurons per section and lick numbers toward high salt are shown for individual animals tested. Note that salt tolerance and the number of ChR2+ neurons have a high correlation coefficient (n = 16 mice).
(E) Control experiments for ChR2 photostimulation using mCherry (n = 5 mice).
(F) Amiloride did not affect salt tolerance induced by SFOPtger3. Unlike pre-LCPdyn neurons, SFOPtger3 -induced tolerance is independent of the ENaC pathway (n = 5 mice).
(G) Sodium-depletion-induced tolerance in thirsty mice. Mice were subjected to osmotic thirst (grey) and osmotic thirst + sodium depletion (red), and the number of licks toward 250 and 500 mM NaCl were quantified (n = 6–12 mice). The thirst data for 250 mM NaCl included the data from Figure 3D.
(H) A representative image of Ptger3 (green) and Fos (red) immunofluorescence signals in the OVLT.
(I) LTPtger3 neurons are required for normal salt tolerance under hypovolemia. The number of licks toward 500 mM NaCl during a 30-min trial with vehicle (grey) or CNO (red) injection under hypovolemia (n = 6 mice).
(J) SFOPtger3 neurons are required for normal salt tolerance. Left, a diagram of chemogenetic loss-of-function experiments. AAV-DIO-hM4Di was injected into the SFO. Right, the number of licks for low salt, low salt with KCl or quinine was quantified during a 30-min session under sodium depletion. Before behavioral experiments, animals received intraperitoneal injection of either vehicle (grey) or CNO (red) (n = 6 mice).
Data are expressed as mean ± SEM, *p < 0.05, **p < 0.01, ***p < 0.001. Scale bar, 500 μm (A), 100 μm (C and H). See also Table S1.
Figure S4. Specificity of sensory modulation by SFOPtger3 neurons, related to Figure 5.
(A) Trpm5−/− animals that lack bitter, sweet, and umami tastes showed elevated tolerance toward aversive tastes. Left, consumption of water and 60 mM NaCl during a 30-min session under osmotic thirst in wild-type (grey) and Trpm5−/− mice (red, n = 3–14). Right, consumption of 500 mM NaCl, 60 mM NaCl with 440 mM KCl, and 60 mM NaCl with 0.25 mM quinine during a 30-min session under osmotic thirst in wild-type (grey) and Trmp5−/− mice (red) (n = 3–14). For wild-type control, the data were reanalyzed from Figure 1A. (B) Stimulation of pre-LCPdyn neurons did not affect behavioral aversion toward bitter tastes. The number of licks was quantified for water, 0.125 and 0.25 mM quinine under osmotic thirst conditions in the absence (black) or presence (red) of photostimulation to pre-LCPdyn neurons (n = 4–6 mice).
(C) Learned taste aversion was not alleviated by the activity of SFOPtger3 neurons. Left, a conditioned-taste-avoidance paradigm toward AceK (2 mM) by LiCl injection. Right, consumption of AceK before (grey) and after (−stim, blue; +stim, red) conditioning (n = 6). (D-E) Various aversive stimuli were presented to animals under sated, sodium-depleted, and SFOPtger3-stimulated conditions. Animals were subjected to noxious heat on a hot plate (D), and von Frey test (E). Neither sodium depletion nor SFOPtger3-stimulation blunted general aversive or tactile responses (n = 4–12 mice).
(F) Acute and inflammatory pain test. Left, a histogram showing the time spent paw-licking after formalin injection plotted in 5-min bins in sated and sodium-depleted conditions. Right, a cumulative time of paw-licking during the acute pain period (0–5 min after formalin injection) and the inflammatory pain period (15–45 min after formalin injection). The data were compared between sated (grey) and sodium-depleted (red) groups (n = 4 mice). (G) Photostimulation of SFOPtger3 neurons had no effects on pain responses. Left, a histogram showing the time spent paw-licking after formalin injection without (grey) or with (red) photostimulation. Right, quantified cumulative time of paw-licking (n = 4 mice). Data are expressed as mean ± SEM, *p < 0.05, **p < 0.01, ***p < 0.001. Scale bar, 100 μm. See also Table S1.
Figure S5. Ptger3 in the SFO plays a major function for aversive taste tolerance, related to Figure 6.
(A) UMAP embedding of Ptger1, Ptger2 and Ptger4 log-normalized expression in the SFO demonstrating minimal expression of these three prostaglandin receptors.
(B) Ptger3Cre/Cre mice did not show tolerance toward aversive taste under osmotic thirst (n = 4–9 mice).
(C) Knocking down of Ptger3 in the SFO in the background of Trpm5−/− animals did not reduce tolerance toward aversive salt under osmotic thirst. The lick number of water and 500 mM NaCl in scramble- (grey) and Ptger3- (red) shRNA- injected Trpm5−/− animals were shown (n = 5–6 mice).
Data are expressed as mean ± SEM, *p < 0.05, **p < 0.01. See also Table S1.
Figure S6. Functional characterization of the PGE2/Ptger3 axis for aversive taste tolerance, related to Figure 7.
(A) Measurement of inflammation-related factors in the circulation by ELISA. Progesterone and serotonin (5-HT) levels were measured from sated (grey), formalin-injected (blue), and sodium depleted (red) animals (n = 7–8 mice).
(B) Control stimuli for fiber photometry recording from SFOPtger3 neurons. These neurons showed no activation toward i.p. mannitol injection (2 M, 10 ml per kg BW; osmotic thirst), ghrelin (10 μg; hunger), or LiCl (0.15 M, 15 ml per kg BW; visceral malaise). Calcium dynamics and response amplitude (normalized ΔF/F) of SFOPtger3 neurons are shown (n = 5 mice).
(C) PGE2 activated the SFO in a Ptger3-dependent pattern. Representative images and quantification of Fos immunofluorescence signals after subcutaneous injection of PGE2 in Ptger3Cre/wt (grey, n = 4 mice) and Ptger3Cre/Cre mice (red, n = 4 mice).
(D) Ptger3 in the SFO is required for PGE2 responses. Representative images after subcutaneous injection of PGE2 in scramble- (top) and Ptger3- (bottom) shRNA-injected mice were shown. No Fos signal was found in the pre-LC.
(E) PGE2 induced tolerance in wild-type animals. Consumption of 500 mM NaCl was measured under sated and osmotic thirst after subcutaneous injection of vehicle (grey) or PGE2 (red, n =9 mice).
(F) PGE2-induced aversive taste tolerance in food-deprived, wild-type animals. Left, a diagram of the behavioral paradigm. Right, the number of licks toward 0.25 mM quinine with 500 mM glucose in food-deprived mice after vehicle (grey) or PGE2 injection (red, n = 6).
(G) Thirsty Ptger3Cre/Cre mice consumed pure water after vehicle (grey) or PGE2 (red) subcutaneous injection (n = 4 mice).
(H) Thirsty Ptger3 KD mice consumed pure water after vehicle (grey) or PGE2 (red) subcutaneous injection (n = 8–10 mice).
(I) Formalin-induced inflammation increased tolerance towards 500 mM NaCl during thirst (n = 5–10). Water intake was unaffected by the same treatment.
Data are expressed as mean ± SEM, *p < 0.05, **p < 0.01, ***p < 0.001. Scale bar, 100 μm. See also Table S1.
Figure S7. Bimodal modulations of attractive and aversive taste signals by the brain, related to Figure 7.
(A) A diagram of bimodal salt taste modulation. Low salt through the ENaC pathway and aversive high salt through bitter/sour pathways are modulated by two separate interoceptive circuits in the forebrain (SFO) and hindbrain (pre-LC) circuits. These circuits sense internal sodium balance and trigger bimodal modulation signals that affect the hedonic value of salt in a concentration- and internal-state-dependent manner.
(B-C) B. Representative taste responses from chorda tympani nerve under distinct internal states. C. 10, 30, 60, 120, 250, and 500 mM NaCl were applied to the tongue, and integrated nerve responses were quantified for each concentration (n = 5 mice).
(D) Taste nerve recording with SFOPtger3 photostimulation. Left, a diagram of chorda tympani nerve recording combined with optogenetics. Right, quantification of normalized responses to NaCl without (black), or with photostimulation (red) state (n = 3 mice). ChR2 expression was validated by immunohistology and behavioral tolerance induction.
(E) AAV-DIO-ChR2-EYFP was injected into SFOPtger3 and the downstream projections were visualized. Strong projections were found in the following brain areas: MnPO, vBNST, paraventricular nucleus of the thalamus (PVT), paraventricular nucleus of the hypothalamus (PVN), and dorsomedial hypothalamus (DMH). Scale bar, 100 μm.
Videos S1. SFOPtger3 induced salt tolerance, related to Figure 3. Representative drinking behavior toward high salt under osmotic thirst with photostimulation of SFOPtger3 neurons.
Videos S2. Control experiment for Video S1 without light, related to Figure 3. Representative drinking behavior toward high salt under osmotic thirst without photostimulation of SFOPtger3 neurons.
Data Availability Statement
The scRNA-seq data were deposited at Gene Expression Omnibus repository and and are publicly available as of the date of publication. The seqFish data were deposited at Zenodo. DOIs are listed in the key resources table.
Data reported in this paper will be shared by the lead contact upon request.
Any additional information required to reanalyze data reported in this paper is available from the lead contact upon request.
Key resources table.
| REAGENT or RESOURCE | SOURCE | IDENTIFIER |
|---|---|---|
| Antibodies | ||
| Rabbit anti-FOS | Cell Signaling | No. 2250 |
| Sheep anti-Foxp2 | R&D Systems | AF5647 |
| Chicken anti-GFP | Abcam | ab13970 |
| Rat anti-mCherry | Invitrogen | 16D7 |
| Goat anti-nNos | R&D Systems | AF2416 |
| Bacterial and virus strains | ||
| AAV5-EF1a-DIO-ChR2-EYFP | Penn Vector Core | N/A |
| AAV2-EF1a-DIO-ChR2-mCherry | UNC Vector Core | N/A |
| AAV2-EF1a-DIO-mCherry | UNC Vector Core | N/A |
| AAV8-hSyn-DIO-hM4D(Gi)-mCherry | Addgene | Addgene number:44362 |
| AAV2-hSyn-DIO-hM3D(Gq)-mCherry | Addgene | Addgenenumber: 44361 |
| AAV2-Flex-taCaso3-Tevp | UNC Vector Core | N/A |
| AAV5-Flex-taCasp3-Tevp | UNC Vector Core | N/A |
| AAV9-syn-dLight1.3b | Addgene | Addgene number: 135762 |
| AAV1-syn-FLEX-jGCaMP7s-WPRE | Addgene | Addgene number: 104491 |
| AAV9-GFP-U6-scrmb-shRNA | Vector Biosystems Inc | No. 7777 |
| AAV9-GFP-U6-m-Ptger3-shRNA | Vector Biosystems Inc | No. 7000 |
| Chemicals, peptides, and recombinant proteins | ||
| PGE2 | Sigma | D2250000/P0409-1MG |
| Furosemide | Sigma | F4381 |
| Low-sodium diet | ENVIGO, TD | No.90228 |
| CNO | Sigma | C0832 |
| Formalin | Sigma | HT. 5012 |
| Mannitol | Sigma | M9647 |
| PGE2-AMCA | AAT Bioquest | Q2303063 |
| Papain | Sigma | P3125 |
| Actinomycin D | Sigma | A1410 |
| DNase I | Thermo Scientific | 90083 |
| Ovomucoid inhibitor | Worthington | OI-BSA |
| Ghrelin | Phoenix pharmaceuticals | 031-31 |
| Deposited data | ||
| scRNA-seq | Gene Expression Omnibus | GSE 244245 |
| SeqFish | Zenodo | Zenodo 8381359 |
| Experimental models: Organisms/strains | ||
| C57BL/6J | Jackson Laboratory | No. 0664 |
| PdynCre | Jackson Laboratory | No.027958 |
| Trpm5−/− | Jackson Laboratory | No.013068 |
| Ptger3Cre | Jackson Laboratory | No.035575 |
| Software and algorithms | ||
| MATLAB R2022a | MathWorks | N/A |
| Prism 9.3.1 | GraphPad | N/A |
| LASX | Leica | N/A |
| Photoshop CS5/CC | Adobe | N/A |
| Illustrator CS5/CC | Adobe | N/A |
| Zen Black 2.3 | ||
| VS-ASW-S6 2.8 | Olympus | N/A |
| Python 3.9.12 | Python Software Foundation | N/A |
| R 4.1.2 and 4.1.1 | R Core Team | N/A |