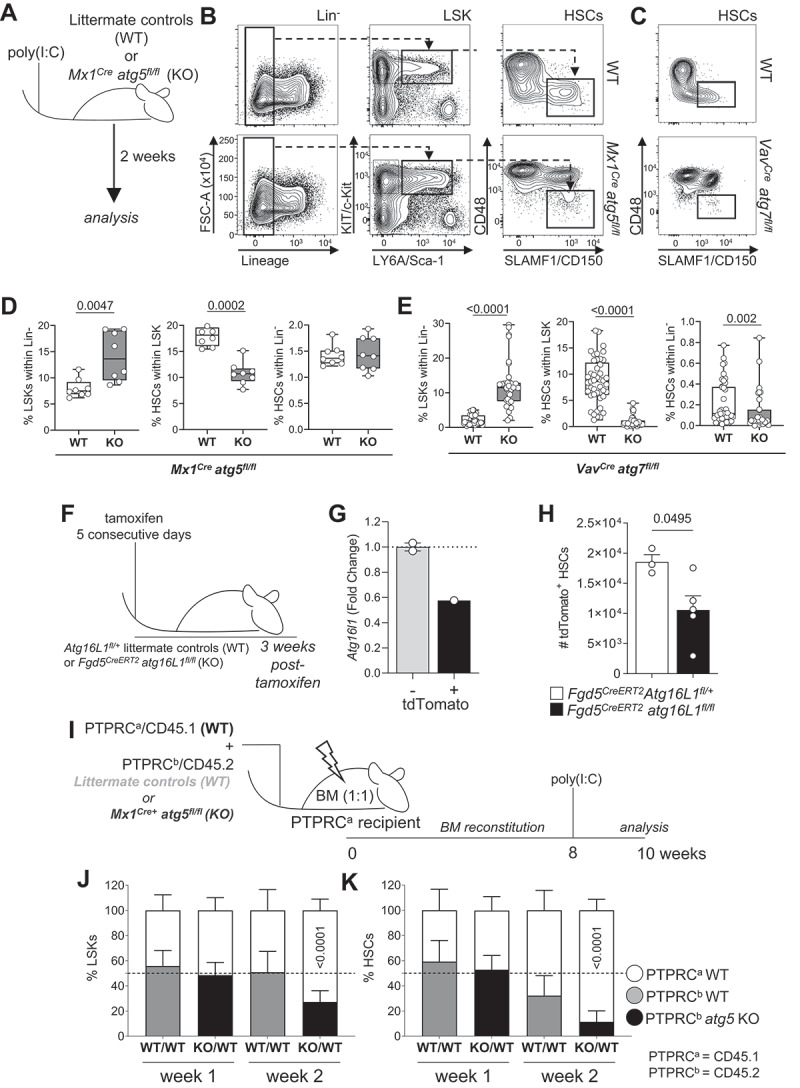
Figure 1.

HSC homeostasis is dependent on cell intrinsic autophagy. (A) Experimental setup for the inducible deletion of Atg5 in hematopoietic cells (Mx1Cre atg5fl/fl). (B) Gating strategy: representative dot plots of littermate controls (WT) and Mx1Cre atg5fl/fl SLAMF1/CD150+ CD48− (HSCs) gated on Lin− LY6A/Sca-1+ KIT/cKit+ (LSK) BM cells 2 weeks after poly(I:C) treatment. (C) Representative dot plots of WT and VavCre atg7fl/fl. (D) LSK frequency within the Lin− population (left panel), HSC frequency within LSK population (middle panel) and HSC frequency within Lin− population (right panel) in Mx1Cre atg5fl/fl (n = 8 mice/group). Data are represented as mean ± SEM with Mann-Whitney test. (E) LSK frequency within the Lin− population (left panel), HSC frequency within LSK population (middle panel) and HSC frequency within Lin− population (right panel) in VavCre atg7fl/fl (n = 45 mice/group). Data are represented as mean ± SEM with Mann-Whitney test. (F) Experimental setup of the tamoxifen-inducible deletion of Atg16l1 and Tomato reporter (Ai14) expression by Fdg5Cre. (G) Atg16l1 transcript levels in Tomato+ LSKs. (H) Total number of Tomato+ HSCs (left and right hip and leg bones) three weeks post-tamoxifen treatment. Data are represented as mean ± SEM with two-tailed unpaired Student’s t test. Representative data from 1 out of 2 experiments (nWT = 3, nKO = 5). (I) Experimental setup for the generation of mixed bone marrow chimeras inducible for deletion of Atg5 (Mx1Cre atg5fl/fl). Lethally irradiated PTPRCa/CD45.1 hosts reconstituted with a 1:1 mix of BM of Mx1Cre atg5fl/fl or WT BM (PTPRCb/CD45.2) and PTPRCa/CD45.1 WT BM. After 8 weeks, Atg5 deletion was induced by poly(I:C) and BM was analyzed at indicated times points after poly(I:C) administration. (J) Frequencies of PTPRCa/CD45.1 cells and PTPRCb/CD45.2 LSKs within Lin− cells from mice reconstituted with PTPRCa/CD45.1 WT:PTPRCb/CD45.2 WT (white/gray) or with PTPRCa/CD45.1 WT:PTPRCb/CD45.2 Mx1Cre atg5fl/fl (white/black) BM. (K) Frequencies of HSCs within LSK in BM chimera. (J, K) data represented as mean ± SEM. n = 3–4 mice. Two-way ANOVA with post hoc Sidak’s test.
