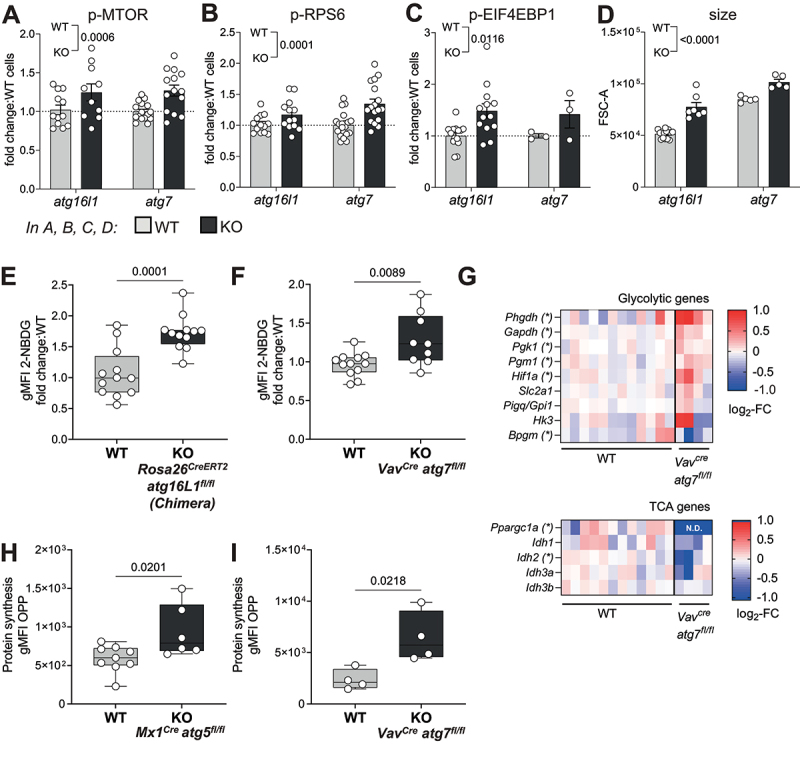
Figure 3.

Increased AA uptake in HSCs results in MTOR activation, cell growth, upregulation of glycolysis and protein translation. (A-C) MTOR activity measured in HSCs from Rosa26CreERT2 atg16lfl/fl (as in fig. S2A) and VavCre atg7fl/fl mice. (A) Phosphorylation of MTOR (p-MTOR), (B) Phosphorylation of RPS6 (p-RPS6) and (C) Phosphorylation of EIF4EBP1 (p-EIF4EBP1) were assessed by flow cytometry. Fold change in gMFI compared with WT littermates is shown. n = 3–20 mice per group. Two-way ANOVA with post hoc Sidak’s test. (D) Relative HSC cell size was measured by forward scatter (FSC) by flow cytometry in Rosa26CreERT2 atg16l1fl/fl and VavCre atg7fl/fl mice. Two-way ANOVA with post hoc Sidak’s test. (E, F) Glucose uptake was assessed by fluorescent 2-NBDG using flow cytometry in HSCs from Rosa26CreERT2 atg16l1fl/fl mixed BM chimeras (E, n = 12) or VavCre atg7fl/fl mice (F, nwt = 12, nKO = 9). Data are represented as mean ± SEM with two-tailed unpaired Student’s t test. (G) Heatmap of TCA or glycolysis related genes measured by Fluidigm in HSCs from VavCre atg7fl/fl mice. Data represented as log2-fold change relative to WT. (H, I) Protein synthesis rate of HSCs was measured using the OPP-Click assay with flow cytometry in HSCs from Mx1Cre atg5fl/fl (H; (nWT = 9, nKO = 7) or VavCre atg7fl/fl (I; n = 4) mice. gMFI of OPP data are represented as mean ± SEM with two-tailed unpaired Student’s t test. WT=Cre− and/or fl/+ littermates.
