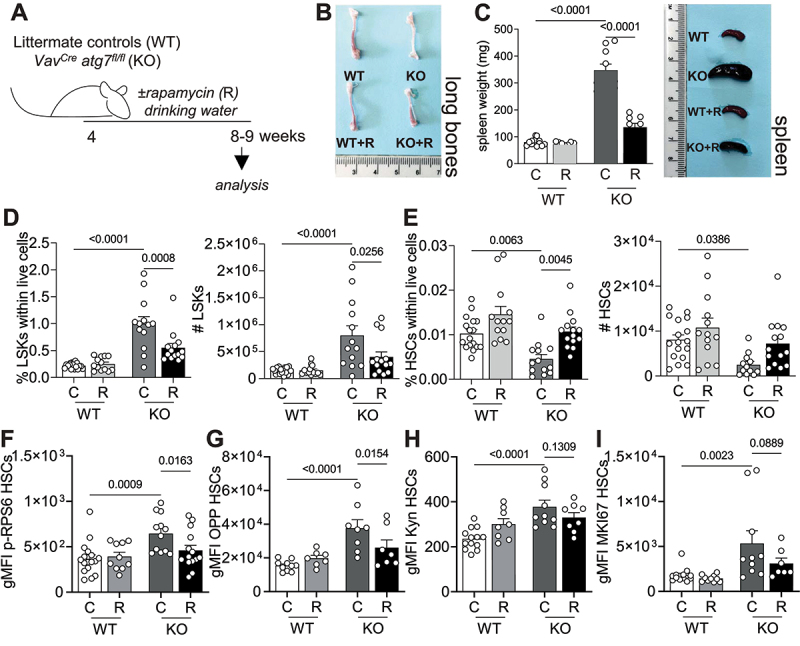
Figure 4.

Rapamycin normalizes the metabolic status of autophagy deficient HSCs. (A) Experimental set-up of rapamycin (R) treatment in VavCre atg7fl/fl mice. (B) Representative images of long bones. (C) Weight and representative images of spleens. (D) LSK frequencies within live cells (left panel) and absolute numbers (right panel). (E) HSC frequencies within live (left panel) cells and absolute numbers (right panel). D-E: (nWT = 17, nWT+R = 13, nKO = 13, nKO+R = 14) (F) gMFI of p-RPS6 within HSCs (nWT = 17, nWT+R = 10, nKO = 13, nKO+R = 14). (G) gMFI of OPP within HSCs as a readout of translation (nWT = 10, nWT+R = 7, nKO = 8, nKO+R = 7). (H) gMFI of Kyn as a readout of AA uptake within HSCs (nWT = 13, nWT+R = 8, nKO = 10, nKO+R = 8). (I) gMFI of MKI67 within HSCs (nWT = 13, nWT+R = 10, nKO = 10, nKO+R = 7). D-E: pooled data from 3–5 independent experiments. Data are represented as mean ± SEM with two-way ANOVA with post hoc Tukey’s test.
